As we wrap up this particular series on how to customize MakerPlot, this time we're going to introduce you to how to create a custom Interface directly from your micro. The "normal" procedure for creating an Interface with meters, switches, pushbuttons, etc., is through macros or text instructions that are, in turn, created by the Object Editor on your PC; we discussed how this is done in the previous two articles. MakerPlot will accept the same set of text instructions via the serial port, just as it does analog and digital data from your micro. What this means is that your micro has full control over the MakerPlot Interface, as it can add and remove controls "on the fly" to suit the application.
For example, if you’re doing a process control operation and only want to monitor temperature, your micro can send just the MakerPlot instructions for displaying a meter to display temperature and nothing else. Then, if you want to switch to monitoring pressure, your micro can send the instructions to erase the temperature meter and put one up for pressure.
What we’re saying is that you don’t have to have everything on the MakerPlot Interface all at once; you can customize the “look” as needed right from your micro’s serial port by adding or eliminating controls as necessary.
In this article, we’ll show you an example of how to accomplish this feature by adding a couple of controls to monitor a potentiometer’s analog value. If you have MakerPlot installed, you can follow along. If you haven’t already done so, you can download a free 30 day trial copy of MakerPlot from www.makerplot.com to follow along. So, let’s get going.
The Plan
Up to this point, we’ve created our Interface switches, buttons, text boxes, and so forth with macros using the Object Editor and Macro Builder (see Parts 8 and 9). Now, we’re going to show you how to do it directly from your micro.
With this capability, you’ll be able to get to a new level of understanding of how MakerPlot works and, also, how you can create Interfaces that don’t involve first loading a complete macro from the PC; the instructions will come directly from your micro — or at least a portion of them will in this example.
Figure 1 is where we’re going to begin.
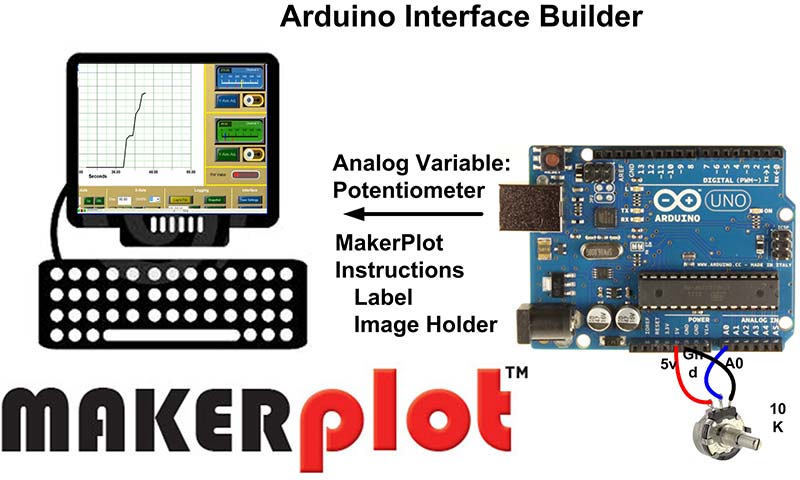
Figure 1. Arduino Interface Builder.
This is our Arduino Uno with a 10K pot attached to the A0 analog input. To display the pot’s value on MakerPlot, we’re going to add two controls: a label called Pot Value and an LED image holder consisting of 10 LED bars to our (already customized) My_Interface.spm Interface. These two controls will NOT be on the Interface screen to begin with; rather, they will be added to it using code from the Arduino.
The Approach
So, let’s discuss the best way to begin to place controls on MakerPlot directly from the Arduino. By the way, it doesn’t have to be an Arduino; you can use most any of the popular micros that have serial output capabilities. The fundamental thing to realize is that all controls on the Interface have specific physical dimensions and placement coordinates.
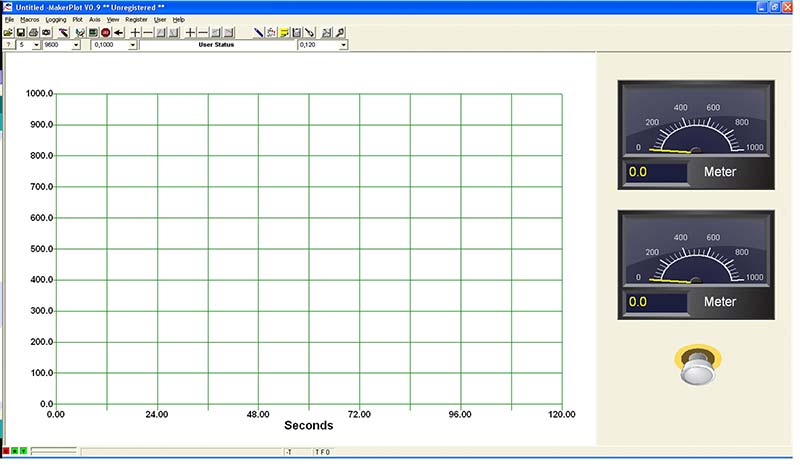
Figure 2 shows the My_Interface.spm Interface with and without the controls we’re referring to. It’s in the marked rectangular area on the left where we’re going to add them (as shown on the right).
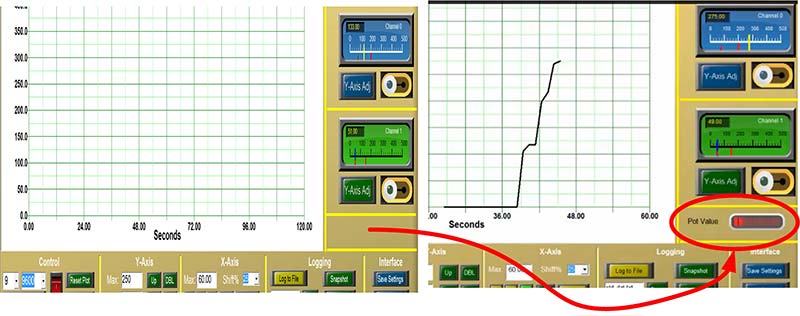
Figure 2. Before and after controls placement.
Once again, the goal is to know what the dimensions and placement coordinates are for these controls before you send the MakerPlot instruction via the micro’s serial port. Here’s how to do it.
The Technique
MakerPlot has an X,Y absolute coordinate system for placing controls in the Object Area; this is the area of the Interface that’s not occupied by the Plot Area. The coordinates range from 0,0 at the bottom-left to 100,100 at the top-right.
Use the Values Tab on the Toolbar to locate these X,Y coordinates as in Figure 3.
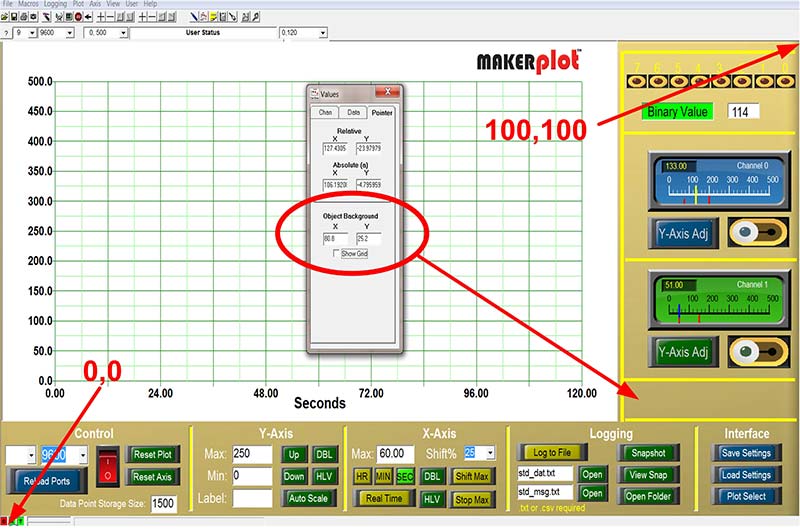
Figure 3. MakerPlot coordinate system.
We’ve moved our cursor to the rectangular area where we want to place the controls that will come from the micro’s serial port. We can then determine the exact location of the top-left of each control using the Object Background X, Y coordinates as shown. Then, we can calculate the sizes of each control and enter them into the instruction code for our micro.
While this is all doable, there’s an easier way.
Rather than do all the calculations, we’re going to first manually place the controls on the Interface just as we did with the other controls — but not permanently. Then, we’re going to let the Object Editor figure out all the pertinent control dimensions and coordinates for us.
Using the methods we showed you in Parts 8 and 9, in the rectangular area below the second meter we’ve placed a Label titled “Pot Value” and an LED bar graph Image Holder (Figure 4).
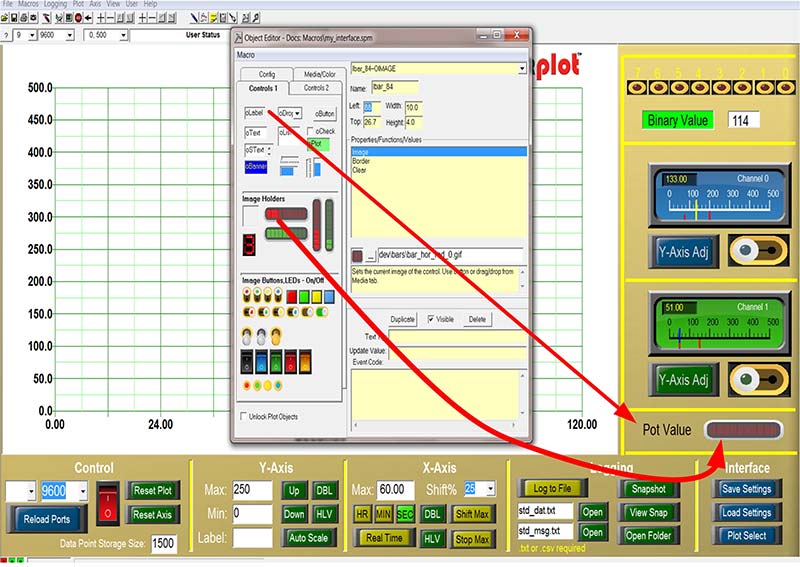
Figure 4. Manually placing controls.
These two controls were sized and oriented to fit exactly where we want them to go using the Object Editor.
Next, we brought up the Macro Builder (Figure 5) to see where these Objects are placed on the Interface.
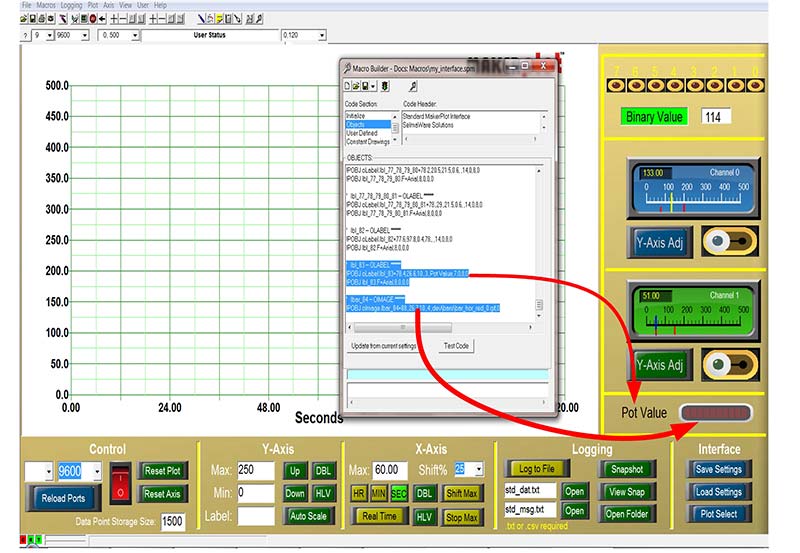
Figure 5. Copy the control instructions to the clipboard.
Clicking on the “Update from current settings” button, we can see that these objects appear as the last two in the Objects listing. This is what they look like:
‘ lbl_83 — OLABEL *****
!POBJ oLabel.lbl_83=78.4,26.6,10.,3.,Pot Value,7,0,8,0
!POBJ lbl_83.F=Arial,8,0,0,0
‘ lbar_84 — OIMAGE *****
!POBJ oImage.lbar_84=88.,26.7,10.,4.,dev\bars\bar_hor_red_0.gif,0
Notice that the Macro Builder has done all the work for us. It’s included the MakerPlot !POBJ (Plot Object) instruction in front of the object types (oLabel.lbl_83 and oImage.lbar_84), and then followed this with the X and Y coordinates and size dimensions — plus everything else that the object needs, like the label (Pot Value) and the type of LED bar graph (bars\bar_hor_red_0.gif). All of this is pretty cryptic, and while it can be done by hand without using the Object Editor and Macro Builder to configure the instructions, it’s certainly more involved and risky compared to this method. (The sidebar has an example of a handmade Interface to illustrate that it can be done.)
The Sketch
All that’s left to do is to “copy and paste” these instructions into our Arduino sketch. In doing so, you’ll still need to prefix each line of text with the Serial.println instruction, as well as enclose each line of text in double quotes (“ “) and end each line with a semi-colon to make it work. The final sketch should look like Figure 6. The sketch is fairly simple in terms of operation.
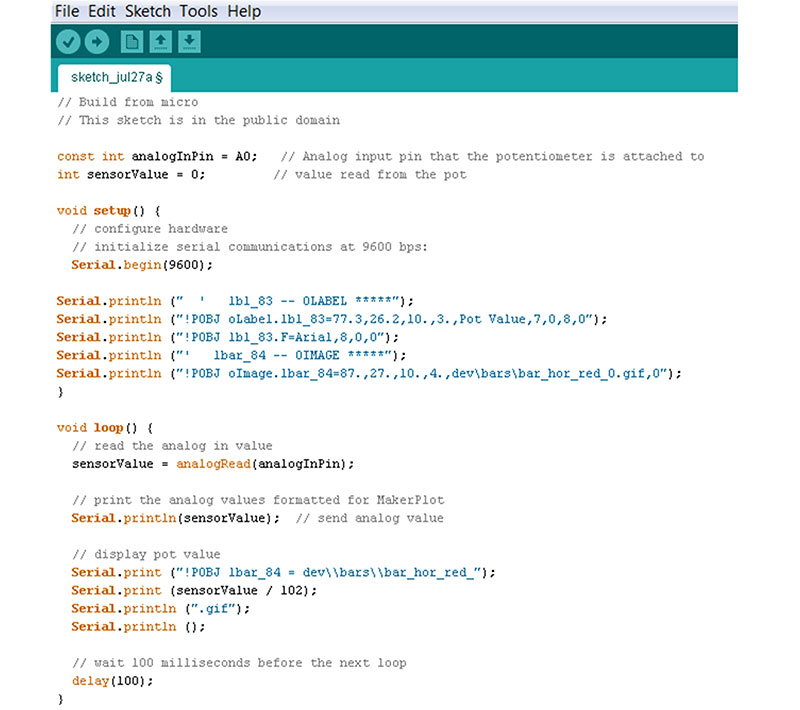
Figure 6. Paste the instructions into the Arduino sketch.
The Setup
After the potentiometer variables are declared, the setup configures the comm port to 9600 baud. Then, the pasted and edited lines are added as shown below:
Serial.println (“ ‘ lbl_83 —OLABEL *****”);
Serial.println (“!POBJ oLabel.lbl_83=77.3,26.2,10.,3.,Pot Value,7,0,8,0”);
Serial.println (“!POBJ lbl_83.F=Arial,8,0,0”);
Serial.println (“‘ lbar_84 — OIMAGE*****”);
Serial.println (“!POBJ oImage.lbar_84=87.,27.,10.,4.,dev\bars\bar_hor_red_0.gif,0”);
Each instruction is on its own separate line. We don’t really need the comments, but it’s okay to leave them in for now. If we want to add more controls, it would be best to leave out the comments as it takes up microcontroller code space with something that MakerPlot doesn’t really use. The take-away from the setup is that these instructions are sent to MakerPlot once to place the controls on the Interface. From here on, the loop takes over and updates both the potentiometer’s analog value (a black plotting line), as well as the LED bar graph.
The Loop
Every 100 milliseconds, the raw 10-bit analog-to-digital (A2D) potentiometer value is read and sent to MakerPlot. That’s handled by these instructions:
void loop() {
// read the analog in value
sensorValue = analogRead(analogInPin);
// print the analog values formatted for MakerPlot
Serial.println(sensorValue); // send analog value
The interesting part comes next; that is, how the LED bar graph gets updated.
The LED bar graph is nothing more than a group of 11 individual .gif images, starting with no LEDs illuminated to all 10 LEDs illuminated, and everything in between (Figure 7).
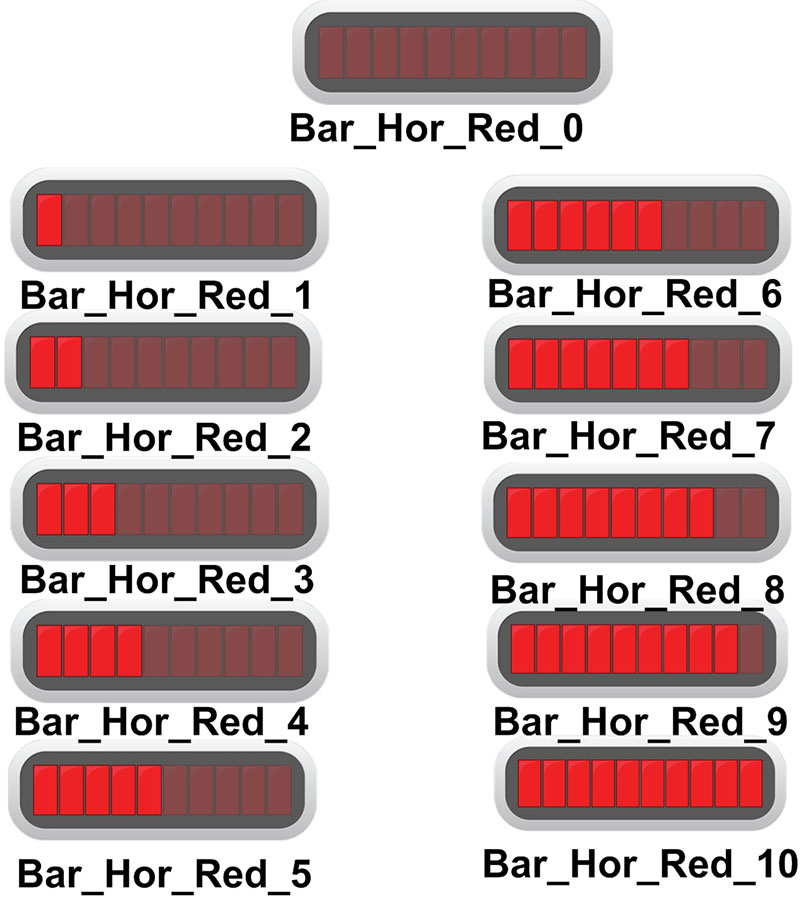
Figure 7. LED bar graphs.
As you can see, each image is labeled at the very end from 0 to 10, so it’s up to the sketch to replace the image on the Interface each time a new potentiometer value is acquired and sent. It does this using the following code:
// display pot value as an LED image bar graph
Serial.print (“!POBJ lbar_84 = dev\\bars\\bar_hor_red_”);
Serial.print (sensorValue / 102); Serial.println (“.gif”);
Serial.println ();
What this code snippet does is construct the name of the LED bar graph image based on the potentiometer value (or sensorValue in the sketch itself).
Here’s how it’s done:
Line 1: Serial.print (“!POBJ lbar_84 = dev\\bars\\bar_hor_red_”);
The first line simply outputs a portion of the bar graph without the actual number appended at the end.
Line 2: Serial.print (sensorValue / 102);
This line takes the sensorValue that can range from 0 to 1023, and divides it by 102 to create a “0 to 10” integer value result. This, then, corresponds to the number of the bar graph to send to MakerPlot.
Line 3: Serial.println (“.gif”);
The next line appends the .gif suffix to the LED bar graph name; the Serial.println instruction also sends a carriage return, thus terminating the MakerPlot instructions. Note that Line 1 and Line 2 used the Serial.print that doesn’t apply a carriage return.
Line 4: Serial.println ();
The last line simply sends a blank carriage return that MakerPlot interprets as the final end of the previous instruction. The final result is the LED bar graph with the appropriate number of lit segments. Since we’ve already placed the first LED bar graph in the setup, all MakerPlot needs is the image name we give it from these four lines.
The Sketch in Action
First, we need to run MakerPlot with the My_Interface.spm Interface. When the red rocker switch is clicked and the sketch is run for the first time, the two controls are placed in the rectangular area as in Figure 4.
As the potentiometer is adjusted, the LED bar graph illuminates with the correct number of bars as in Figure 8.
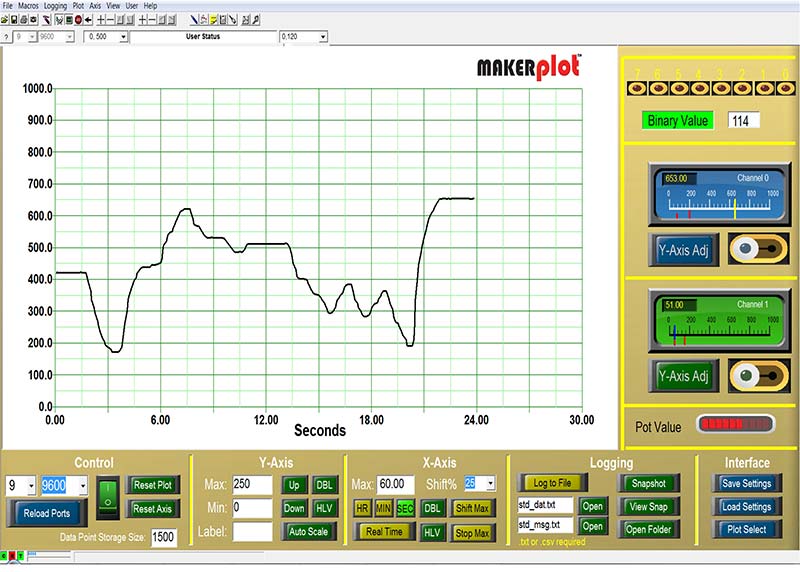
Figure 8. LED bar graph in operation.
Conclusion
While this was a simple example of how to send controls to MakerPlot directly from a micro, it can be expanded to any number of controls and other commands. You don’t even need to start with an existing Interface like we did; your micro can handle all of the instructions to build, reset, and configure it. The sidebar shows an example of this. The ability for on-the-fly Interface building is unique to MakerPlot (as far as we know), and we’ve only shown just a few examples here. So, feel free to experiment with your application for a customized Interface builder using your favorite microcontroller.
We hope that you will continue your journey with this powerful software. There’s plenty of info on the MakerPlot website to keep you going for quite a while. Remember, if you decide after using your 30 day free trial you want to purchase it, you can order it through the Nuts & Volts webstore at a discounted price.
That’s all for now, so just remember: Got Data – MakerPlot It!
The following is an excerpt from the MakerPlot Guide that illustrates another example of creating an entire Interface from an Arduino microcontroller.
The Guide can be found at www.makerplot.com. This text is accompanied by a graphic of the completed Interface. Note that the entire Interface is built, configured, and initialized from the Arduino — nothing was built on the PC at all. It's short and sweet, and it gets the point across.
Creating an Interface entirely from an Arduino.
Creating an Interface from the Arduino
One really interesting aspect of MakerPlot is that all instructions can come from a variety of sources for total control. This allows a controller to totally configure MakerPlot once connected — first, have the controller set up the interface. Then, have it size the plot and add meters and other controls for monitoring or interactive control.
The easiest way to do this is to design the Interface normally, build the Interface, then create code from the initializations and object code. Be sure to replace any / with //:
void MP_Config()
{
Serial.println("!NEWP"); // Start a new plot
Serial.println("!SPAN 0,1000"); // Span Y axis
Serial.println("!POBJ Clear"); // Clear any objects
Serial.println("!PPER 75,100"); // Size plot
// Create meters called 'met1' and 'met2' scaled 0 - 1000, auto update on channels 0 and 1.
Serial.println("!POBJ MP_METER_OBJ.met1=78.,93.,20.,28.,0, 1000,Meter,Blue-Gray,0,1");
Serial.println("!POBJ MP_METER_OBJ.met2=78.,60.,20.,28.,0, 1000,Meter,Blue-Gray,1,1");
// Create a toggle switch called 'toggle'. Add event code
Serial.println("!POBJ oImgBut.toggle=85.,29.,6.5,14.,dev\\toggle-sw\\gs_toggle_v_0.gif,0,dev\\toggle-sw\\gs_toggle_v_1.gif,0");
Serial.println("!POBJ toggle.C='Play click sound(;)");
Serial.println("~IWAV sw_toggle2.wav");
Serial.println(""); // Extra CR to signal end of event code.
Once you connect, it is created and ready to meter two channels of analog data, plus allow the switch (toggle) to be read by your controller.