When shown an early radio station, the viewer was heard to remark, “Why do they call it wireless? I’ve never seen so many wires in all my life!” The fact that “wireless” requires a lot of wires is undeniable to those of us who have ever built or maintained any kind of radio facility — from a simple CB base station to a full-power broadcast facility. Most of the “wires” you’ll find behind the equipment are more than simple strands, though. If they are conveying radio frequency (RF) signals from place to place, they are really transmission lines. In this article, we’ll talk about a basic element of transmission lines — the standing wave ratio, or SWR — and why it’s important and how to measure it.
Transmission Line Overview
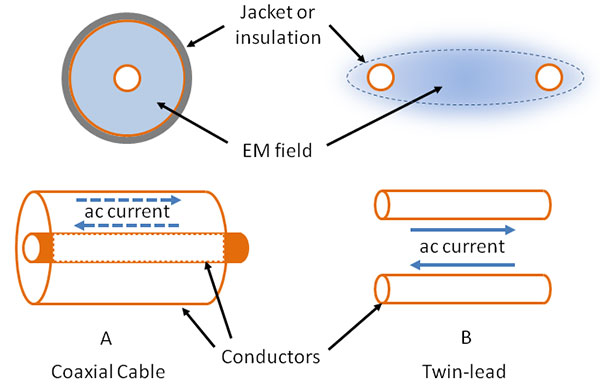
Any conductor carrying an AC current can be treated as a transmission line, such as those overhead giants distributing AC utility power across the landscape. Incorporating all the different forms of transmission lines would fall considerably outside the scope of this article, so we’ll limit the discussion to frequencies from about 1 MHz to 1 GHz, and to two common types of line: coaxial (or “coax”) and parallel-conductor (a.k.a., open-wire, window line, ladder line, or twin-lead as we’ll call it) as shown in Figure 1.
FIGURE 1. Coaxial cable (A) consists of a solid or stranded center conductor surrounded by an insulating plastic or air dielectric and a tubular shield that is either solid or woven wire braid. A plastic jacket surrounds the shield to protect the conductors. Twin-lead (B) consists of a pair of parallel solid or stranded wires. The wires are held in place by either molded plastic (window line, twin-lead) or by ceramic or plastic insulators (ladder line).
Current flows along the surface of the conductors (see the sidebar on “Skin Effect”) in opposite directions. Surprisingly, the RF energy flowing along the line doesn’t really flow in the conductors where the current is. It travels as an electromagnetic (EM) wave in the space between and around the conductors. Figure 1 indicates where the field is located in both coax and twin-lead. For coax, the field is completely contained within the dielectric between the center conductor and shield. For twin-lead, though, the field is strongest around and between the conductors but without a surrounding shield, some of the field extends into the space around the line.
This is why coax is so popular — it doesn’t allow the signals inside to interact with signals and conductors outside the line. Twin-lead, on the other hand, has to be kept well away (a few line widths is sufficient) from other feed lines and any kind of metal surface. Why use twin-lead? It generally has lower losses than coax, so is a better choice when signal loss is an important consideration.
Skin Effect
Above about 1 kHz, AC currents flow in an increasingly thin layer along the surface of conductors. This is the skin effect (https://en.wikipedia.org/wiki/Skin_effect). It occurs because eddy currents inside the conductor create magnetic fields that push current to the outer surface of the conductor. At 1 MHz in copper, most current is restricted to the conductor’s outer 0.1 mm, and by 1 GHz, current is squeezed into a layer just a few µm thick.
Characteristic Impedance
Both kinds of transmission lines are specified as having a characteristic impedance, represented by Z0. For example, popular RG-58 cable is designated to be a 50Ω cable, RG-6 is a 75Ω cable, and so on. If you measure the cable with an ohmmeter, you’ll just get a reading of a few ohms. What’s going on?
Z0 applies to how EM waves flow through the cable, and it depends on the size of the conductors, the relative placement of the conductors, and the type of dielectric between them. (Formulas for Z0 can be found online and in most RF engineering references.) Sometimes referred to as surge impedance, the characteristic impedance determines how the EM wave’s energy is allocated between the electric and magnetic field as it travels along the cable.
You can experience acoustic characteristic impedance for yourself with a common soft drink straw and a small diameter straw such as for mixed drinks. Blow a short puff of air through each and feel the resistance from the straw at the rising edge of the pulse. The larger straw allows more air to flow due to its lower impedance which you experience as back pressure resisting air flow. This analogy isn’t exact but illustrates the general idea. If a short pulse of voltage is applied to a high Z0 cable such as 300Ω twin-lead, the resulting current surge in the cable will be lower than for a low Z0 cable such as 50Ω coax.
Characteristic impedance is important because of how energy gets into and out of a transmission line. As an EM wave travels — in space, along a wire, in a transmission line — any change in Z0 causes some of the energy in the wave to be reflected in the opposite direction to the wave’s travel. The bigger the difference in Z0, the more energy is reflected. Whether the new Z0 is higher or lower determines the phase of the electric and magnetic fields of the reflected wave with respect to the forward wave.
Reading between the lines, so to speak, if an antenna or circuit or other load is attached to the line and has an impedance equal to Z0, all of the power traveling down the line will be transferred to whatever is attached. That’s exactly what you want if you’re transmitting a radio signal — for all of the transmitter’s output to be transferred to the antenna where it is radiated away into space. Similarly, you want Z0 to match in the receiving direction so that all of that extremely weak signal picked up by the antenna is transferred to the line and thus carried to the receiver. (Transmission lines connected to antennas are usually just called “feed lines.”)
Reflections on Standing Wave Ratio (SWR)
The condition in which the impedance of whatever is attached to the feed line equals Z0 of the line is called matched. If the impedances are not equal, that’s a mismatch. In most cases, Z0 is not exactly matched and so there are EM waves traveling up and down the cable, bouncing back and forth between the terminations at each end of the line. The device that applies power to the line is called the generator, and the device that takes power from the line is the load. Forward refers to the direction from the generator to the load, and reflected refers to the opposite direction.
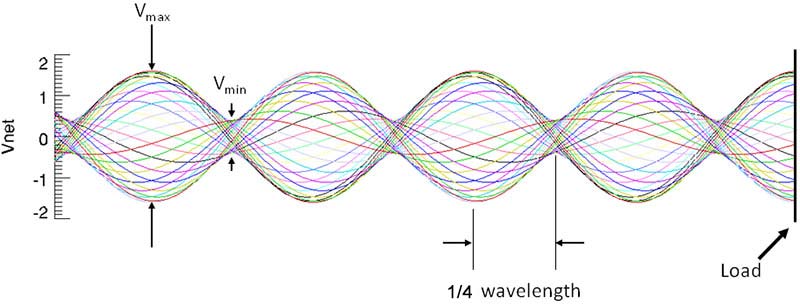
These waves set up an interference pattern that is stationary within the cable called standing waves. If all of the power is reflected at one end of the line, the pattern will include points at which the electric fields of the forward and reflected waves are out of phase and completely cancel — resulting in zero voltage. One-half wavelength away, the waves are in phase and add, thus doubling the voltage. Figure 2 shows a calculated example of standing waves in which the load impedance is four times higher than the line’s, reflecting a portion of the forward wave. You can see a neat flame-based visualization of standing pressure waves in this YouTube video (www.youtube.com/watch?v=6jfU74enV_w). Think pressure = voltage and you’ve got it!
FIGURE 2. Standing waves on a transmission line, with the resulting voltages (VNET) shown in different colors during one complete cycle of the applied voltage. The generated wave with an amplitude of 1 travels from left to right and is partially reflected by the load at right. SWR = VMAX / VMIN = 1.6 / 0.4 = 4.0. (Graphic created by Wikipedia contributor, Interferometrist and is used under the Creative Commons Attribution-Share Alike 4.0 International license.)
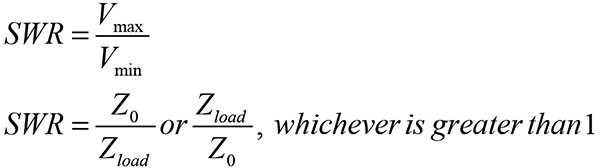
The ratio of the maximum and minimum voltages is the SWR. (If the SWR is calculated from the voltage, it is VSWR, and it can also be calculated from the standing waves of current as ISWR. The usual convention is to assume that references to SWR mean VSWR.) SWR is always equal to or greater than 1, and is written as a ratio such as 1:1 or 1.5:1 or 3:1, and so forth.
SWR can also be calculated as the ratio of the feed line Z0 and the load impedance — whichever is greater than 1. Since you already know the feed line’s Z0 and can measure the load’s impedance, this is a lot more convenient than trying to measure maximum and minimum voltage inside the line:
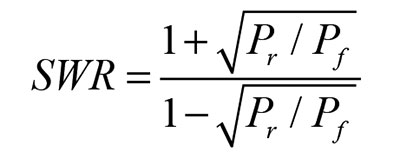
Another convenient way to measure SWR is by using forward power (Pf) traveling from the generator to the load and reflected power (Pr) traveling in the opposite direction:
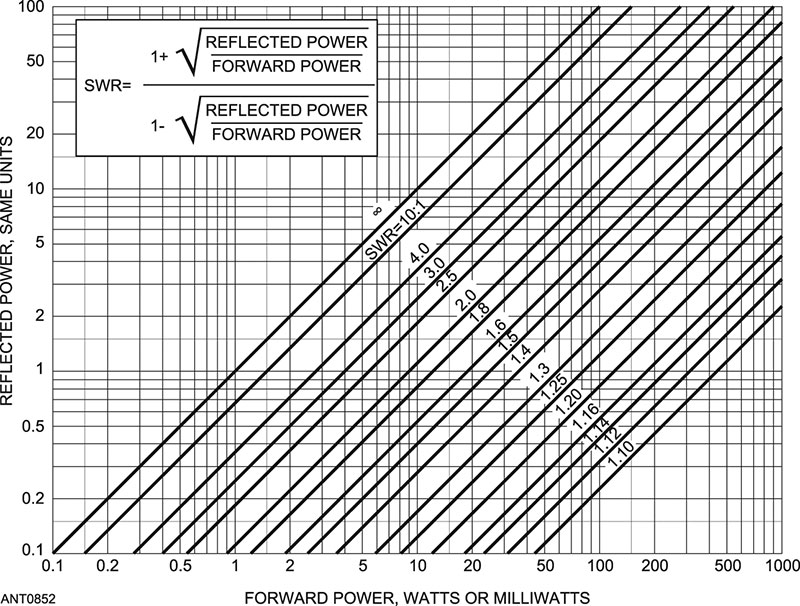
Figure 3 shows a chart that converts any combination of forward and reflected power into an SWR value.
FIGURE 3. SWR as a function of forward and reflected power. (Graphic courtesy of the American Radio Relay League.)
Similarities in Wave Behavior
This column only touches on how transmission lines actually work in order to discuss some of the common instruments you’ll find in the ham station for working with impedance mismatches. A much better presentation is available from the AT&T Tech Channel at http://www.youtube.com/watch?v=DovunOxlY1k. Called “Similarities in Wave Behavior,” the tutorial uses a clever mechanical simulator called the Shive Wave Machine to show just how waves move in transmission lines, including reflection and standing waves. Some simple demonstrations illustrate the idea of SWR and what it measures. If transmission lines seem confusing, watch this video as a great place to start learning.
Effects of SWR (Radio and Non-Radio)
Why do we care so much about SWR? A clue was provided earlier in explaining that if the characteristic impedance of a line does not match the impedance of whatever load it is attached to, some of the power applied to the line is reflected at the load. Since we would like all of our expensive transmitter output power to be put to work as a radiated signal, it would be good to minimize reflected power at the load. SWR is just a convenient way to measure the quality of the impedance match between our line and the load. The lower the SWR, the better the match!
Non-radio folks also care about SWR — especially with regard to high speed digital data. Data signals may “just” be voltage levels corresponding to 0 and 1, but it takes very high frequency components to make the sharp edges and narrow pulses our designs require.
A 100 Mbit/s data stream contains signal components in excess of 1 GHz! At those frequencies, every wire and PCB (printed circuit board) signal trace has to be treated as a type of parallel-conductor transmission line because it is.
If the Z0 of a PCB trace does not match the output impedance of whatever circuit is generating the signal or the input impedance of whatever is receiving the signal, severe ringing, overshoot, undershoot, or multiple false transitions and glitches can occur. Search for application notes on “signal integrity” for detailed information about what PCB designers must do to control the data paths at today’s signaling rates.
Video signals — particularly analog video — can suffer from impedance mismatches, resulting in ghost images and distorted pictures. The solution is to understand when transmission line considerations apply and terminate the signal traces in appropriately.
Measuring Impedance and SWR
To make accurate measurements at RF, instruments must be designed for that purpose. Low frequency multimeters simply can’t be used. Nevertheless, inexpensive versions are available that don’t cost a lot and still provide useful information. You just have to know where to shop!
SWR Meters
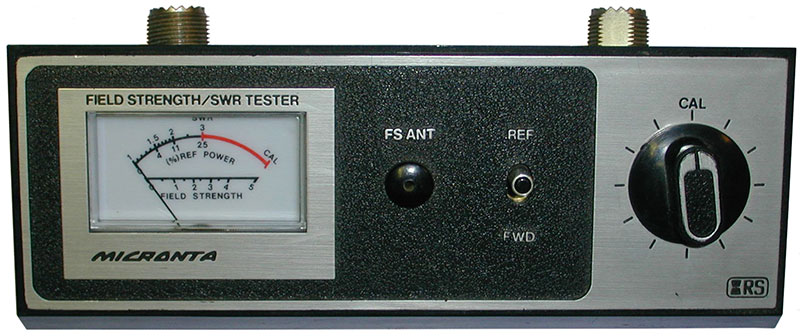
The most common transmission line instrument in a ham or CB station is the basic SWR meter shown in Figure 4A. The meter is used by setting the CAL control for a full-scale reading for forward power (FWD), then switching to the reflected (REF) position to read SWR. The meter sensitivity varies with frequency, requiring readjustment when using different bands; accuracy is low compared to a lab instrument. Available online and from CB shops for under $30, these meters give a good idea whether SWR is high or not, and are useful in monitoring output power while operating or when adjusting an antenna.
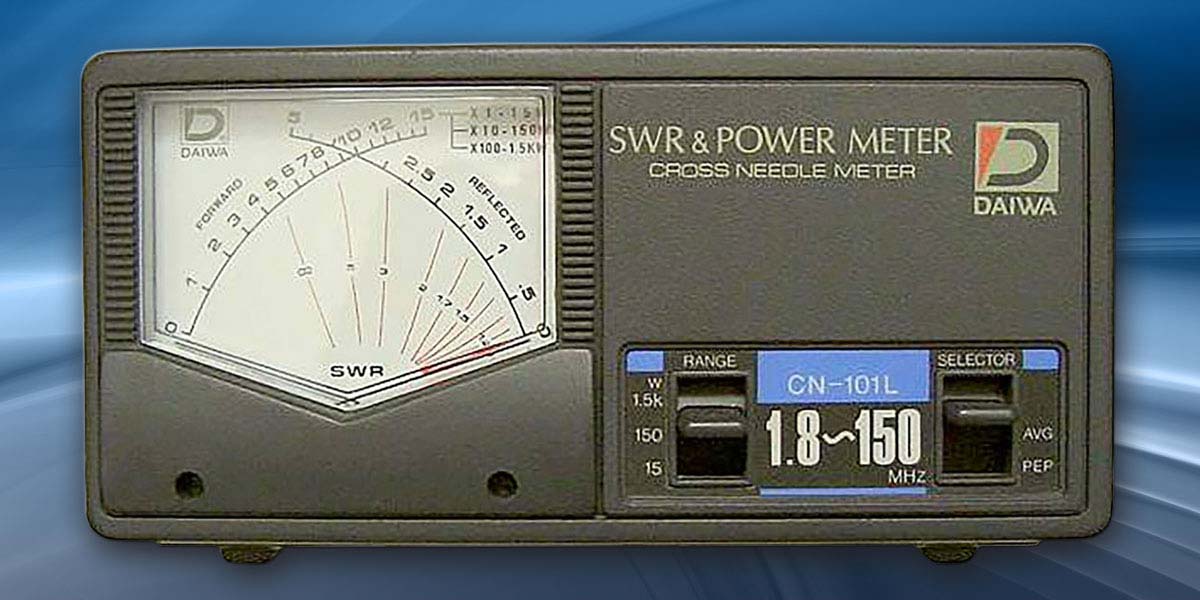
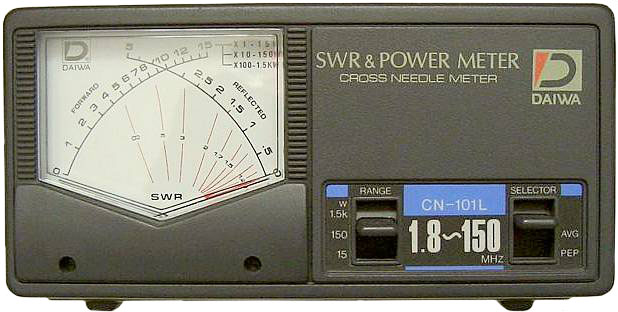
FIGURE 4. Inexpensive SWR meters (Top) are useful up to about 30 MHz at power levels up to 100 watts. The more expensive meter (Bottom) displays forward and reflected power simultaneously along with SWR on a crossed-needle display.
More advanced meters like the Daiwa CN-101 in Figure 4B provide simultaneous power and SWR measurements with a crossed-needle meter. The unit displays both forward and reflected power with independent meter movements. Curves on the meter face indicate SWR at the point where the needles cross. (The curves are the meter equivalent of the chart in Figure 3 or the equation for SWR in terms of forward and reflected power.)
Accuracy of this type of instrument — typically costing around $100 — is quite a bit better, no calibration adjustments are required over the specified frequency range, and the meters can handle the full amateur legal power of 1.5 kW in several ranges. Similar units are available for VHF and UHF operation.
These meters work by coupling a small amount of power from the main feed line into a diode detector circuit. One circuit senses forward power and another senses reflected power — each driving an analog meter. The meters and SWR values are calibrated based on typical diode characteristics, and accuracies of a few percent are about as good as can be expected.
This is not up to lab standards but good enough for day-to-day operation, and repeatable enough to compare antennas. Digital meters are also available which digitize the detector output signals and compute SWR for display as a numeric value.
Directional RF Wattmeters
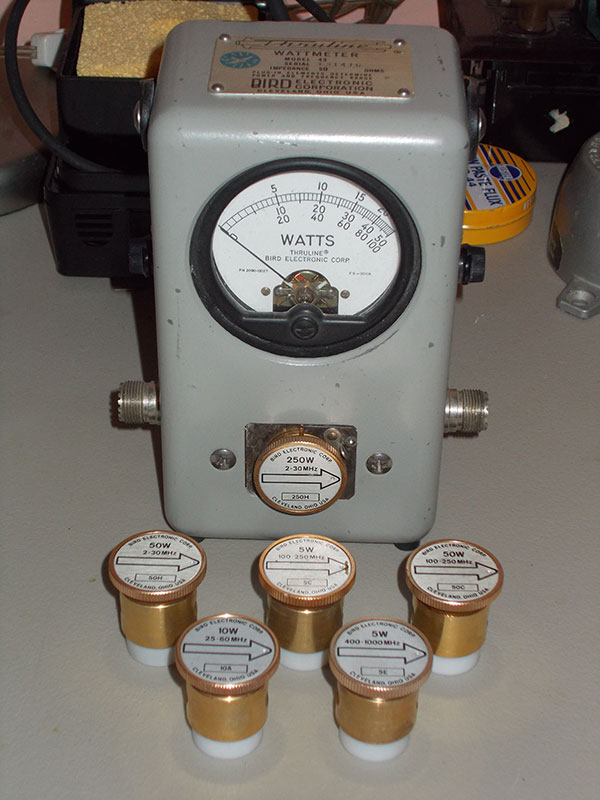
A step up in accuracy from the SWR meters, directional RF wattmeters — such as my Bird Model 43 shown in Figure 5 — measure forward and reflected power independently. A sensing element is inserted into the front of the meter and rotated according to the arrow to read power in the desired direction. The meter’s user can then convert the readings into SWR, if desired.
FIGURE 5. The author’s Bird Model 43 has been in use for a long time, but still provides reliable readings of forward and reverse power using a collection of elements that span 2 to 1,000 MHz.
Most hams and technicians only use SWR as an indication of whether excess reflected power is present, so an accurate display of reflected power serves the same purpose as an SWR value.
Sensing elements are calibrated for different power levels and frequency ranges. The list of Bird elements — also known as “slugs” — is available at www.birdrf.com via the Model 43 product sheet. Elements are available at frequencies from 2 to 1,000 MHz, and maximum power levels to 5,000W. Wide-range meters with digital displays are also available that perform the same functions automatically using a microprocessor.
Measuring Impedance Directly
Until relatively recently, making an accurate measurement of impedance at RF required some serious lab instrumentation. Impedance measurements vary with frequency, and can be upset by “stray” capacitance and even lead length of the measuring probe. Based on microprocessor technology developed for the mobile phone, manufacturers are now supplying impedance meters that provide excellent accuracy, record data for later analysis, and display the measurements in numerous formats.
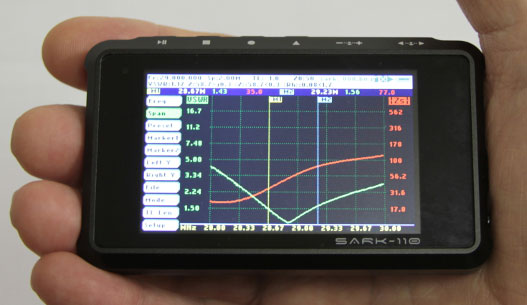
The simplest type is called a “one-port vector impedance meter” as shown in Figure 6. This handheld instrument is about the size of a smartphone, costs under $500, and has a color display that can show the data as impedance, SWR, or in other formats across several decades of frequency. The word “vector” signifies that the meter measures both magnitude and phase of the unknown impedance. These pocket-sized units are especially handy for field use.
FIGURE 6. The SARK-110 Antenna Analyzer is a miniature vector impedance meter that displays several types of measurements from 0.1 to 230 MHz. Data can be saved for future analysis on a PC, as well. (Photo courtesy of SteppIR.com.)
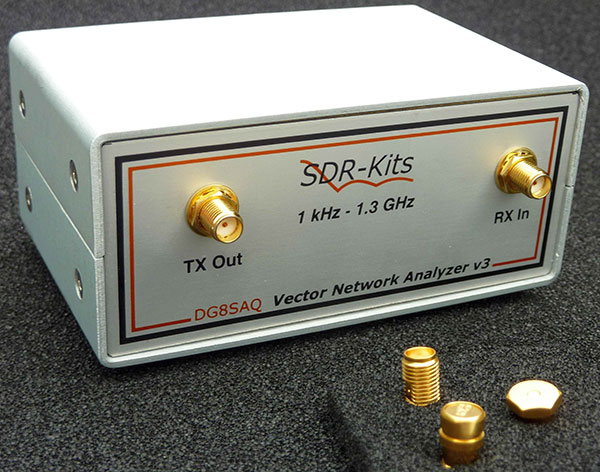
A more capable instrument is the two-port vector network analyzer, or VNA shown in Figure 7. Where the one-port model can only measure whatever is attached at the single connector, the VNA can generate a signal, pass it through a circuit or cable, and measure how it is amplified, attenuated, phase-shifted, etc. VNAs used to be found only in engineering and research facilities, and cost $10,000 or more. Now, you can buy units specified for use through 1 GHz for under $1,000. These units are designed to be used on the workbench with a host PC.
FIGURE 7. The DG8SAQ Vector Network Analyzer not only measures impedance through 1.2 GHz but also makes gain, loss, and phase measurements of circuits and transmission lines. A laptop or other host PC is required to process the measurements taken by the unit shown in the photo. (Photo courtesy of SDRKits.com.)
Once you have the ability to measure impedance and power in a transmission line, many powerful techniques are available to turn the data into an understanding of what’s going on “in there.” In turn, this allows you to design and troubleshoot your antenna or data transmission system. Transmission lines become a lot easier to work with once you have the ability to make the right measurements!
Correcting for SWR
Finally, what can you do about SWR if you have too much of it? That’s a loaded question since how much is too much depends on the application. Nevertheless, in the next column we’ll take a look at techniques used by hams to reduce SWR by transforming and matching impedances across a wide range of frequencies. NV
Great Lengths on Lines
Transmission lines are one of the most written-about topics in all of ham radio. More than just ways of carrying RF energy from place to place, they can act as filters and impedance transformers, too. Who knew that a simple "wire" could do all these tricks? You can learn a lot more about them via the ARRL's Technical Information Service's web page at www.arrl.org/transmission-lines.