An important MakerPlot function is its bi-directional capabilities. What this means is that your micro can control and be controlled by MakerPlot. As we've mentioned before, you should think of MakerPlot as a front panel GUI for your micro because you can create meters, LEDs, and switches that can monitor and control your micro's operation just like a physical front panel can, along with plot areas for your analog and digital data.
In this two-part feature of our series, we’re going to introduce you to how MakerPlot accomplishes bi-directional monitoring and control by first adding two physical pushbuttons and an LED, in addition to the 10K pot to our Arduino Uno hardware. Then, we’ll go on to show you how to change the setpoint with these two switches, and also how to code the sketch to establish the setpoint and make things happen. After that, we’ll show you how MakerPlot can operate with the Arduino for data acquisition and control of the setpoint function.
To get a handle on things, this article begins with uni-directional or one-way control of MakerPlot using an the Uno. So, instead of you clicking buttons and switches on the MakerPlot Interface to change things, we’re going to show you how to do it with MakerPlot instructions that are embedded in the Arduino sketch and sent to MakerPlot using the same serial connection that outputs the analog and digital data. (If you haven’t already done so, download a free 30 day trial copy of MakerPlot from www.makerplot.com to follow along.) Let’s get going.
Expanded Arduino Uno Setup
To begin our setpoint example, we’ve added two physical pushbutton switches and an LED to the Arduino Uno so that we can change the setpoint value for the pot using them (Figure 1).
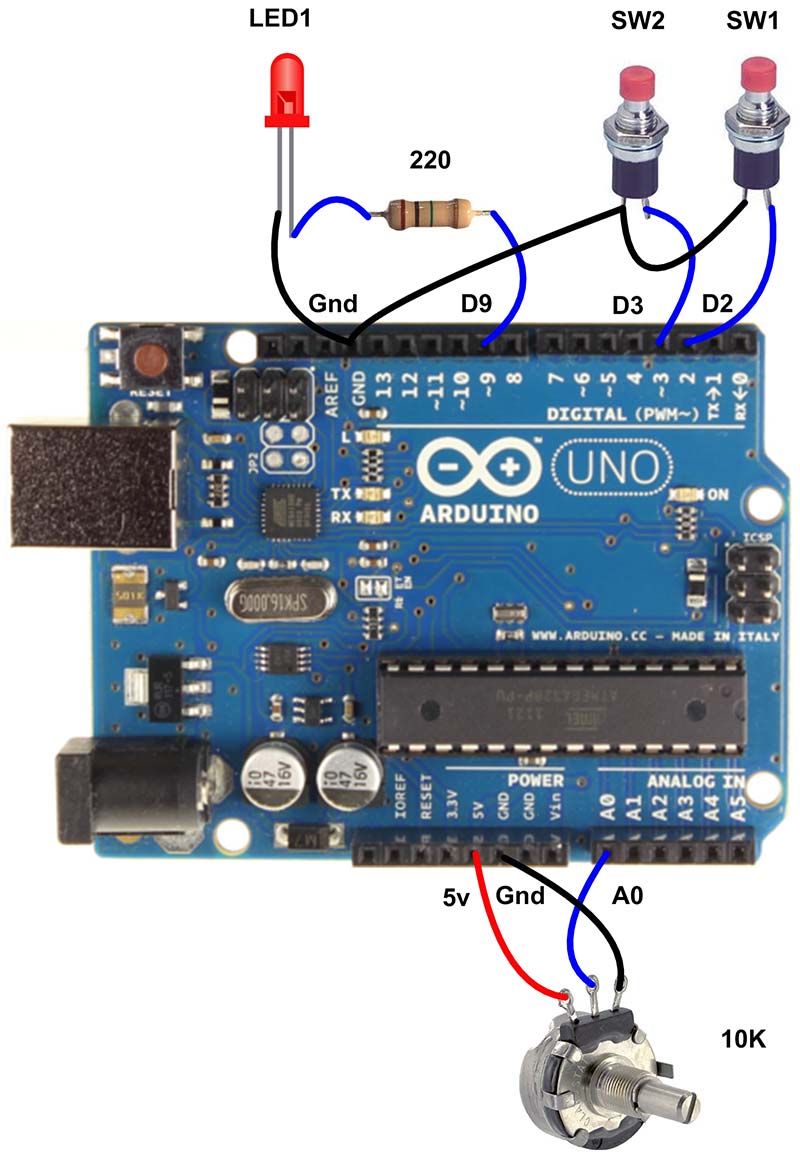
Figure 1. Arduino Uno setpoint hardware.
Switch SW1 controls incrementing the setpoint and SW2 controls decrementing it. The LED is only there to show you when the potentiometer analog value goes above or below the setpoint without having to look at the MakerPlot display.
Figure 2 illustrates the data flow from the Arduino into MakerPlot. Right now, it’s only in one direction (micro to MakerPlot), but that’s just to get things started. Now, let’s look at the code.
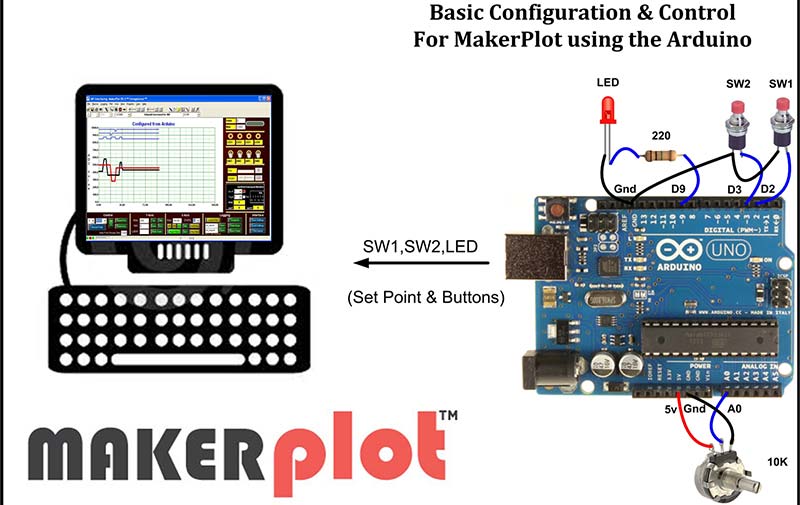
Figure 2. Arduino to MakerPlot data flow.
Setpoint Code
Figure 3 is the sketch that defines how to get the added switch inputs into MakerPlot. You can find this at www.makerplot.com; go to More→ Arduino Sketches → Arduino Setpoint Example. Load it onto your Arduino to follow along.
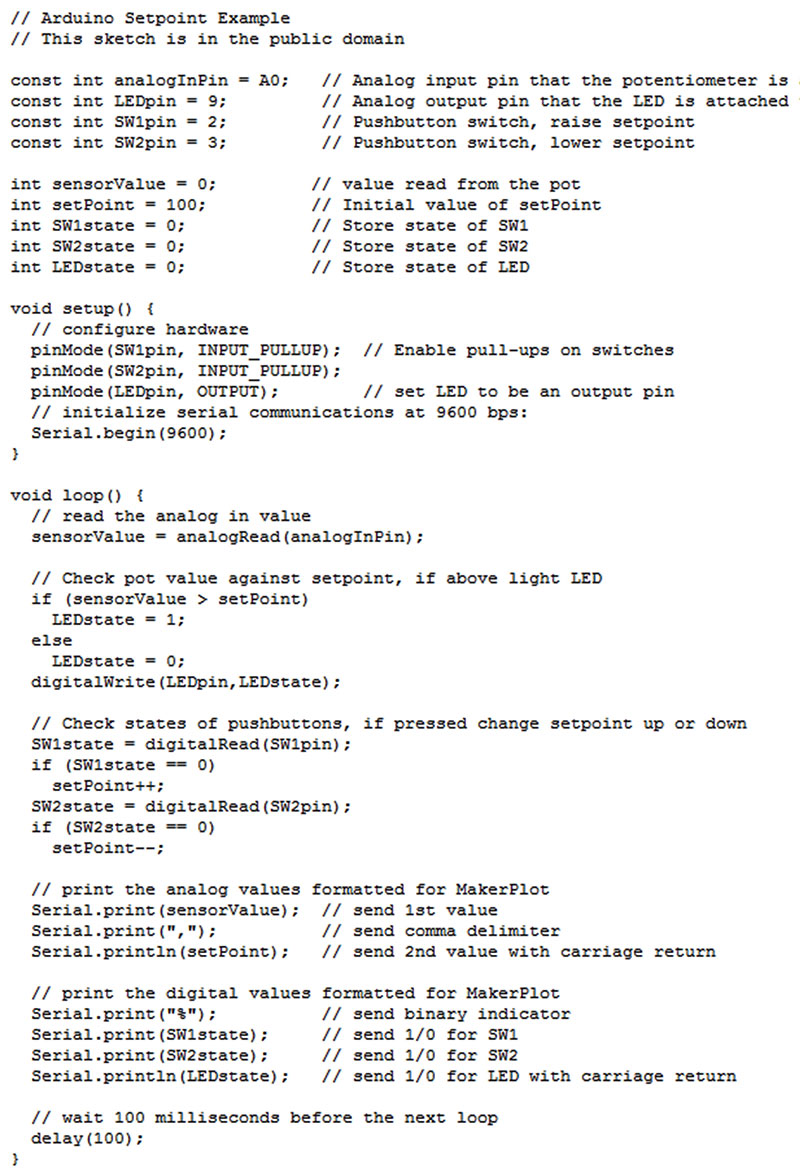
Figure 3. Arduino setpoint sketch.
We’ve added constants to establish where the 10K pot is attached, as well as the new switches and LED on the Uno: SW1 is on pin 2; SW2 is on pin 3; and the LED is on pin 9, with the center tap of the pot attached to analog input A0.
The setup part of the sketch simply enables the internal pull-ups for SW1 and SW2, and defines the LED as an output.
The loop part of the sketch is equally straightforward. In effect, if SW1 is depressed (logic 0), the setpoint is increased; if SW2 is depressed, it’s decreased. Also, if our pot level — the raw 0 to 1023 analog-to-digital (A2D) value — is above the setpoint, the LED on the Uno will illuminate; below it, it will extinguish.
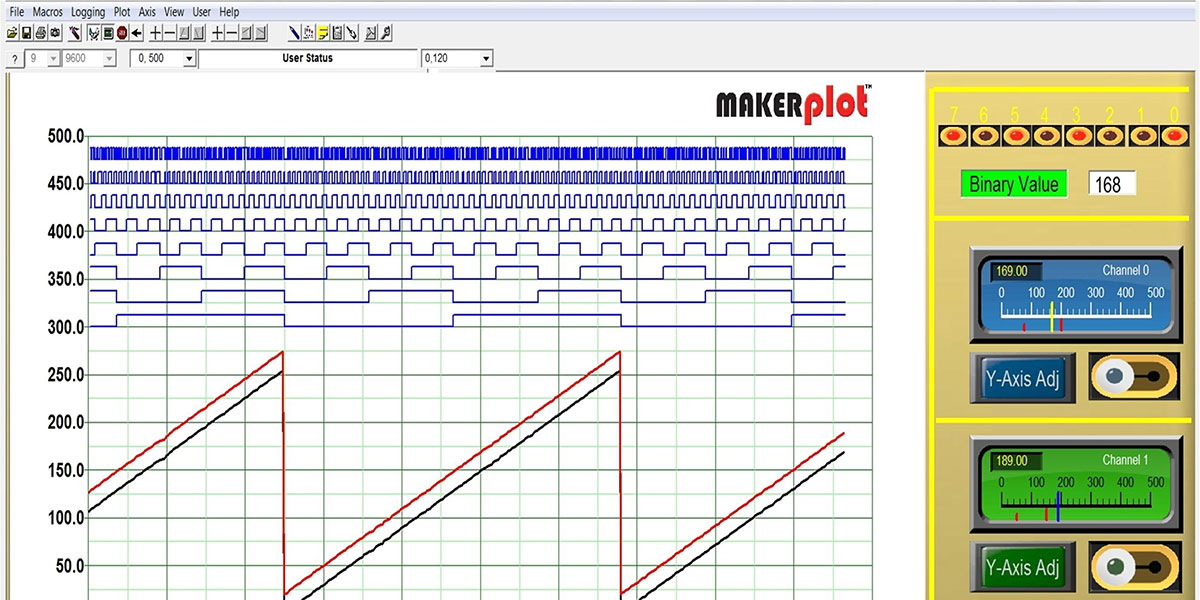
Also, the last part of the loop code sends the setpoint and pot information to MakerPlot where the digital setpoint, SW1, and SW2 digital values are plotted on the top (Figure 4), along with the analog potentiometer (black) and setpoint (red) levels on the bottom.
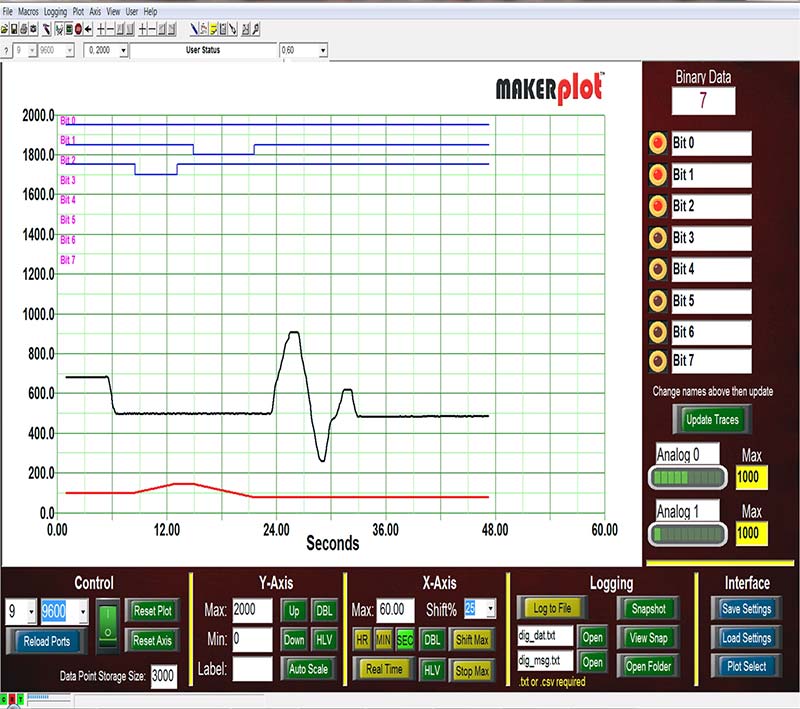
Figure 4. Unmodified MakerPlot interface.
Setting up MakerPlot for Remote Control
We’re using the same Digital Monitoring Interface as in the previous article as it has LEDs on the right for the digital setpoint SW1 and SW2 switches, as well as two analog bar graphs for both the potentiometer (Analog 0) and setpoint (Analog 1) values.
To make things clearer (Figure 5), we’ve changed the top three digital LED designations from Bit 0, Bit 1, and Bit 2 to Setpoint, SW2 - Decrease, and SW1 - Increase to better reflect the digital setpoint, SW1, and SW2 pushbutton switches.
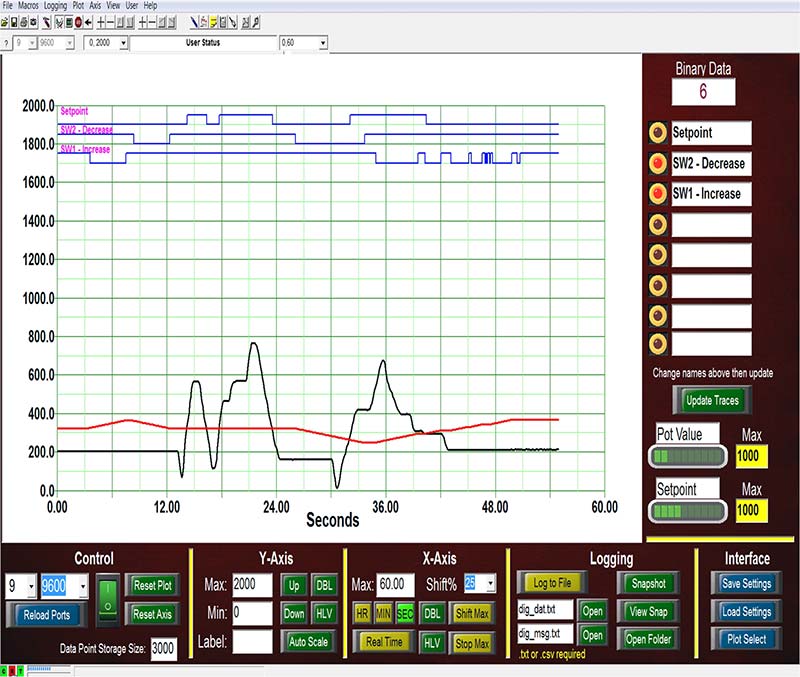
Figure 5. Customized interface for setpoint example.
To do this, just key the new names into the text boxes and click the Update Traces button below. We also blanked out the Bit 3 to Bit 7 designations since they’re not used in this example. Figure 5 also shows how the two analog bar graphs were renamed to represent the Pot Value (top bar graph) and Setpoint (bottom bar graph). This is easily done in MakerPlot by simply putting your cursor in the text box and keying in the new name for the control.
MakerPlot as a Front Panel
In this simple setpoint example, we want to demonstrate how MakerPlot can become a GUI front panel for your micro’s data and control functions like the two physical switches and LED on the Uno. According to the sketch code, we’ve established the setpoint at an arbitrary value of 100, so that’s what we’ll adjust first. This is the line of code that does it:
int setPoint = 100; // Initial value of setPoint
For example, in Figure 6 when SW1 is pushed, you’ll see the digital trace go from high to low (negative logic) and the SW1 LED extinguish. You can also see the analog setpoint (the red line) move up.
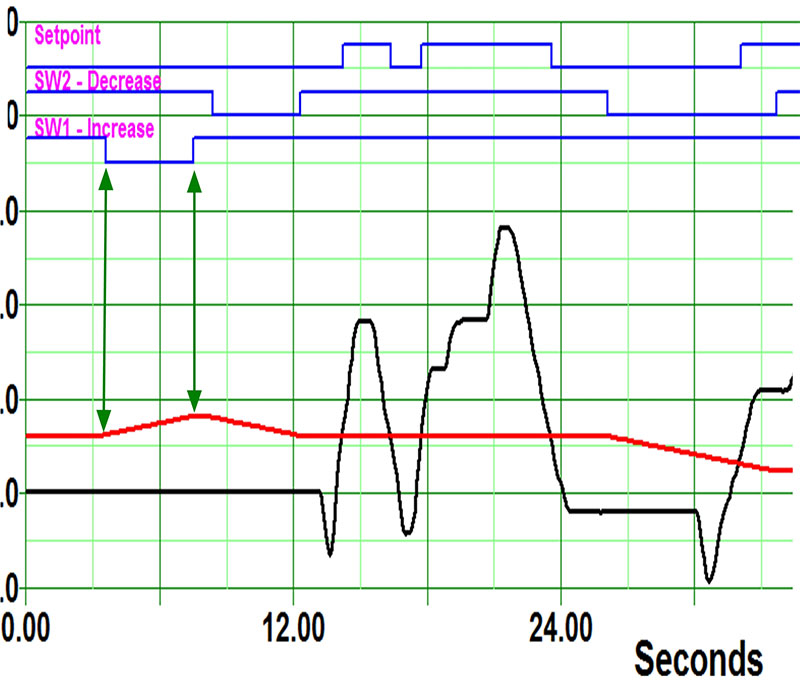
Figure 6. Depress SW1 to increase setpoint.
Going the other way, in Figure 7 when SW2 is pushed to decrease the setpoint, the digital trace goes from high to low and the SW2 LED extinguishes — again, negative logic — plus the red setpoint trace decreases along with the Setpoint bar graph.
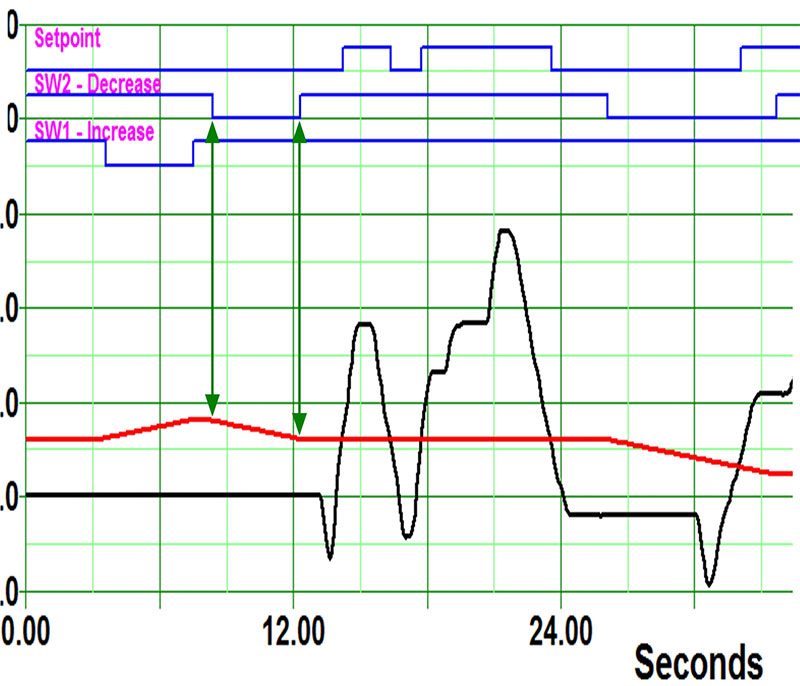
Figure 7. Depress SW2 to decrease setpoint.
When the setpoint is stationary, Figure 8 illustrates how adjusting the potentiometer value (black trace) back and forth through the setpoint (red trace) causes the digital setpoint line to change from high to low and back again, along with the setpoint LED on the Uno, flashing as the setpoint is crossed. Even though you can’t see this, you can imagine what happens.
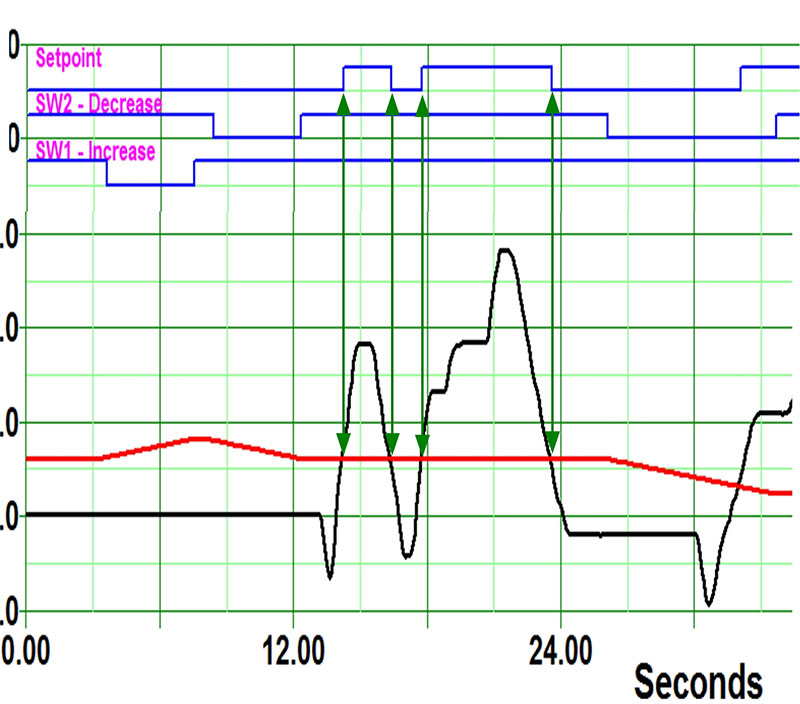
Figure 8. Transitions through setpoint.
To see a “live” demonstration of this setpoint example, go to www.makerplot.com → More → Videos → Learn and find the Arduino Setpoint Example link. In this short video, everything we’ve just covered is explained in much greater detail, and you can actually see what takes place.
Controlling MakerPlot From the Micro
We’re going to expand the setpoint example a bit. We can keep the same physical Arduino hardware setup with the 10K potentiometer, pushbutton switches, and LED, but we’ll need to add a few more lines to our sketch in order to make it add remote control to MakerPlot. For further reference, Figure 9 illustrates the data flow for our modified sketch.
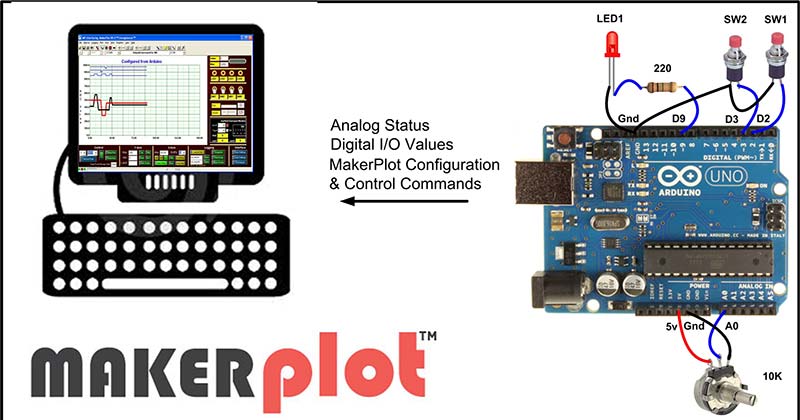
Figure 9. Expanded Arduino to MakerPlot data flow.
In order to establish “hands off” control of the MakerPlot Interface, the micro will send commands (instructions) as well as data to MakerPlot via the same serial link. Up until now, we’ve shown you how to send only analog and digital data; now, let’s make the leap to controlling MakerPlot directly with your micro by also sending instructions to it. Figure 10 is our modified sketch that does this.
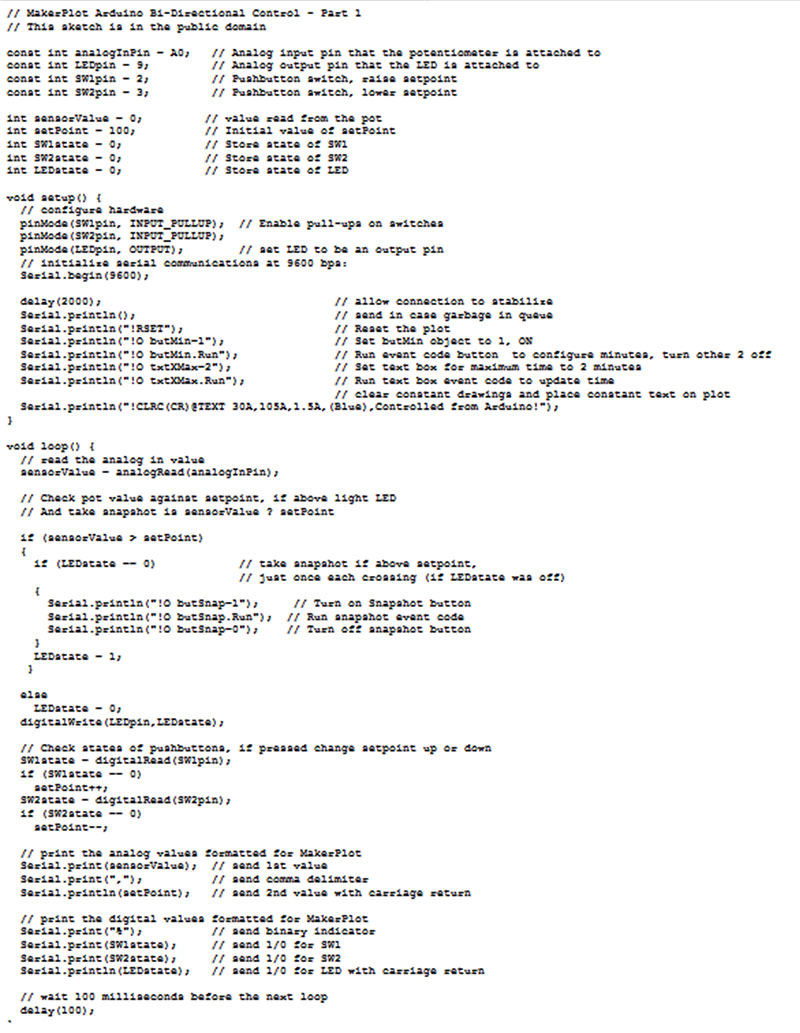
Figure 10. MakerPlot Arduino bi-directional control sketch.
You can find it at www.makerplot.com; go to More→ Arduino Sketches → MakerPlot Arduino Bi-Directional Control – Part 1. Load it into your Arduino if you’re following along.
A typical MakerPlot command or instruction starts with an exclamation point (!). Look at the excerpted code in Figure 11; the first instruction is a MakerPlot reset instruction (!RSET) which clears the Interface of all plots and sets it to the default condition.
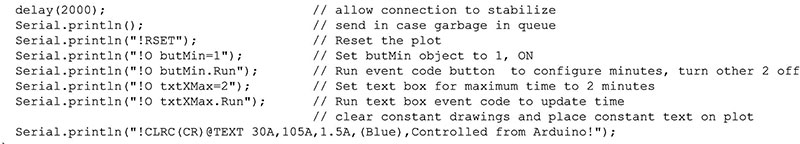
Figure 11. MakerPlot instruction examples.
Like serial data, the reset command is proceeded by the Arduino’s Serial.println instruction. Then, the instruction is encased in quotes (“ “) to make it ASCII, which is then followed by a carriage return. The Serial.println instruction handles sending the carriage return.
Another common MakerPlot designator is the capital letter O’ This is an abbreviation of the POBJ — or Plot Object — MakerPlot command. The next four instructions use the !O prefix to tell MakerPlot to switch from seconds to minutes on the X axis (time), and to set the time range to two minutes. The final instruction in this group sends the text “Controlled from Arduino” to the Interface.
When the sketch is loaded and run, the result looks like Figure 12. We’ve switched to the Interactive Interface, since we’re going to use the Slider control on the right side for the rest of this example.
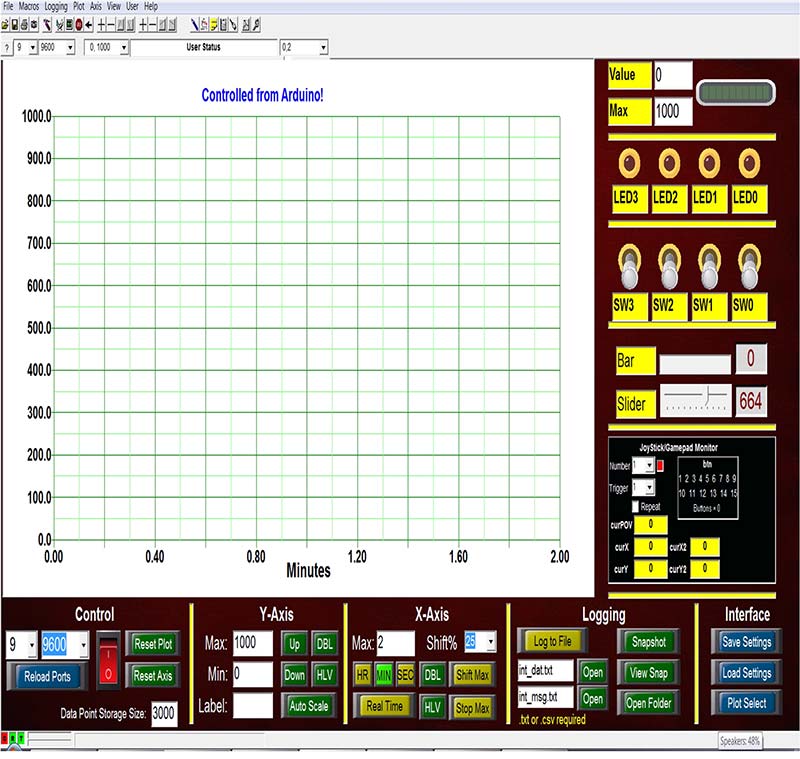
Figure 12. Interactive interface for setpoint example.
What Just Happened?
It’s important to understand what just happened in these few lines of code. Look at the bottom menu buttons in Figure 12 for reference. Rather than manually clicking on the Reset Plot button to clear the screen, then clicking on the MIN button to switch from seconds to minutes on the time scale — followed by setting the time duration to two minutes with clicks to the DBL or HLV buttons — we did all this using these first five serial commands to MakerPlot from the Arduino (Figure 11).
Okay ... now let’s look at what else our remote control sketch does. In the first part of the loop (Figure 13), it reads the potentiometer value then goes on to test it against the current setpoint.
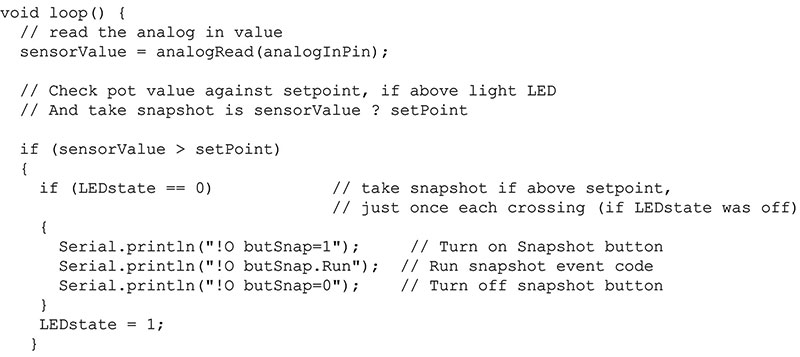
Figure 13. MakerPlot snapshot instructions.
If the potentiometer value exceeds the setpoint, the code instructs MakerPlot to “snap an image” of the Interface screen. This is handled with these three lines of code:
Serial.println("!O butSnap=1"); // Turn on Snapshot button
Serial.println("!O butSnap.Run"); // Run snapshot event code
Serial.println("!O butSnap=0"); // Turn off snapshot button
Notice the !O prefixes that precede the butSnap instructions. This three-line sequence is equivalent to manually clicking on the Snapshot button in the menu section. The result is an image of when the potentiometer value crossed the setpoint line, and Figure 14 shows it.
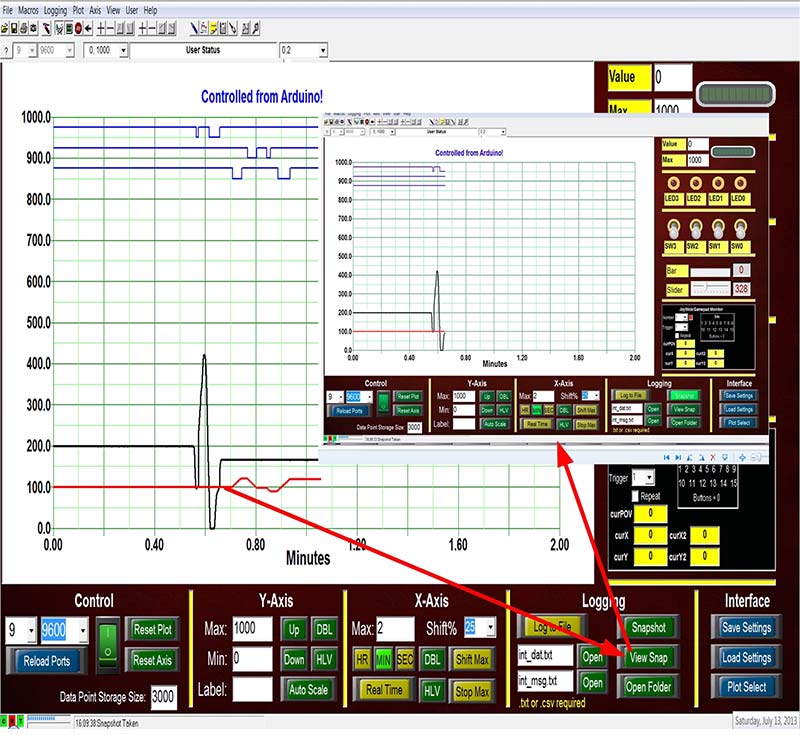
Figure 14. Snapshot jpg image of setpoint crossing.
To view it, click the View Snap button in the Logging menu. The jpg image looks just like the “live” Interface, so it’s easy to confuse it from the real thing. You can use these jpg images as a visual record of your experiments or process control activities. If you’re a student (or teacher), these same images can be incorporated into lab reports.
Winding Up for Now
The reset of the loop code (Figure 10, again) simply outputs the setpoint, SW1, SW2, and potentiometer data values to MakerPlot. What we want to do next is add more code to the sketch so that we can use the Slider control on the Interactive Interface to adjust the analog setpoint value. This will be the beginning of real bi-directional control (MakerPlot → micro). We’ll do that in the next article. In the meantime, you can view the video of this article at www.makerplot.com → More → Videos → Arduino Setpoint Example with GUI Control. The video will give you a better idea of how everything works.
Conclusion
In this first of a two-part feature on bi-directional data acquisition and control, we showed you how your code can affect one-way control of MakerPlot by outputting commands from the microcontroller instead of clicking on buttons and switches on the Interface screen.
We also introduced you to some basic MakerPlot instructions. These are the same instructions that are used to create the controls (buttons, switches, meters, etc.) on the Interface screen. What’s interesting to note is that these same instructions can come directly from your micro, so it’s entirely possible to completely build an Interface directly from your micro. We’ll get into that in a subsequent article.
In the meantime, remember that MakerPlot is available as a free download. If you like what you see and what it does, you can order it through the NV Webstore at a discounted price.
That’s all for now, so just remember: Got Data – MakerPlot It! NV