The Solar Revolution is here whether we like it or not. I came to this realization last year when it became apparent how many solar companies were going out of their way to annoy me by calling night and day. Even hanging up on them did not always work. They are still calling to this day ... they are a persistent bunch. If you go into a big box home improvement store, it is likely you will be met (accosted?) by them at the entrance.
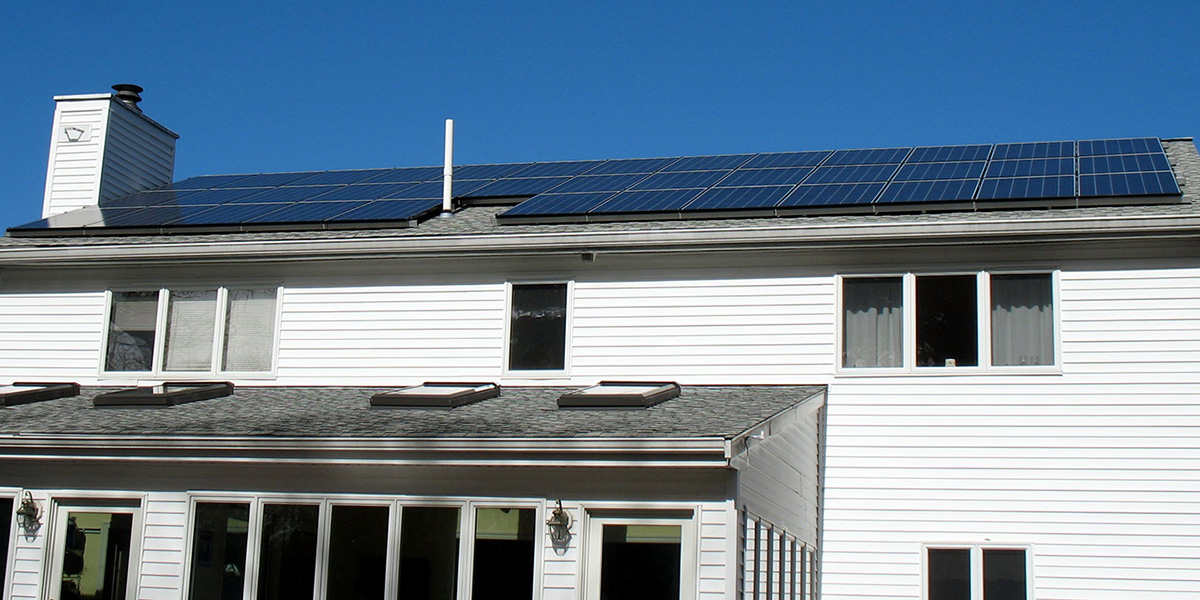
Ultimately, I was pulled into the fray, but not because of any altruistic desire to go green. I wanted to stop being at the mercy of my electric utility and get some “free” energy by becoming my own electric power plant. This story started during the winter of 2014-2015 and ended with a solar array on my roof (see the finished view of the solar array in Figure 1 lead photo above) and ancillary equipment in my basement.
The Beginning — Anger Management
Anger is a good motivator for some people. I am one of them. I had been trying to reduce my electricity consumption during 2014. Despite my efforts to reduce air conditioning, heating, and lighting loads, my electric bill started rising dramatically at the end of 2014 and into 2015 — sometimes exceeding $250. I had even switched to a different power generation company, which is allowed in Massachusetts. However, the reduced rate was on the “generation” part of the bill only. After the power transmission charges, distribution charges, and taxes were added, there was not much change in the bill. I decided to measure and quantify my consumption.
During the next several weeks, I graphed all the historical data I could grab to determine what I was paying per KWH (including all generation, transmission, distribution, taxes, etc.). Figure 2 shows the results.
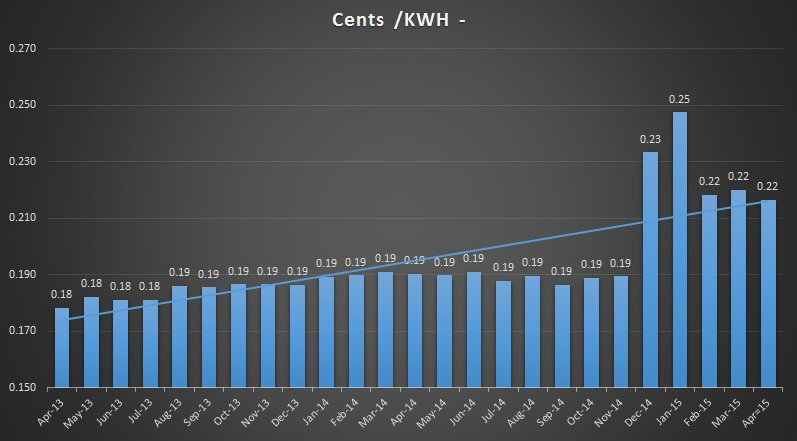
FIGURE 2. My historical electric rates.
Although the rates had been somewhat stable prior to December 2014, they began a steep increase after that, peaking at 0.25 per KWH. Since then, the rates have come back down, but not to where they were before. I wasn’t sure if they would spike again, despite lower oil prices. (Massachusetts generates most of its electricity from natural gas, coal, and nuclear.)
Decision Time
Before I made a decision, I had to learn about net metering (see sidebar). I investigated the topic and everything still looked like a go. It was now time to make a decision, but I knew it was not going to be easy to determine if solar would be cost-effective. There are a lot of companies today with many offerings and options.
The first issue I had was which company to choose. I decided to initially limit my investigation to the top three solar companies in the US who served my area. There were some solar companies who made contact with me who only served southeastern New England while other companies only consisted of five employees. I reasoned that if solar credits and incentives go away (always a possibility) or there is an economic downturn in the industry, the largest and most established businesses would be likely to weather it.
However, even that is no guarantee, and some large companies have recently been in the red. Federal and State tax credits are constantly expiring and changing, but are usually extended. I started with Solar City, Sunrun, and Sungevity as the three I would focus on.
Let the Games Begin
I contacted all three companies, and in short order I had several conversations with each of them. I asked a lot of questions (see Questions to Ask a Solar Installer) and got references from neighbors that had installations from each company. While I was speaking to my neighbors, the companies analyzed a recent electric bill I had sent them. They then used Google Earth to look at my house to come up with a preliminary proposal. They studied the orientation (I was 20 degrees off true south) and size of my roof, shadowing from trees and structures, and obstacles on the roof such as chimneys, vents, and antennas that needed to be avoided.
My roof was about 7-8 years old. Obviously, if a roof needs repair, the time to do it is before an array is installed. The array will actually lengthen the life of the part of the roof that it covers since degradation from sunlight and snow will be minimized. After a comparison of their proposals (which were all similar), it came down to price and contract terms. After some more negotiations, I chose Sunrun.
Contract Terms
Before the engineering could continue, I had to sign a contract. The big issue was whether to buy vs. lease. Buying the system seemed attractive to me at first. Two of my co-workers (who chose different companies) decided that buying was best for them. The more I investigated, the more I was not sure it was right for me (see Resources). Here are the pros and cons for buying a typical system:
Pros:
- No payment to the solar company on a monthly basis.
Usually maximizes financial benefit; payback is usually 7-10 years (be sure to consider array maintenance, inverter replacement, warranty extensions, and any increased homeowner insurance costs).
- You own the system; if you move, the sale price of the house includes the system.
- You own all the credits and incentives (Federal and State), and take them each year or when available. This could reduce the initial cost of the system by 50% or more. See the sidebar on solar tax credits.
Cons:
- Large amount of money up front, either cash or financing.
- If government credits get reduced, credits may not be sufficient to recoup expenses as quickly.
- Maintenance is homeowner’s responsibility (or may be $500 a visit quoted by one company).
- Property insurance on the solar array is homeowner’s responsibility (some policies may cover it, unless it is considered “wearout”).
- May/may not have an adequate performance guarantee.
- Depending on the state and locale, increased property taxes could result (usually not likely).
See the Resources section for a payback calculator. In the end, I decided on a fixed cost lease agreement. Listed below are the terms in my contract, but yours could vary widely depending on the many variables mentioned above:
- I will pay a fixed $85/ month for 20 years based on the system design (maximum rated power of 9,880 watts). This is regardless of the power produced each month. Many leases include an escalation charge of 1-7% /yr. I agreed to a slightly higher monthly payment for a fixed payment for 20 years.
- All maintenance and warranty costs for the system are the responsibility of the company.
- No deposit or upfront costs.
- Performance is guaranteed at approximately 10,000 KWH/year. If less is produced, I will get a check for the difference at the end of each year (less a slight degradation factor for the solar panels over time).
- All credits and incentives go to the company.
- The system is insured by the company, except for a baseball hitting the panels. (Whose idea was that?)
- No property tax assessment (in MA); even if the law changes, I don’t own the system.
- The system has an option to purchase after five years based on a sliding scale.
- Selling of the home; system must be paid off or the contract must be transferred to new owners.
These are the basics of the contract. In any event, it must be read thoroughly. I have included a list of questions to ask at the end of the article. Don’t be shy here. If something is not clear, ask the question.
Engineering the Sun
Next, a site visit was planned to look at roof pitch, structural soundness, and composition (asphalt shingles). After the site visit, I was sent another preliminary design with more detail that is shown in Figure 3 and Figure 4.
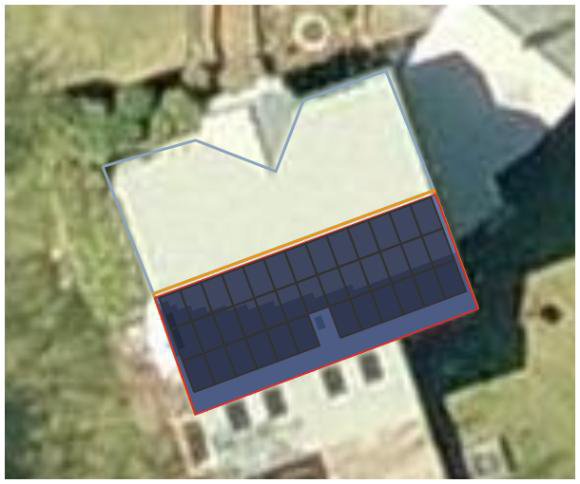
FIGURE 3. Google Earth view of the proposed array.
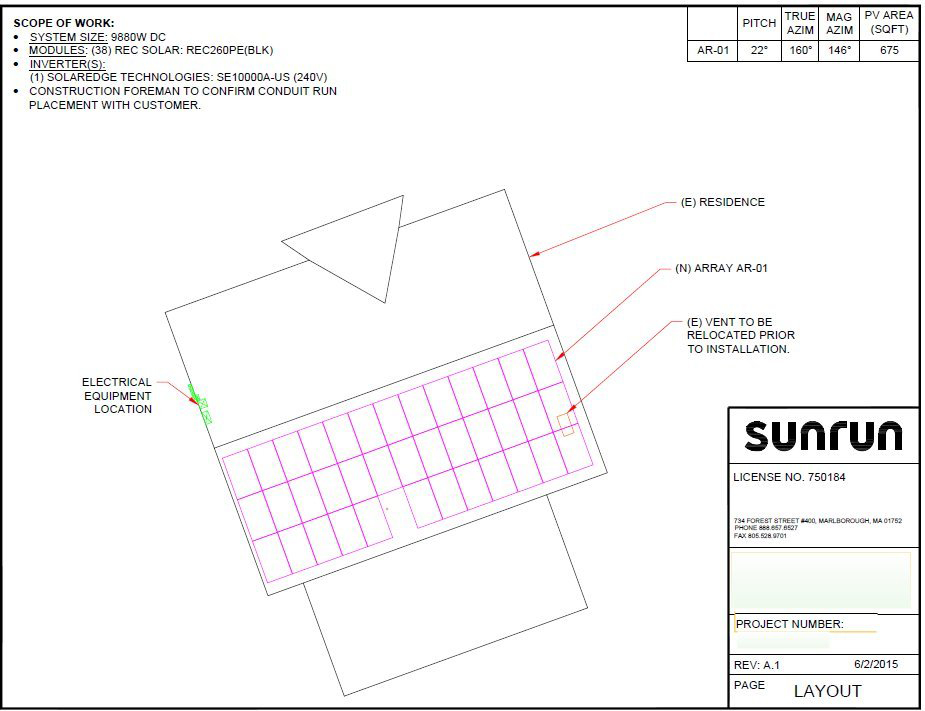
FIGURE 4. Engineering spec drawing of the array.
The design had to be revised because a satellite dish on the roof was no longer used and two more panels could be added. In addition, the company had added a few panels to the front roof visible from the street which my spouse did not appreciate.
After some analysis, it was determined they only added 4% to the total energy output, so they were deleted. (I later wondered if the extra panels would have put me over the 10KW maximum to permit net metering in my state.) All the panels would be on the back of the house. Since the house is a two-story colonial, they would be not seen from the deck; just in the back yard some distance from the house.
It should be noted that I had to approve the final design, even though I had already signed the contract. If the numbers in the proposal changed because of the site visit or I did not approve the final design, the deal was off. A project planner was assigned to us. He was my point of contact for technical issues, including the status of permits, inspections, and approvals. I approved the final design.
The array consisted of 38 panels (REC260PE) with a nominal power output of 260 watts and 16% efficiency. The total array had a power output of 9,880 watts nominal. The panels have a 10 year product failure warranty, but the lease agreement guarantees a 20 year replacement life. They are wired in a series/parallel arrangement, and the DC voltage is fed through conduit down the side of my house (see Figure 5). You can barely see the conduit from the ground. It is tucked in the chimney chase corner.
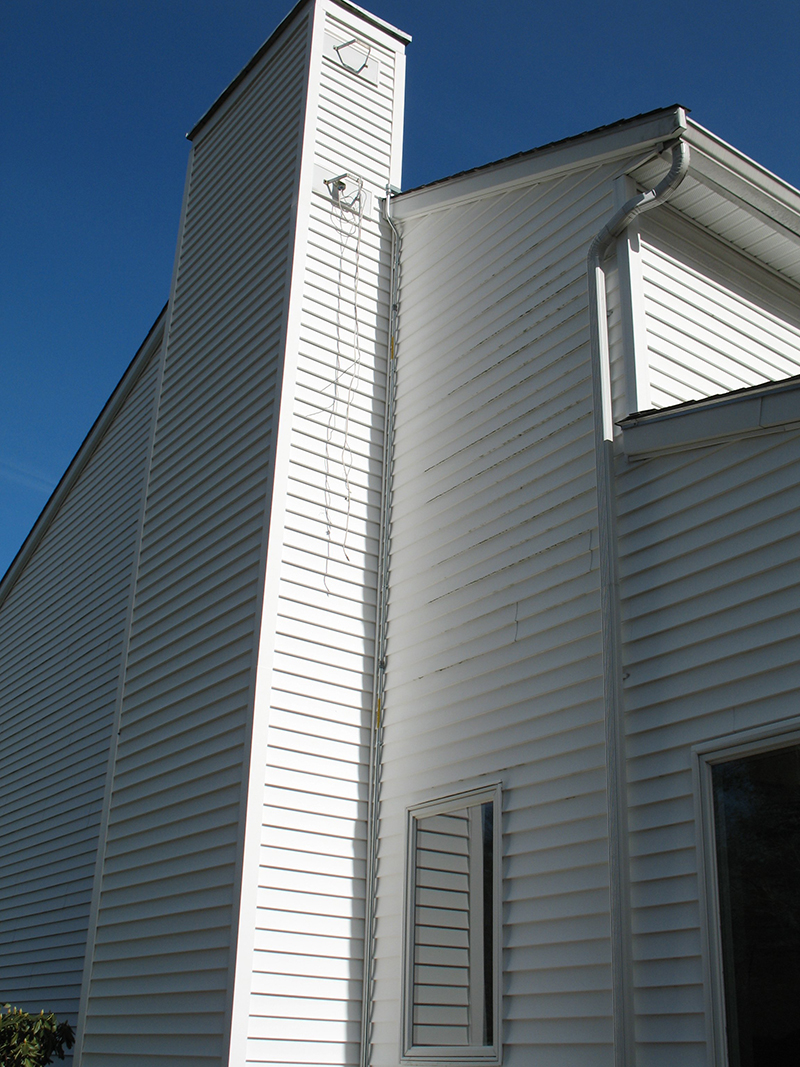
FIGURE 5. Location of feed from the roof.
A close-up is shown in Figure 6 where the feed comes down from the roof next to an old antenna bracket and old wires.
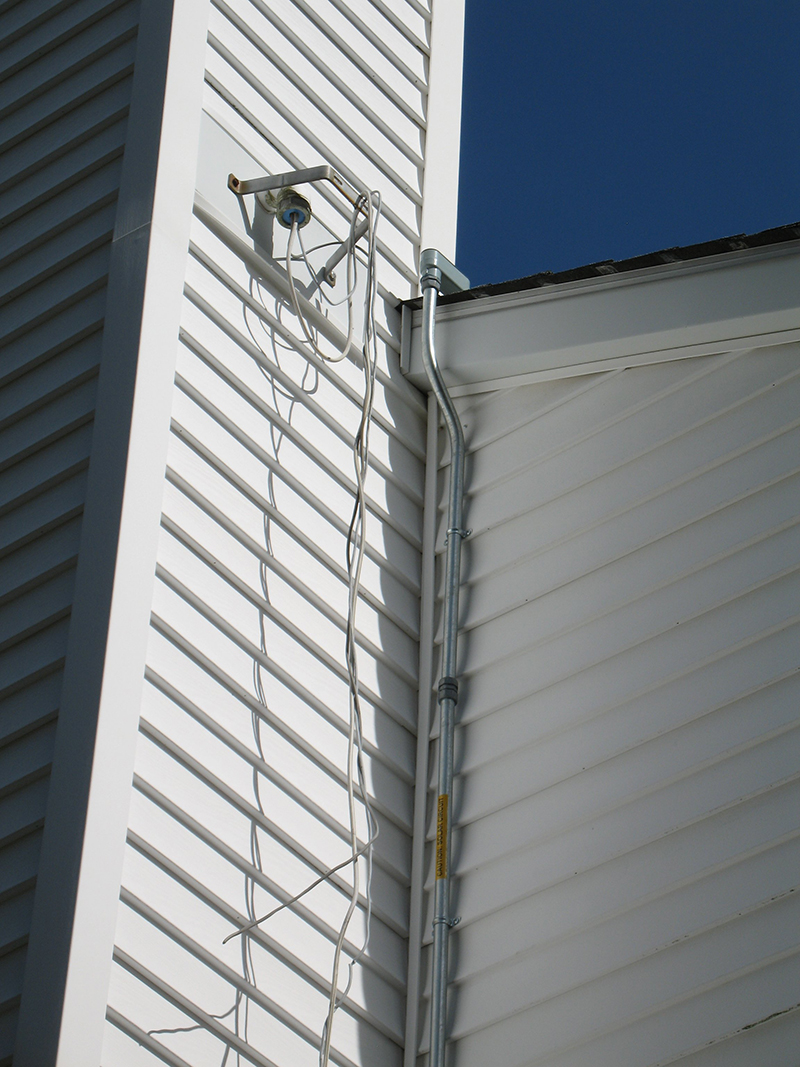
FIGURE 6. Close-up of feed from the roof.
The wiring is then fed into the basement to the inverter (Figure 7) and interior shut-off switch (on the right).
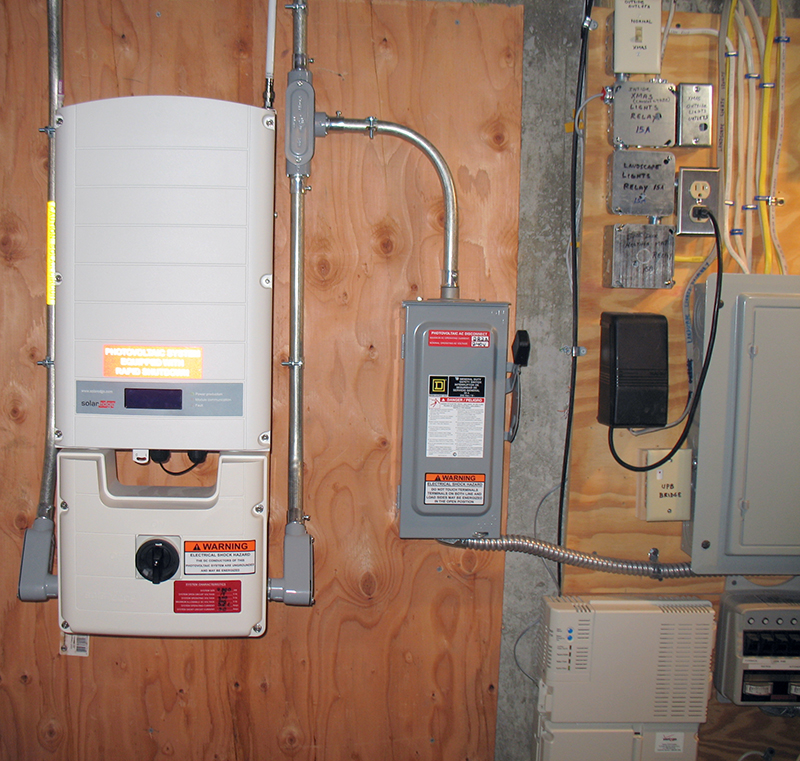
FIGURE 7. Inverter and shut-off (right) in the basement.
The inverter is a SolarEdge inverter (SE10000A-US) rated at 10,000 watts. There are system shut-offs both inside and outside the house. The conduit on the left side comes from the array and the conduit on the right of the inverter goes up to the meters on the outside of the house (Figure 8). There is a net meter supplied by the electric utility, a solar performance meter supplied by Sunrun, and an exterior shut-off.
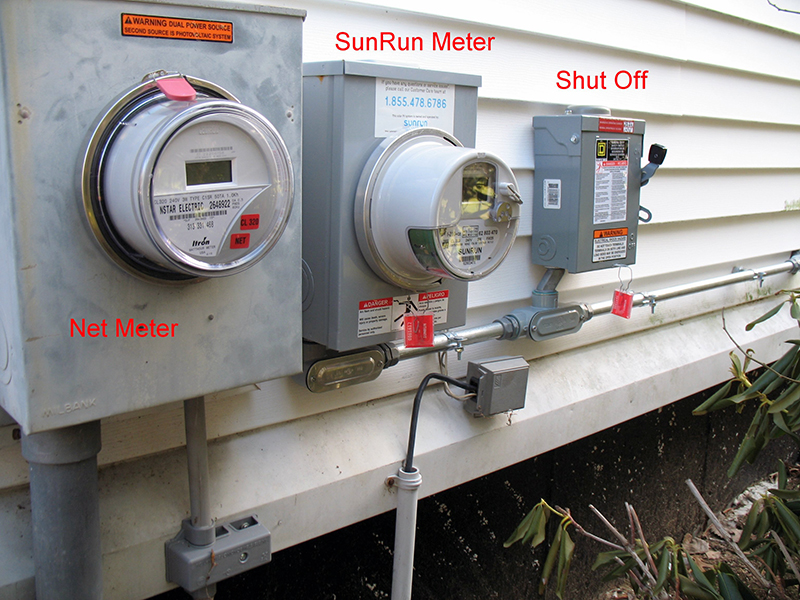
FIGURE 8. Metering outside the house.
Microinverters vs. String Inverters vs. Power Optimizers
Recently, there has been a lot of discussion on processing solar power and the best architecture for a solar photovoltaic system. Listed below is a short summary of three different methods:
1. Sunrun used power optimizers on my system which had a small module on each panel to condition the DC before sending it to the centrally located inverter in my basement, where it is converted to AC and synchronized to the power line. The only downside I have found with this arrangement is fan noise. There are two fans in the inverter that turn on when the inverter is converting significant amounts of power (>4,000 watts), which is typically in the middle of the day. If there is a 2% inefficiency, the inverter has to get rid of 200 watts. The metal case gets warm on the sides and top. Would an external heatsink keep the fans from coming on? I have not tried that because the two small fans do not make that much noise and have not really bothered me (yet).
2. String inverters have the panels organized into groups or strings, and work best with all the panels on the same plane with no shading. (This was not my situation.) If one panel in the string is shaded, the output drops for that string.
3. Microinverters convert the DC to AC right at the panel before sending the power down to the basement; there is no need for a central inverter. They also tolerate shading. However, microinverters are more costly, and typically have more components with lower reliability (e.g., electrolytic capacitors) and lower efficiency (96% vs. 98% for power optimizers). Also, the more electronics on your roof, the higher the temperature swings (and failure rate) and the more difficult it is to maintain them when they fail.
There are many white papers (and heated discussions) on the best inverters and solar system architecture. They can be easily found with a Google search of the topic (see Resources).
Installation and Operation
From the time I signed the original contract until turn on, it took about 4-1/2 months. The actual time to install the system took less than two days. Why such a big difference? The rest of the time was spent by the company obtaining local permits, scheduling inspections, discussing issues with the power utility, answering my questions, revising the design, etc.
For example, the building inspector got into the act and made sure the brackets that hold the panels were secured into the rafters of the house and not just the plywood. Apparently, the assessors took the opportunity to tour the property when they heard the building inspector was invited. It also took two weeks waiting for the electric utility to swap out my meter for a net meter. It literally took them 10 seconds to do the actual swap. I timed them.
Monitoring
The system went live on August 7, 2015. There are at four ways I can monitor the performance of my system:
1. Manually, using meters. In the first few days, I looked at the Sunrun meter and the net meter. The meters flash different statistics based on how much power you are generating and how much you are consuming. The meters have unique IDs, show the date and time, and other useful data. After about a week, it was getting old running out to the meters at the end of the day (sometimes with a flashlight) to see the stats. The meters are the most accurate (although not the most convenient) revenue grade data available.
2. Sunrun website. Sunrun maintains a website where you can see all your data. It is very useful and shows how much power has been generated for the day, week, month, and year. It can take 24-48 hours for the data to show up, however.
3. SolarEdge inverter. There are diagnostic screens on the inverter, so naturally I had to play with them. Figure 9 shows the AC and DC voltages produced, the power (in watts), and how many panels are operational (38 out of 38).
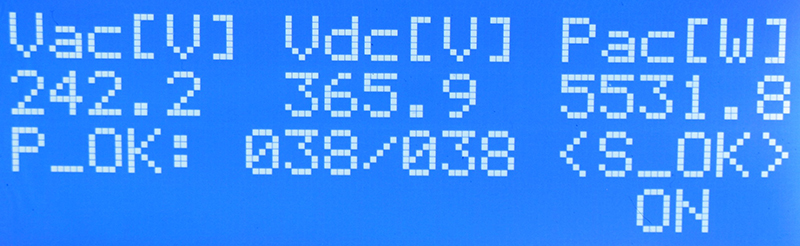
FIGURE 9. Voltages and power production status.
This information is sent to the solar company for diagnostic monitoring. Figure 10 shows the frequency of the AC voltage and the temperature of certain power components in the inverter.
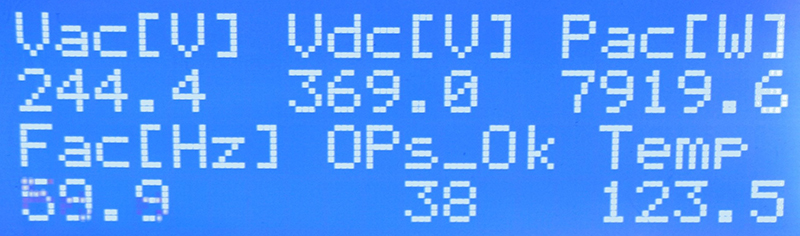
FIGURE 10. Frequency and temperature status.
Figure 11 shows the amount of power produced for the day, month, and year.
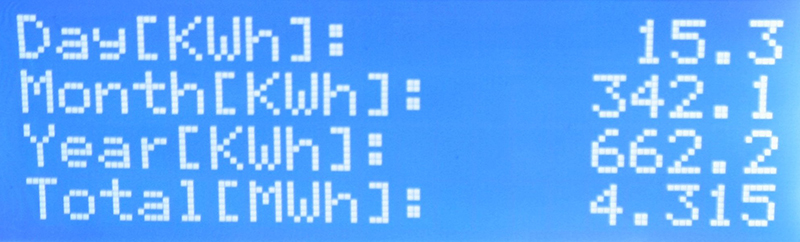
FIGURE 11. Power produced over time.
So, when I am in the basement near the inverter, I check the diagnostic screens by cycling through them. There are several other screens, including the status of the Zigbee connection to the panels.
I knew there was a Wi-Fi antenna on the inverter (see Figure 12), so I contacted the inverter company to see how I could log into it.
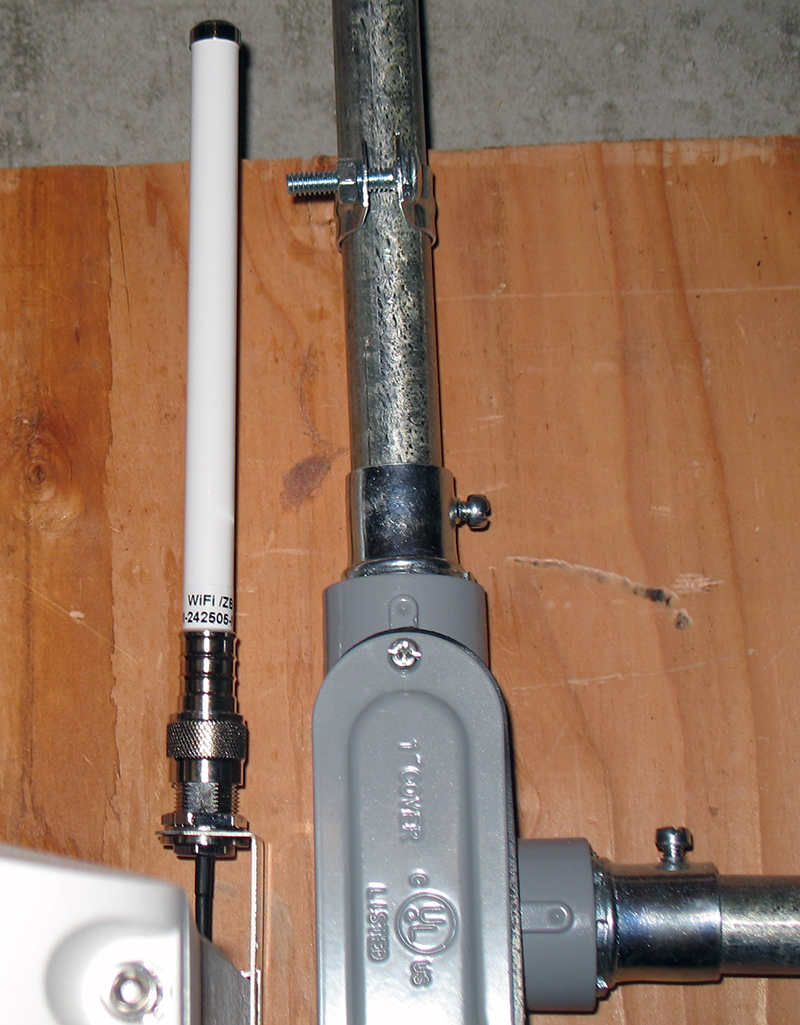
FIGURE 12. Inverter Wi-Fi antenna.
After several attempts, I was told that the installer (Sunrun) had to register me for that. After a total of 3-4 weeks back and forth, I was successful. I could log into a SolarEdge website where the data was presented near real time (within five minutes). This is the primary method I use now from work or anywhere else. I am planning to try it from a cruise ship this summer if the connection is fast enough. I have a SolarEdge app on my smartphone which works well also.
Performance and Results
The results shown are based on the SolarEdge website and my own utility records. Figure 13 shows the performance by month of the system.
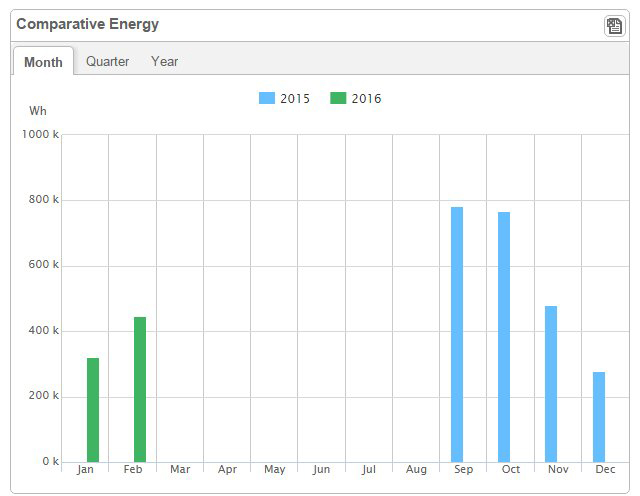
FIGURE 13. Power produced by month.
December was the poorest month due to shorter days and cloudy skies. However, February was on track to become even worse because of snow. Figure 14 tells the story.
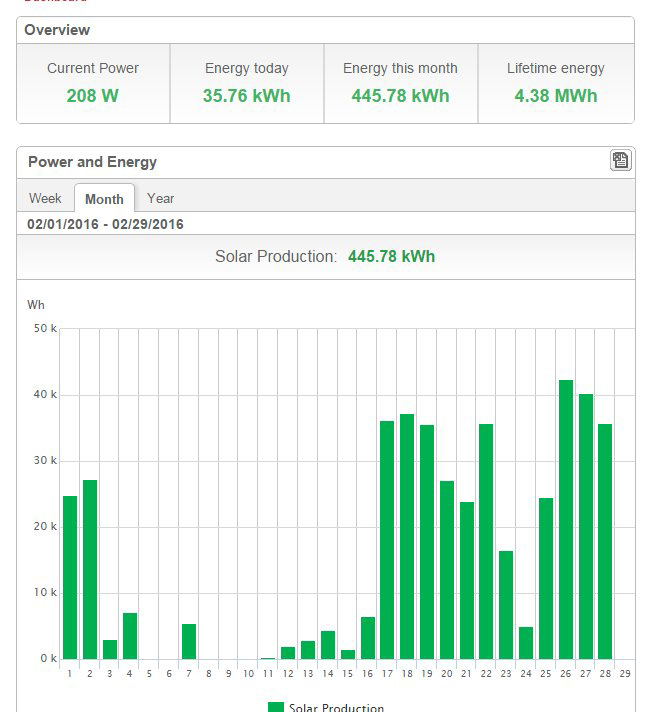
FIGURE 14. Power produced in February 2016.
At the top is the summary statistics as of February 28. There was a 10” snowfall on Friday, February 5. It was a heavy wet snow. I had bought a soft roof rake (see Resources), but by the time I got up on the lower porch roof, the snow had crusted over and it wasn’t going anywhere. It is important to use a roof rake made for this purpose, so you don’t scratch the panels. If the snow were soft and fluffy, I think I could have moved it.
On Sunday (the 7th), it started to melt slightly and the sky got brighter. Unfortunately, the following day (the 8th) we got hit again with another five inches of snow; the panels did not start to clear until the 11th. During most of this time, there were sub freezing temperatures. Gradually, production increased each day until it was about 35 KWH on the 17th (it rained the day before and that got rid of the remaining snow). So, snow can really make a difference. If the snow completely covers the array, the array will not warm up and melt the snow. Figure 15 shows the snow just starting to clear on the right side of the array partly due to my heroic (but feeble) attempts to clear it. When production resumed, it was even possible to see a plot of the power produced for a single day (Figure 16).
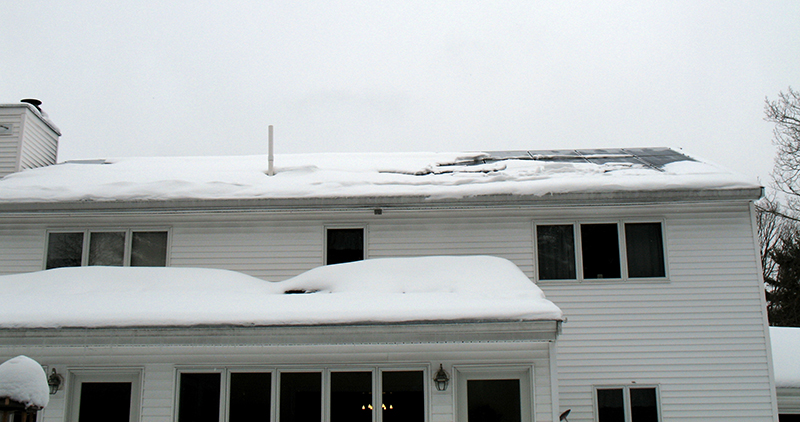
FIGURE 15. Snow covering the array.
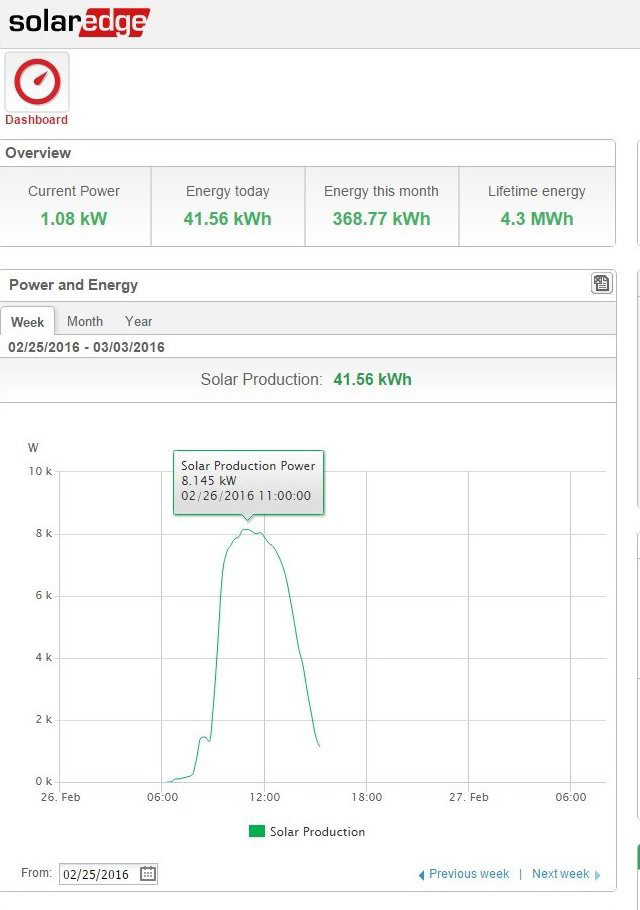
FIGURE 16. Power production during the day.
During these snow and subsequent wind storms, we did not lose power but some of the neighbors did. When the power is lost to a home, the solar photovoltaic system automatically disconnects from the grid as a safety precaution. If the utility company is working on the wires, the last thing they want to encounter is an unexpected live wire coming from a home. So, if you want backup power during an outage, you will still need a generator.
Rain and Snowmarmageddon
I learned that even on a rainy day, production can be 3-7 KWH. A cloudy day (depending on how cloudy) can result in 5-15 KWH of production. Snow (>1 inch) pretty much shuts down production. Last year, we got buried in snow and broke all kinds of records in New England; it would not have been a good winter for solar energy. How fast the snow clears off the panels depends on the temperature, type of snow, depth, and roof pitch.
I have roughly a four inch 12 pitch roof which means there is a four inch rise for a 12 inch run, or about 18-20 degrees. For snow to fall off faster, a 35 degree pitch is recommended. When the snow falls off solar panels, you can really hear it. When it hits my cellar bulkhead, you would think a train is rumbling next to you or you are experiencing a small earthquake. Make sure you do not have anything delicate or fragile underneath the array.
Savings
So, how much am I saving? Was it worth it? Figure 17 shows the KWH billed by the utility company after the system was installed compared to the same month during the previous year.
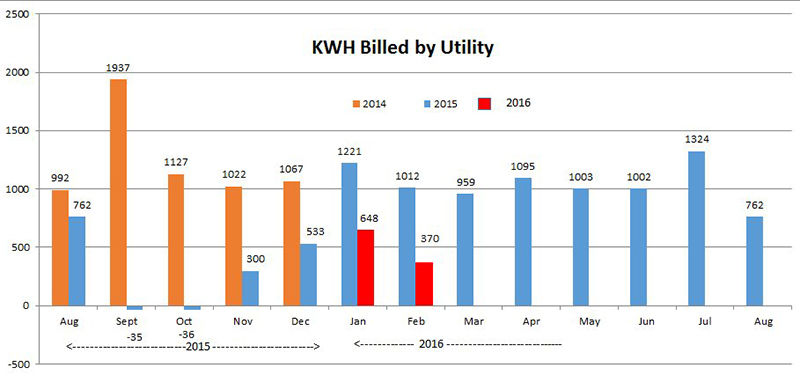
FIGURE 17. THe KWH/month billed by the utility.
September 2014 was an anomaly. I used a tremendous amount of power to dry out my cellar after a water leak flooded everything. That, hopefully, was a one time event. Still, there were two months where I generated more power than I used. It was nice to get a bill from the utility for $0.10 one month and a credit for $0.18 the next. Of course, I still had to pay Sunrun the monthly fee.
Figure 18 shows my overall total cost for electricity in dollars, including the utility cost and the Sunrun payment.
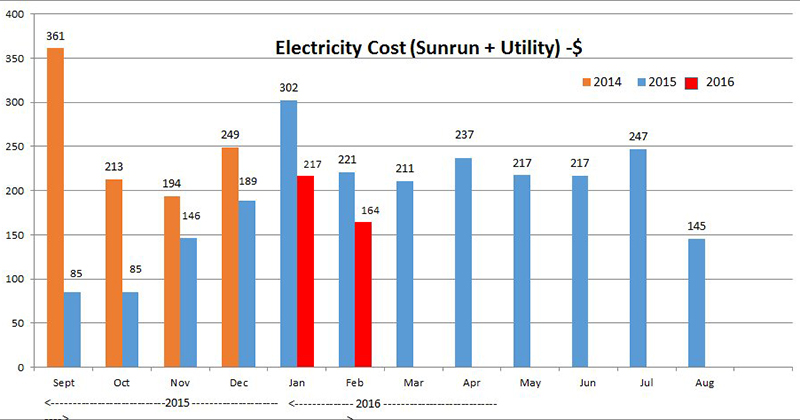
FIGURE 18. Total cost per month.
Every month was less than the year before. Figure 19 shows my savings in percentage by month.
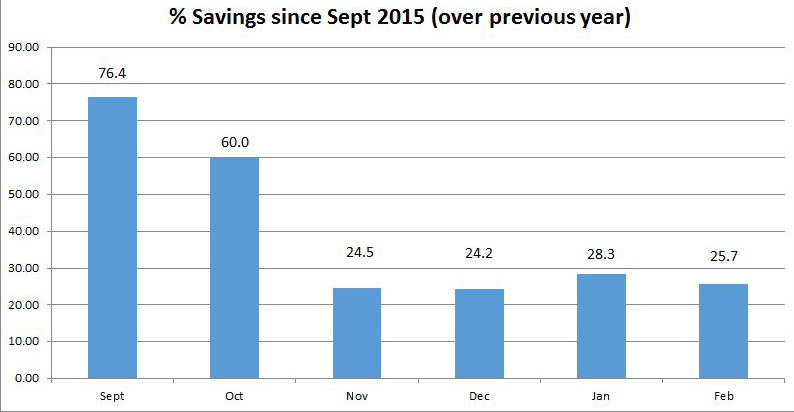
FIGURE 19. Percent savings per month.
Discounting September 2014, my average savings is about 32% per month so far. While some of these savings may be due to my modest efforts at energy conservation, I am expecting higher savings during the spring and summer months. So far, I am below the performance guarantee. I should get closer or meet it during the rest of the year. Stay tuned!
Summary
Overall, I am very happy with the system. I would do it again, since it has saved me significant money on my electric bill. The Sunrun folks were very consistent and professional in their approach and answered all my questions. One caveat, though. When many people get solar, they increase their consumption because they figure they have a free source of energy. To save money, it is still necessary to focus on conservation. I am continuing to convert my fluorescent lights (and CFLs) to LEDs and turning off unnecessary loads.
Whether you lease or buy a system, it is a rewarding feeling to be getting something for free. NV
Questions to Ask a Solar Installer
1. Has your solar company installed any systems in my town? Or a nearby town? Could I get their names and phone numbers to discuss their experience? How many systems in my state are installed?
2. Will the solar company perform its obligations during the entire initial term (20 yrs) even though the solar facility may not be "economically viable" as sometimes stated?
3. When does the site visit/audit take place?
4. How long after the site audit will it take for the design to be completed?
5. If my roof needs repair, how much will it cost to remove the system and re-install it?
6. Are the inverters used string inverters or microinverters or power optimizers? Why do you use that particular method?
7. Must I carry insurance that covers damage to my home caused by the system? What examples are there of how the solar facility could damage my home?
Is damage to the system covered by insurance carried by the company (if I lease or buy)?
8. What is the cost for power (in $/KWH)? Is there a chart that shows the yearly cost for electricity? Is it fixed or variable?
- Does it go up due to slight degradation in the solar panels?
- Is it the same if I buy or lease?
- Can I pre-pay the monthly payment if I lease?
9. If my roof needs extra bracing to hold the solar facility, am I responsible for that work?
10. What is the lead time for installation of a system right now?
11. What is the warranty on panels and the inverter if I buy the system? What is the warranty if I lease?
12. If I lease, is there an option to buy?
13. What is the performance guarantee and when is it paid out? Is it the same if I buy or lease?
14. How is maintenance covered if I buy the system? Is there a site visit charge?
15. Is there financing available if I buy?
16. Do I have to approve the final design before the deal is consummated?
17. What is the warranty on roof leaks caused by the system?
Net Metering
Net Metering is a service that allows a consumer to deliver excess energy from a solar photovoltaic array into the grid for credit. In effect, the grid becomes an unlimited "battery" for storage.
Each state has different laws, regulations, and allowances for net metering. In MA, a power utility must provide a one-for-one credit for each kilowatt hour produced (KWH). However, the utility only has to provide net metering to its customers up to a percentage of the utility's generating capacity. Once, that threshold (cap) is reached, the utility is not required to offer net metering (unless the law increases the cap).
Also, there may be a limit to the size of the customer's array (10 KW in MA). If the customer has a muncipal owned utility, net metering may not be available or only available for purchased systems. Net metering is vital to making solar economically justifiable for the homeowner, so it is critical to learn all the details. The solar companies should know exactly what the rules are for your area.
Solar Tax Credits
Federal
There is currently a 30% tax credit for solar installations. This is a credit (not a deduction) and reduces your tax liability by the amount of the credit and can carryover to subsequent years. It is set to expire on December 31, 2016 unless it is extended by Congress. There is also a gradual step-down of the credit per the following table:
30% for systems placed in service by 12/31/2019
26% for systems placed in service after 12/31/2019 and before 01/01/2021
22% for systems placed in service after 12/31/2020 and before 01/01/2022
There is no maximum credit for systems placed in service after 2008.
Systems must be placed in service on or after January 1, 2006, and on or before December 31, 2021.
The home served by the system does not have to be the taxpayer’s principal residence.
State (varies by state)
For State of MA:
$1,000 State Tax Credit
Every homeowner that purchases a solar electric system qualifies for a $1,000 state tax credit to use as a write-off against what is owed.
Solar Renewable Energy Credit (SREC) Program
SRECs are certificates earned by producing clean renewable energy. The homeowner can earn an estimated average of $150-$270 currently for every $1,000 KWH generated. However,SRECs are bought and sold on the open market, and their value can go up or down as a result of supply and demand. See www.lowellsun.com/todaysheadlines/ci_23376322/solar-credits-not-so-bright-those-who-own.
Resources
Buyer's Guide to Solar Financing
www.kaplancleantech.com/resources/solar/a-buyers-guide-to-residential-solar-financing
Inverter Types
www.solaredge.us/groups/us/technology/microinverters
www.energysage.com/solar/101/string-inverters-microinverters-power-optimizers
www.pv-magazine.com/archive/articles/beitrag/microinverters-vs-optimizers-_100016637/618/#axzz41f5JkzP8
Heated Blog about the Best Inverters
http://energyinformative.org/are-solar-micro-inverters-better-than-central-inverters
Roof Rake
www.roofrake.com/Productpages/snowpro2.asp
Federal Tax Credits
http://solaroutreach.org/wp-content/uploads/2015/03/ResidentialITC_Factsheet_Final.pdf
Solar Payback Calculator
www.sunearthtools.com/solar/payback-photovoltaic.php#top