Build this inexpensive Arduino based heart rate monitor that you can use as an experimental platform to understand the basics of biological monitoring. As a bonus, learn how to use a translational reality interface to create an Orwellian PID controller.
Biological Signal Monitoring
Given the popularity of electronic fitness watches from Fitbit, Apple, Polar, and others, monitoring your heart rate is perhaps the easiest and most popular form of biological signal monitoring (I’m excluding non-technology enabled forms of monitoring, such as a finger over a pulsing artery or a hand over a warm forehead).
Whether we’re talking heart rate, blood pressure, blood glucose level, or blood oxygenation, biological signals share several properties: irregularity; association with conditions; they favor specific modes of detection; and they are accompanied by noise.
Biological signals are typically irregular in amplitude and/or frequency, compared to the output of, say, a crystal-controlled oscillator.
The electrical signals generated by our nervous systems, muscle activity, joint motion, and various metabolic processes change with activity, time of day, time since eating or drinking, food or drugs ingested, changes in the environment, emotional state, and the like. The nature of your heartbeat varies with your breathing, for example.
Certain biological signals are associated with specific physiological states or conditions. For example, abnormally elevated fasting blood sugar is associated with diabetes; irregular heartbeats are associated with certain forms of heart disease; and an abnormally high waking heart rate is associated with overtraining. Similarly, a quicker recovery to normal heart rate after an all-out effort is associated with greater fitness.
Biological signals tend to lend themselves to a specific form of monitoring or detection. Monitoring the electrical activity of the heart is one method of determining heart rate, but monitoring the electrical activity of the pancreas hasn’t proven useful in the monitoring of diabetes.
This isn’t to say there’s only one method of monitoring the function of a given organ.
For example, heart rate can be determined by monitoring electrical activity of the depolarizing and repolarizing heart tissue, or by directly (i.e., physically) or indirectly (i.e., optically) measuring the pulsations of blood with each beat of the heart.
Biological signals are plagued by noise simply because there’s a lot going on in a body. If you’re measuring the electrical activity of a bicep muscle via electromyography, for example, then there is going to be unwanted signals from the triceps and other nearby muscles, plus signals from the heart, diaphragm, and perhaps contraction of the stomach if you’ve recently eaten.
Similarly, measurement of the perfusion of your biceps is going to vary with a sneeze, a squeeze of your hands, and other biological activity, not to mention factors in the environment. Think a 5G pull in an F16.
Optical Heart Rate Monitoring
For this article, I’m going to focus on optical heart rate monitoring — the same variety of monitoring used by the Fitbit watch, as opposed to the EKG variety popularized by Polar.
My first watch based heart rate monitor — a ‘70s sports watch from Timex — was founded on optical principles discovered well over 100 years ago. That is, with each contraction of the left ventricle, a bolus of blood rich in red blood cells (RBCs) is ejected into the aorta.
Within a few milliseconds, this pulse reaches the fingertips, ear lobes, and other peripheral areas, opening the small capillaries and temporarily filling them with a rush of RBCs. This transitory mob of red blood cells absorbs and reflects light differently from surrounding tissue.
If you measure the changes in amplitude of light passing through capillaries in a thin layer of tissue (such as an earlobe or fingertip), then heart rate can be easily calculated in beats/minute. For an earlobe probe, this entails fixing an LED on one side of an earlobe and a receiver on the opposite side.
Depending on the design, desired noise immunity, and need to measure other blood parameters (such as blood oxygenation), the wavelength is usually red, IR, or a combination of the two.
Now, let’s say we’re going to monitor heart rate during your daily workout on a treadmill or spinning bike. Assume that it’s ideal to exercise at between 50%-85% of your maximum heart rate, and that this maximum is 220 minus your age.
For example, if you’re healthy, athletic, and 20 years old, your maximum heart rate is about 200 beats/minute. For maximum aerobic conditioning, you’d want to run on the treadmill with a heart rate of between 100 and 170 beats/minute. Cruise at 70 beats/minute and you’re wasting your time. Sprint at 175 or 180 beats/minute for more than a minute or two, and you might end up on a stretcher en route to a cardiac care unit.
With this physiology background behind us, let’s get to the project.
The Hardware
The key hardware for this project is an inexpensive Arduino-compatible ear-clip heart rate sensor by Grove ($13 at www.seeedstudio.com). If you own a solderless Grove shield, then construction takes all of five seconds.
Simply attach one cable to the shield and the other to the sensor, and you’re ready to go. Figure 1 shows the Grove shield and leads going to and from the sensors and LEDs.
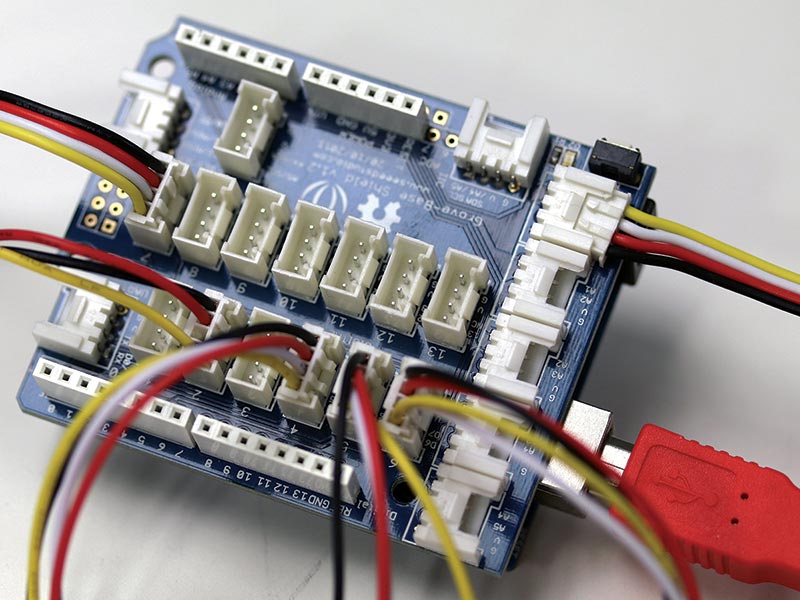
FIGURE 1. Hardware setup with Grove shield.
Figure 2 shows one of the output LEDs. Because the limiting resistor is built into the unit, there’s no need for additional components. Just plug and play.
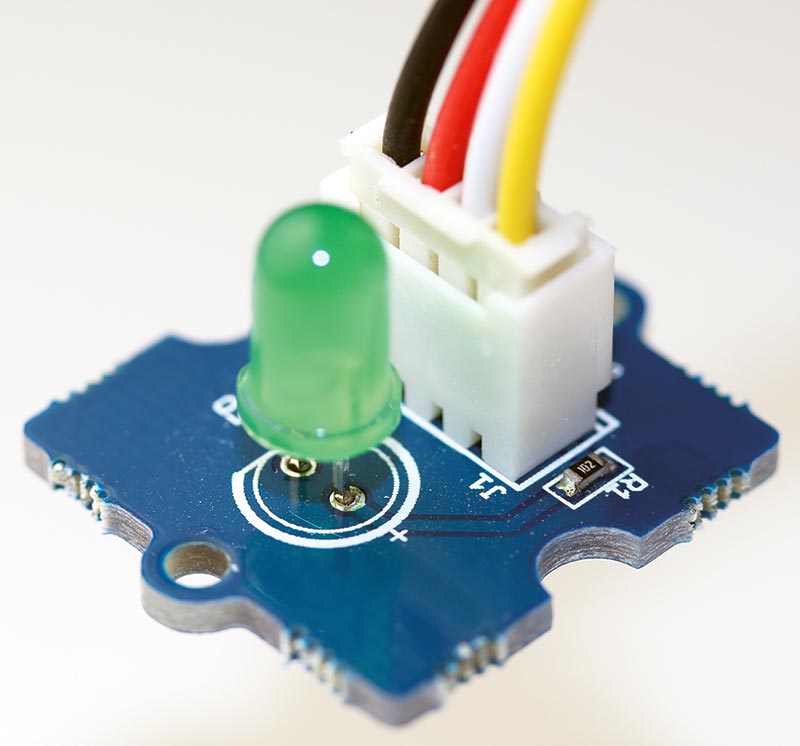
FIGURE 2. Grove green output LED. Note the built-in series limit resistor.
The red cable provides USB connectivity during development and adequate power for operation. No external power is required. If you’re working without a special shield, then you can quickly connect the signal, power, and ground leads to the Arduino with male-male jumpers. Figure 3 shows a close-up of the ear-clip sensor, with the LED visible behind a glass panel in one side of the clip. The receiver is similarly embedded in half of the clip facing the LED side.
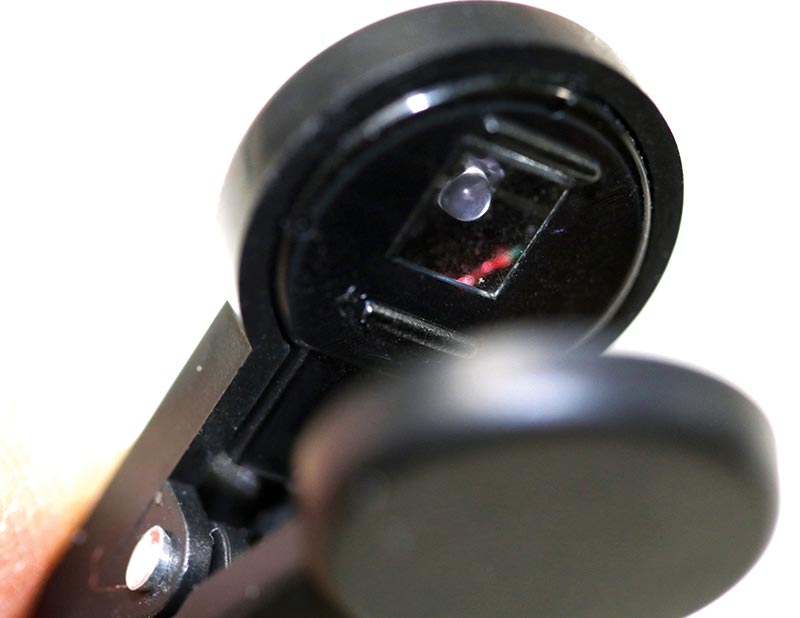
FIGURE 3. Ear-clip sensor with LED visible on one side of the clip.
Figure 4 shows the component side of the ear-clip sensor board. The three leads to the Arduino — signal, ground, and VCC — are on the left. A 3.5 mm stereo jack and plug leading to the clip body is on the right side of the board.
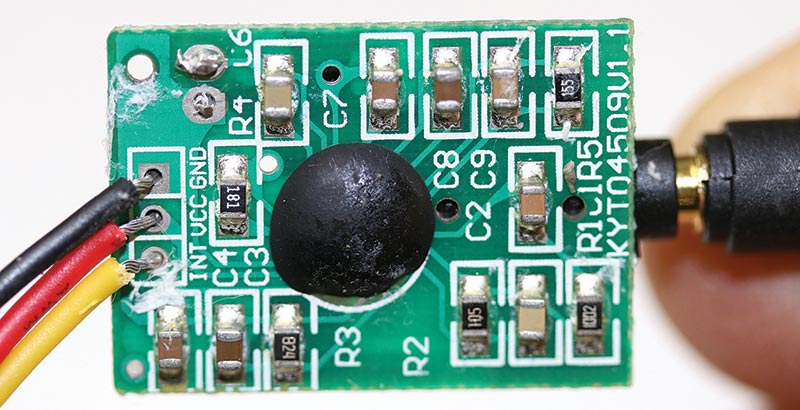
FIGURE 4. Component side of the ear-clip sensor board.
In order to take this photo, I had to excavate the board from a tomb made of hot glue and double-sided tape inside of a sealed plastic case. I’m not sure what the manufacturer might be trying to hide because there isn’t much to see.
As shown in the figure, there’s a chip in the middle of the board that’s encased in an epoxy dome. As such, the ear-clip interface remains a black box, as I wasn’t able to locate a schematic online.
Fortunately, the inexpensive sensor works very well, and a replacement is affordable.
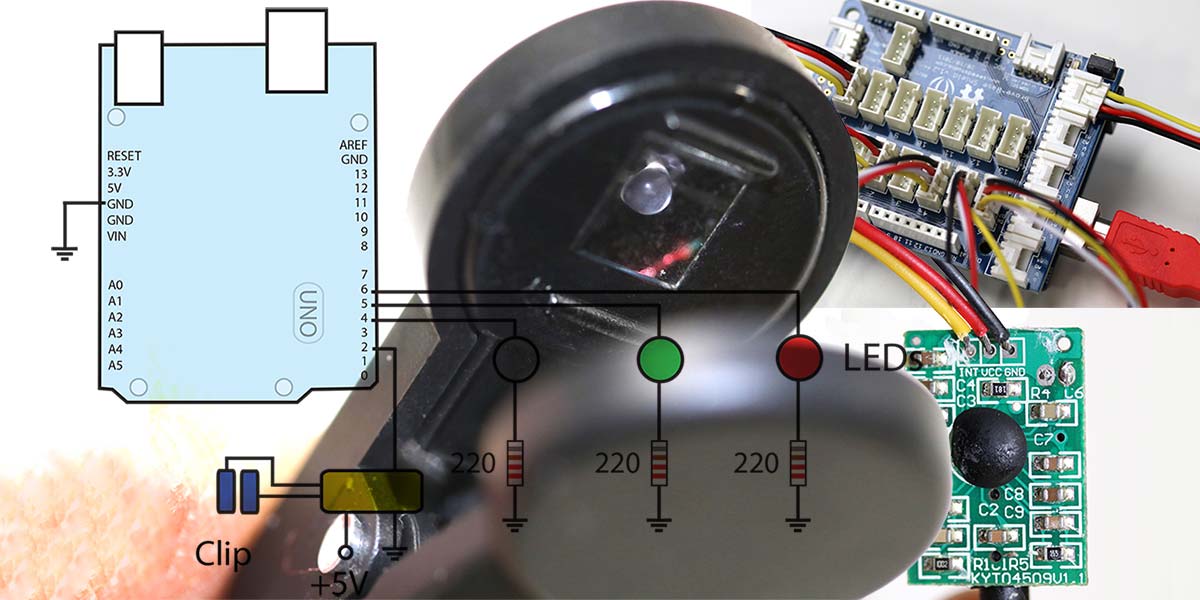
Figure 5 shows the schematic of the heart rate monitoring system. There’s an Arduino Uno (or compatible board), three LEDs and associated current-limiting resistors, and the ear-clip rate sensor.
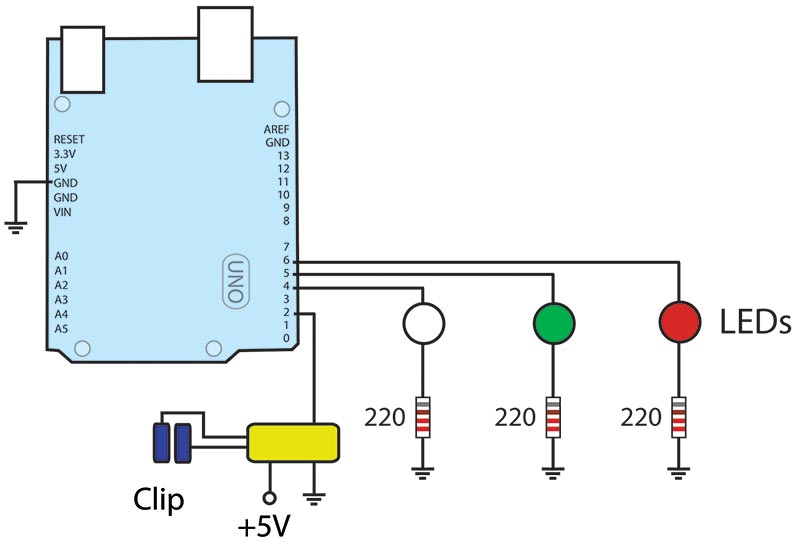
FIGURE 5. Schematic of the heart rate monitoring system.
Since the sensor draws less than 5 mA, a 9V battery can power the system for several days. If you plan to operate the system during a run or ride outside, you might consider picking up an inexpensive case for the Arduino ($7 and up; Amazon).
The Software
The Arduino source code for the basic heart rate monitoring system is shown in Listing 1, and an annotated listing is available in the downloads.
#define Clip 2<br />
#define SlowLED 4<br />
#define ZoneLED 5<br />
#define FastLED 6
unsigned long ZoneLow = 0;<br />
unsigned long ZoneHigh = 0;<br />
unsigned long previousMillis = 0;<br />
unsigned long currentMillis = 0;<br />
unsigned long Interval = 0;<br />
unsigned long currentInterval = 0;<br />
unsigned long previousInterval = 0;<br />
const long minInterval = 300;  <br />
const long maxInterval = 1200;
void setup() {<br />
  pinMode(Clip, INPUT);<br />
  pinMode(SlowLED, OUTPUT);<br />
  pinMode(ZoneLED, OUTPUT);<br />
  pinMode(FastLED, OUTPUT);<br />
  ZoneLow = 860;<br />
  ZoneHigh = 600;<br />
}
void loop() {<br />
  if(digitalRead(Clip)>0){<br />
    unsigned long currentMillis = millis();<br />
    currentInterval = currentMillis -<br />
    previousMillis;<br />
    if (currentInterval > minInterval) {<br />
      previousMillis = currentMillis;<br />
      Interval = (previousInterval +<br />
      currentInterval)/2;<br />
      previousInterval = Interval;<br />
      if (Interval < ZoneHigh){<br />
        digitalWrite(FastLED, HIGH);  <br />
        digitalWrite(ZoneLED, LOW);<br />
        digitalWrite(SlowLED, LOW);<br />
      }else{<br />
        if (Interval > ZoneLow){<br />
        digitalWrite(FastLED, LOW);<br />
        digitalWrite(ZoneLED, LOW);<br />
        digitalWrite(SlowLED, HIGH);<br />
        }else{<br />
        digitalWrite(FastLED, LOW);<br />
        digitalWrite(ZoneLED, HIGH);<br />
        digitalWrite(SlowLED, LOW);<br />
        }<br />
     }     <br />
   }<br />
  }<br />
}
LISTING 1. Arduino code for heart rate.
In the definition of constants and variables at the head of the program, note the use of unsigned long and long variables.
This format is required because the interval measurements between heart beats is calculated with the system’s millis() function, which returns the milliseconds since the program started in an unsigned long format.
I’ve implemented filtering of the heart beat signal in two ways.
First, each pair of pulse-to-pulse intervals received from the ear-clip sensor is compared with a timing window of physiologically probable beats.
In this case, given the user is exercising, it’s reasonable to expect a heart rate of between 50 and 200 beats/minute. These correspond to 1,200 millisecond and 300 millisecond intervals, respectively, as represented by maxInterval and minInterval.
A beat detected outside this window is ignored. This is admittedly a generous window — I’ve never met anyone with a heart rate of 50 beats/minute while running or otherwise exercising.
The second filtering operation is performed in the loop by averaging the current beat-to-beat interval measurement with the previous interval, and using that average as the current interval duration.
For example, if the current interval is measured at 1,000 milliseconds and the second is measured at 800 milliseconds, then the average of 900 milliseconds is taken as the value of the current interval.
This walking average approach to filtering minimizes the LED display jumping from one color to the next with every beat when the user’s heart rate is at the fringes of the training zone.
In this example, the training zone assumes a 20 year old user with a training target of between 70 and 100 beats/minutes, represented by a ZoneLow value of 860 and a ZoneHigh value of 600, respectively.
If you’re not 20, then you’ll have to modify the values for ZoneLow and ZoneHigh to reflect 50%-85% of your maximum heart rate, as described earlier.
Operation
Once you’ve entered the heart rate limits for your age correctly in the software and uploaded the code to the Arduino, simply clip on the sensor and start exercising. Within a minute of maintaining a pace within your exercising window, the green LED should be illuminated. If, instead, the white LED is illuminated, you need to speed things up. Conversely, if the red LED is illuminated, you’re red-lining it.
Once you’re happy with the basic setup, you can extend the hardware and software in a variety of ways. An easy add-on is to have the appropriate LED blink in synch with the beat signal from the sensor. If you’re more adventurous, add a color OLED display that shows the numeric heart rate, in white, red, or green, with a blinking heart icon to the side of the numeric display.
Although I find it a bit annoying, if you want to, you could substitute a buzzer for the red and green LEDs. It should be obvious to you whether you’re over- or under-exerting yourself.
The Translational Reality Twist
Okay. We’ve covered the basics of biological monitoring, including the need to handle noise and variability in the signal. Now, let’s do something a little out of the ordinary.
If you’ve followed my recent translational reality articles in SERVO and Nuts & Volts, you know that the idea is to provide a real time closed-loop system in which a user operates a familiar first device and — in so doing — both monitors and controls a second device. The kicker is that feedback is appropriate to the first device, but reflects the operation of the second device.
In this article, I’m going to show you how to leverage the innate pattern matching and self-regulatory skills of the user to serve as a proportional integral differential (PID) controller.
As you may know, a PID controller has myriad application areas — from automotive cruise control to maintaining constant robotic arm movement regardless of load, and home temperature control. In short, although the user thinks they’re modifying their pace to keep their heart rate within the training zone (as indicated by the green, red, and white LEDs), they’re actually controlling and monitoring the pressure, temperature, level, etc., of an external remote device.
Updated Hardware
For simplicity, the goal of our human PID controller is to maintain the temperature of a 100 ohm 1/4 watt carbon comp resistor within a fixed range. We’re closing the feedback loop with a hard-wired thermistor.
As shown in Figure 6, the 10K negative temperature coefficient thermistor ($0.75; SparkFun) is bonded directly to the resistor with thermal epoxy.
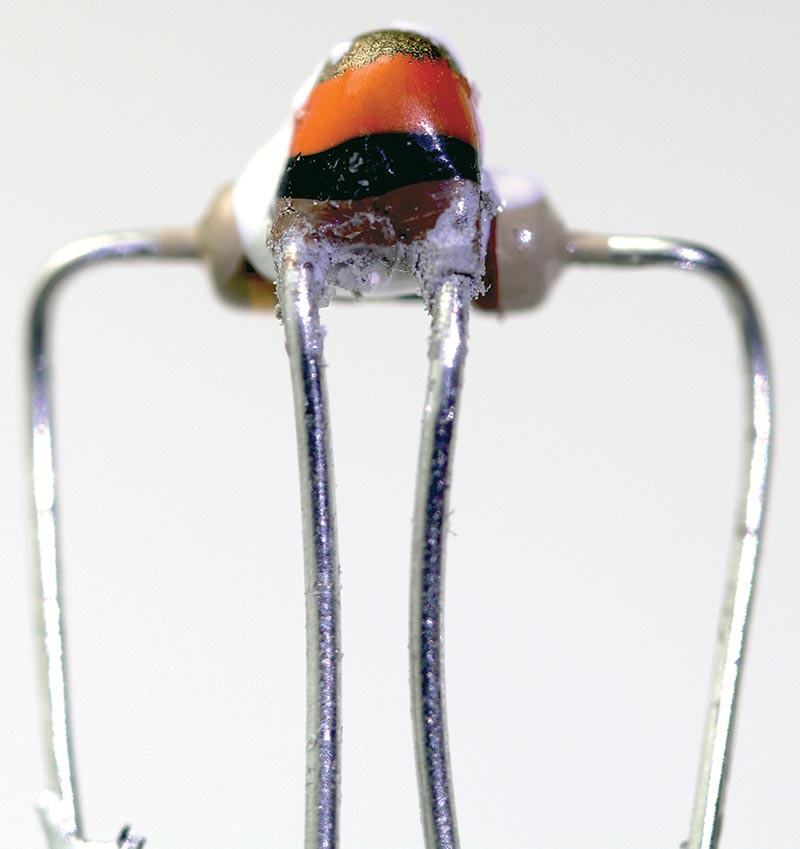
FIGURE 6. Teardrop10K thermistor (top) bonded to 100 ohm resistor.
The updated schematic in Figure 7 shows how the thermistor is combined with a 10K resistor to form a voltage divider.
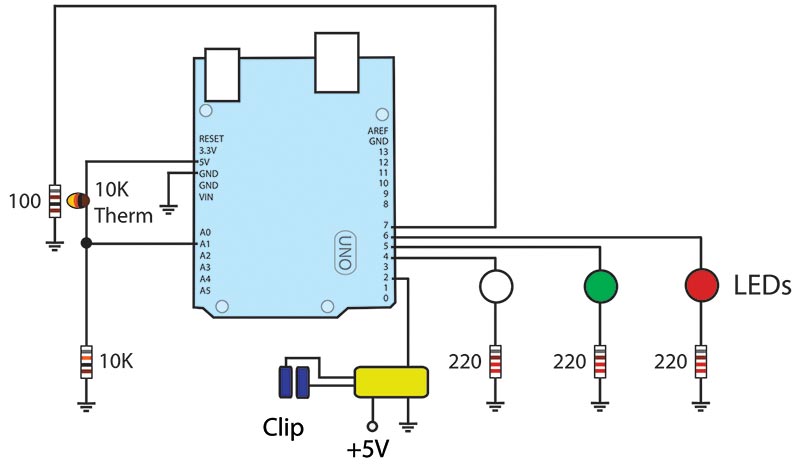
FIGURE 7. Updated schematic.
Again, for simplicity, the local Arduino is going to serve to both display the local heart rate and to process the data from the remote thermistor. In practice, the remote device would have an embedded processor that would communicate with the remote processor.
For example, the cable between the remote device — in this case, a resistor fed by a power source — could be replaced with a pair of $7 ESP8266 Wi-Fi modules. Regardless of the form of connectivity, the feedback to the user is the same as before.
However, in this case, the three LEDs indicate the temperature of the remote system, not the user’s heart rate.
Updated Software
The updated software is shown in Listing 2. Unlike the code in the first listing, the user’s actual heart rate controls the remote system. Note the addition of the tempInput port (A0) and pulseOut port (D7) on the Arduino, as well as constants for heatIntensity and heatTime. They operate as the names suggest.
#define tempInput A1<br />
#define Clip 2<br />
#define SlowLED 4<br />
#define ZoneLED 5<br />
#define FastLED 6<br />
#define pulseOut 7<br />
#define heatIntensity 255<br />
#define heatTime 150<br />
int temperature = 0;<br />
int ZoneLow = 0;<br />
int ZoneHigh = 0;
void setup() {<br />
  Serial.begin(9600);<br />
  pinMode(Clip, INPUT);<br />
  pinMode(SlowLED, OUTPUT);<br />
  pinMode(ZoneLED, OUTPUT);<br />
  pinMode(FastLED, OUTPUT);<br />
  pinMode(pulseOut, OUTPUT);<br />
  ZoneLow = 500;<br />
  ZoneHigh = 520;<br />
}
void loop() {<br />
  if(digitalRead(Clip)>0){<br />
    analogWrite(pulseOut, heatIntensity);   <br />
    delay(heatTime);<br />
    temperature = analogRead(tempInput);<br />
    Serial.println(temperature);<br />
 if (temperature > ZoneHigh){<br />
        digitalWrite(FastLED, HIGH);  <br />
        digitalWrite(ZoneLED, LOW);<br />
        digitalWrite(SlowLED, LOW);<br />
      }else{<br />
        if (temperature < ZoneLow){<br />
        digitalWrite(FastLED, LOW);<br />
        digitalWrite(ZoneLED, LOW);<br />
        digitalWrite(SlowLED, HIGH);<br />
        }else{<br />
        digitalWrite(FastLED, LOW);<br />
        digitalWrite(ZoneLED, HIGH);<br />
        digitalWrite(SlowLED, LOW);<br />
        }<br />
      }<br />
  }else{<br />
    analogWrite(pulseOut, 0);  <br />
  }<br />
}
LISTING 2. Arduino code for translational reality interface.
For example, heatTime is the time in milliseconds that the 100 ohm resistor is sent a 5V PWM signal at 100% duty cycle. Note also that while most of the code is unchanged from Listing 1, the comparison operators within the main loop are the inverse of what appears in Listing 1.
Depending on the ambient temperature and exact configuration of your hardware, you may need to tweak the operating window to be larger or smaller within the normal training range of the user. That is, you might select a five degree window for the remote system to map onto a, say, 20 heart beat range.
For debugging purposes, I left in the Serial.println(temperature) function. You’ll probably need it to get the operating window defined.
In my experiments using a 5% tolerance resistor and a 71 degree ambient temperature, the temperature value was 478 cold. At a pulse rate of 90 beats/minute, the value returned by the voltage divider reached a steady state of 514 at two minutes. Most of the changes occurred within 30 seconds of changing pace.
This is admittedly a narrow range of input voltages for mapping purposes, and even though the thermal mass of the epoxy-resistor-thermistor combination is small, it is significant.
If you want to get into serious remote control of the temperature, then replace the thermistor with a sensitive solid-state temperature sensor with good linearity. I’ve had great results with the MCP9808 ($5; Adafruit) which uses a standard I2C interface. There’s a good tutorial on the Adafruit site.
If you do opt for a more sensitive and accurate temperature monitoring sensor, then you have the option of revisiting the time and duty cycle of the signal sent to the 100 ohm resistor.
In the current configuration, the power is either fully on or off. With more dynamic range to play with, you can experiment with modulating the time and/or duty cycle of the heating current.
Of course, in the real world, you might be monitoring and controlling a much larger heat source, offering a much wider operating window and obviating the need for a more sensitive and accurate sensor.
Updated Operation
Operation, from the user’s perspective, is the same as before. The user exercises at a high enough intensity to keep the green LED illuminated, kicking it up a bit when the white LED is illuminated and easing back when the red LED lights up.
Although potentially unethical, you could also map the changes in the remote system such that the user would have to exercise past their 85% maximum heart rate value in order to keep the remote system under control.
Discussion
Admittedly, this is an Orwellian example of how translational reality can be utilized. I don’t think that I’d mind being used as a human PID controller for the heater control of a municipal swimming pool, but I might have second thoughts about remotely and unknowingly controlling a Predator drone.
My point in this admittedly twisted exercise to showcase what could be done with translational reality technology is quite easy.
If you think about it, there are a number of innate human skills or physiological attributes that could be applied to much harder (and practical) problems. NV
Translational reality is a real time closed-loop system in which a user operates a familiar first device and — in so doing — both monitors and controls a second device. The kicker is that feedback is appropriate to the first device, but reflects the operation of the second device.
Downloads
What’s in the zip?
Source Code