A complete stand-alone platform for displaying data from the Internet.
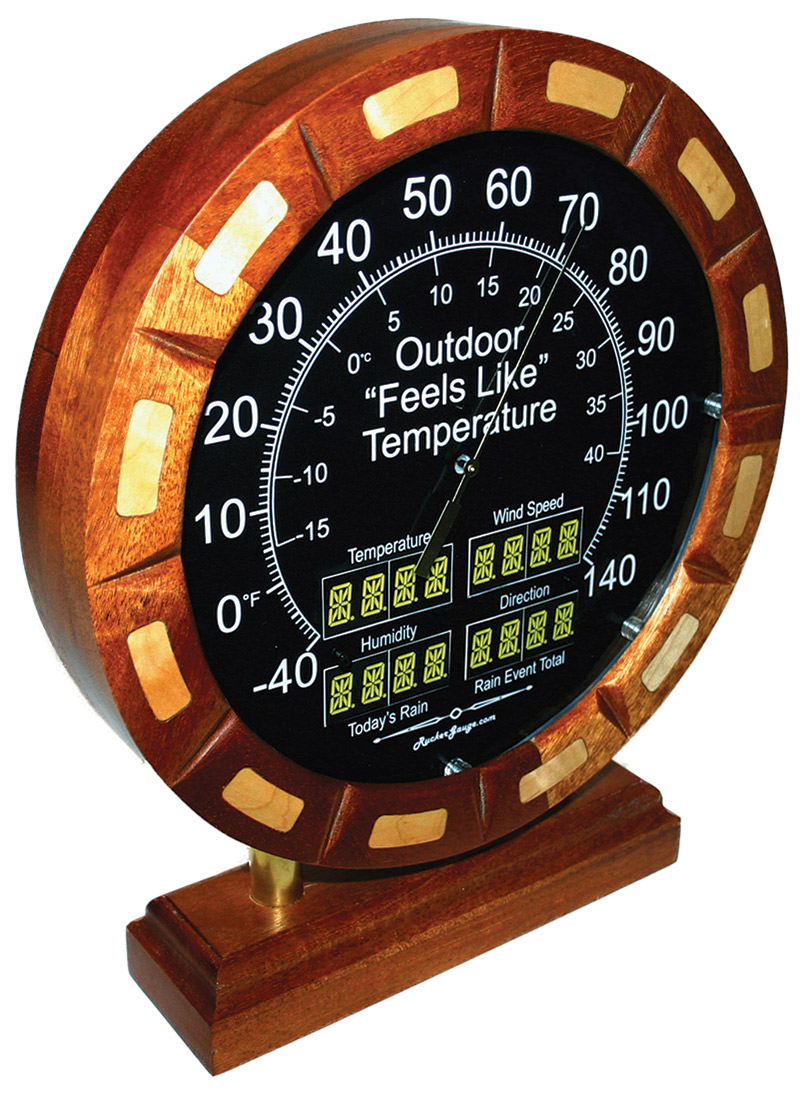
FIGURE 1. Weather gauge.
The weather gauge described here pulls data from the Weather Underground’s API and presents it on an attractive custom gauge. It can pull information from instruments in your backyard or even in another state through your home’s Wi-Fi Internet connection.
Case Work
The projects I enjoy the most are the ones that challenge me on several fronts. I recently completed this project that pushed the envelope for me. It required detailed woodworking, circuit design (a custom printed circuit board [PCB] with surface-mount components), and code. Lots of code.
I really wanted to make something that looked at home on a mantel above a crackling fire, and knew I was going to have to step up my game. I needed to take my woodworking and coding skills to the next level to pull this one off. The circuit design for this project wasn’t a big challenge. I mostly had to break the circuits out in an organized fashion, so I could focus my efforts elsewhere. The real challenge was with the 1,000+ lines of code and the comprehensive woodworking.
People (including me) definitely judge a book by its cover — especially when it comes to homemade projects. Just the term “homemade electronics”conjures up visions of buttons and gauges sticking out of a cardboard box or in a plastic project container. Not this time! The case was not going to be an afterthought at the end of the project. I started with the case (wood enclosure) this time.
I had been collecting pictures of old clocks and radio cabinets from the Internet, and with those in mind, I started drawing in SketchUp®. I think I must have drawn half a dozen detailed radio-looking solutions until I finally settled on a simple round “clock face” design; refer to Figure 2.
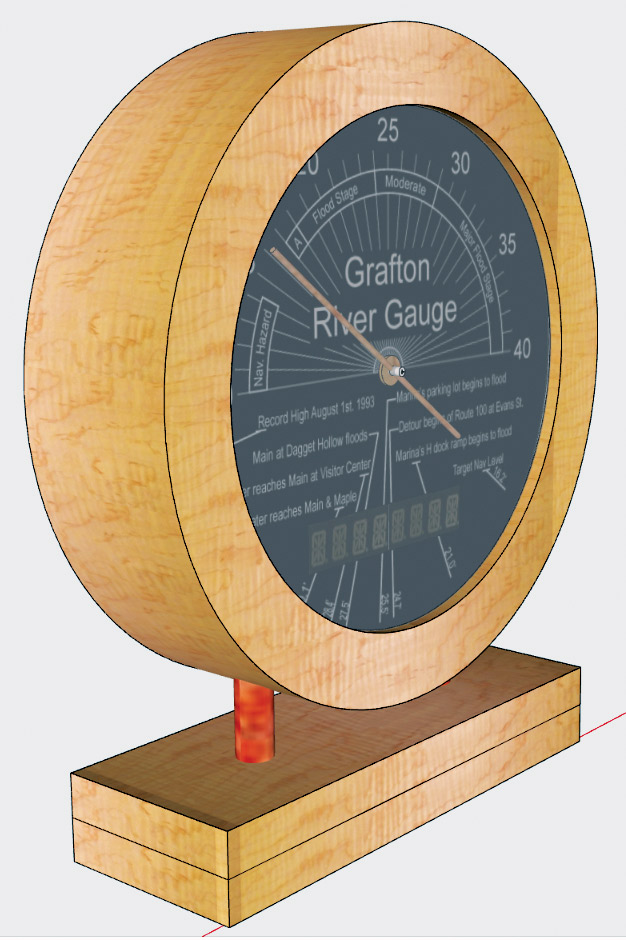
FIGURE 2. SketchUp model.
Once I had the SketchUp model to my liking, I sliced it up and exported it to VCarve pro from Vectric to create tool paths for my ShopBot. It took several attempts to get the tooling correct for the inlays and v-carved grooves, but I finally produced a prototype that looked pretty good.
I knew it still wasn’t all it could be, and to take it to the next level I needed a professional’s input and guidance. So, I threw my best-looking prototype in the front seat of the truck and headed down to Grafton, IL. I was hoping to catch Richard Mosby — a well-known local craftsman — in his shop (Figure 3). I was in luck! He was there. With a deep breath, I opened the door and humbly walked into his shop and handed him my prototype.

FIGURE 3. Richard Mosby from Mosby Woodworking.
To spark a conversation, I pointed out how I struggled with a few minor flaws that I knew he instantly noticed. It worked! I followed as we walked back into his shop to arrive at a huge planer and a drum sander.
I used my planer at home to get my prototype to this point, so I assumed he was going to tell me to do the same thing. Instead, he pointed out that a planer puts too much pressure on the wood and can’t really smooth out all the warp. To get all the warp out, I would need to use a drum sander as he opened the lid and walked me through how it differed from the planer. He also offered to show me how to use it in the future.
I was very pleased with the finished unit. What a great guy to take the time to help me out! Plus, he wouldn’t take a dime for his time. Thanks again, Richard! I’m now saving up for my own drum sander.
It was time to make the magic happen and give my wood case life.
The Devil’s in the Detail
In previous articles, I have written about how efficient and rewarding it is to interface your project to SmartThings®. Their cloud platform takes care of the user interface with an attractive professional-looking smartphone application that runs on both an Android and iPhone. For this project, I wanted a complete stand-alone solution; a platform I could build on. That meant the weather gauge would need to have its own user interface for setup and administration.
Figure 4 shows the Bootstrap “mobile first” web interface I created to accomplish this. It’s based on a Node.js® web server running on a Raspberry Pi; more on that later.
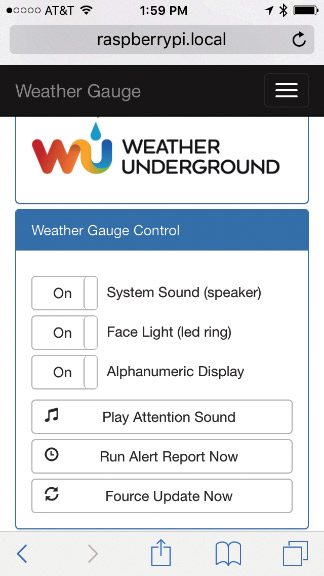
FIGURE 4. Weather gauge web app.
Let’s dig into some details. So, what exactly is the weather gauge made of?
From the front, you see a round solid mahogany wood case with Birdseye maple inlays around the outside. The gauge face is laser etched into a black on white plastic laminate with cutouts for the alphanumeric displays and the stepper motor’s shaft. Around the outside edge of the gauge face is a strip of color LEDs used to light the face.
The back of the gauge is 1/8” hardwood plywood stained to match, with a lit pushbutton for user input. The gauge is supported by two 3/4” brass tubes pushed into a mahogany wood block that has a jack for the 5V DC power plug. The wood was cut on a ShopBot-Buddy® (CNC router).
We’re Goin’ In
Let’s dig into the innerworkings. Just behind the gauge face is a 9-7/8” round 1/4” thick white acrylic disk with mount holes for all the electronic components (Figure 5).
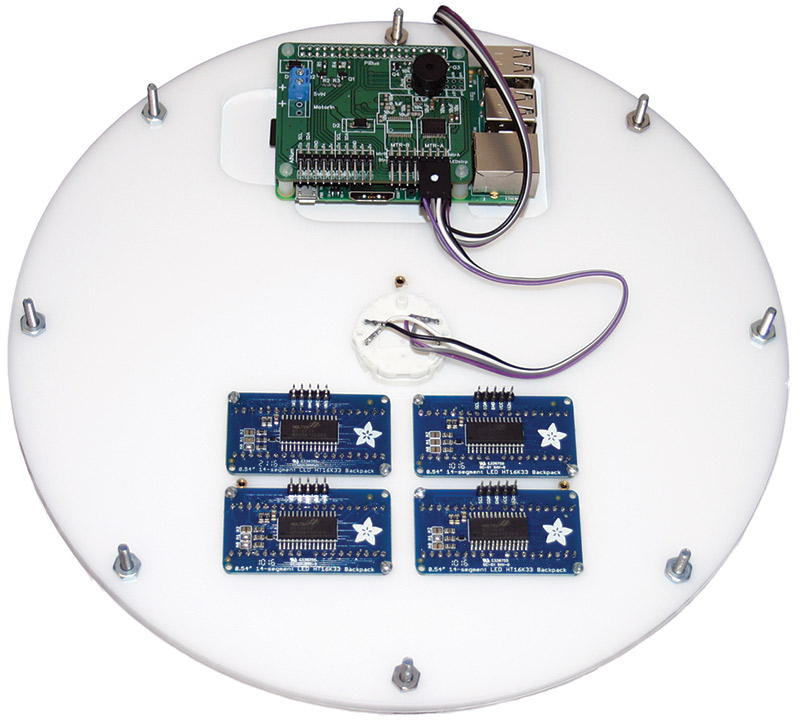
FIGURE 5. Acrylic disk base “clock works.”
This disk and the electronic components mounted to it form the “clock works” for the gauge. The clock works can be used inside any custom case; for example, you could put them in an old grandfather clock or make a custom case like I did.
Here’s a list of the five main electronic components that mount to the acrylic disk (Figure 6):
- Raspberry Pi 3 Model B (with built-in Wi-Fi)
- My custom PCB daughterboard RG-2MtrDrvr for the Raspberry Pi (DipTrace files are included in the downloads at the end of this article and on this project’s GitHub site at https://github.com/RuckerGauge/NV-Hardware).
- DotStar digital LED strip.
- Automotive grade stepper motor.
- Four quad alphanumeric displays — white 0.54” with I2C backpack.
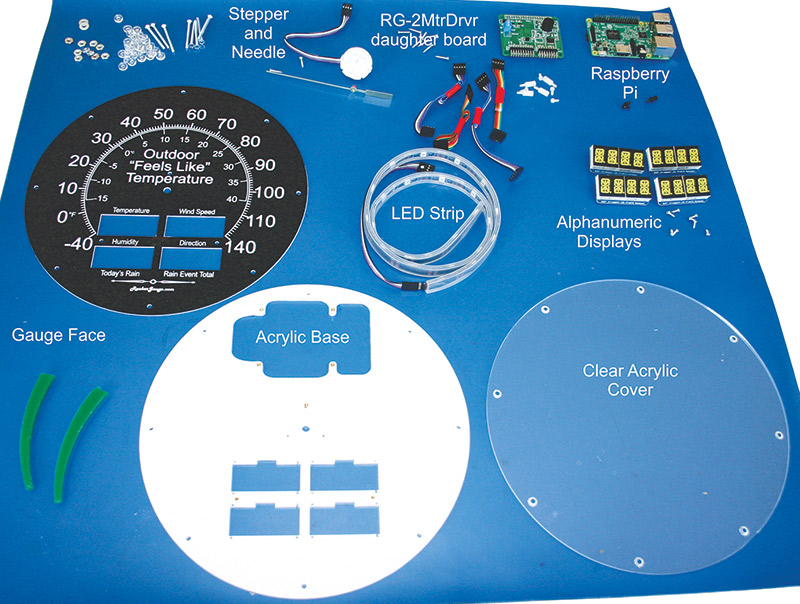
FIGURE 6. Weather gauge parts.
There is a significant amount of additional components — cables, connectors, screws, etc. — included in the Parts List, but the above five bolded items form the core of the gauge’s clock works.
The glue that brings everything together is Node.js mentioned previously. As stated on their website (https://nodejs.org/en): Node.js is a JavaScript runtime built on Chrome’s V8 JavaScript engine. Node.js uses an event-driven, non-blocking I/O model that makes it lightweight and efficient. Node.js’ package ecosystem — npm (https://www.npmjs.com) — is the largest ecosystem of open source libraries in the world.
I know this is a circuit focused magazine and sometimes a discussion of code can sound like a bit of a snoozer, but if you hang with me you may find it to be the most rewarding part of the project! I know I did. I’m 100% self-taught and there are going to be more efficient ways of accomplishing what I did. So, be sure to check out all the fantastic information online on how to program in Node.js. The main thing I want to illustrate here is how I used Node’s asynchronous event driven model to write device drivers (node.js classes) for each of the major hardware components. More on that later. Let’s get to the circuits!
Hardware Platform
This project is based on the Raspberry Pi running Raspbian Jessie Lite (Lynx without a graphical user interface; GUI). There have been several articles in this magazine and others on how to interface with the Raspberry Pi’s 40-pin header, so I’m not going to spend much time here on it. It’s straightforward if you have worked with a microcontroller before.
The general I/O pins run at CMOS 3.3V levels, with other pins providing I2C, SPI, UART, and PWM interfaces. This project uses the I2C interface to talk with the alphanumeric displays, and general I/O pins to bit bang commands to the LED strip and motor control ICs.
Figure 7 is the schematic for the RaspPi RG-2MtrDrvr daughterboard. It directly connects to the Pi’s 40-pin header pictured in the center of Figure 7.
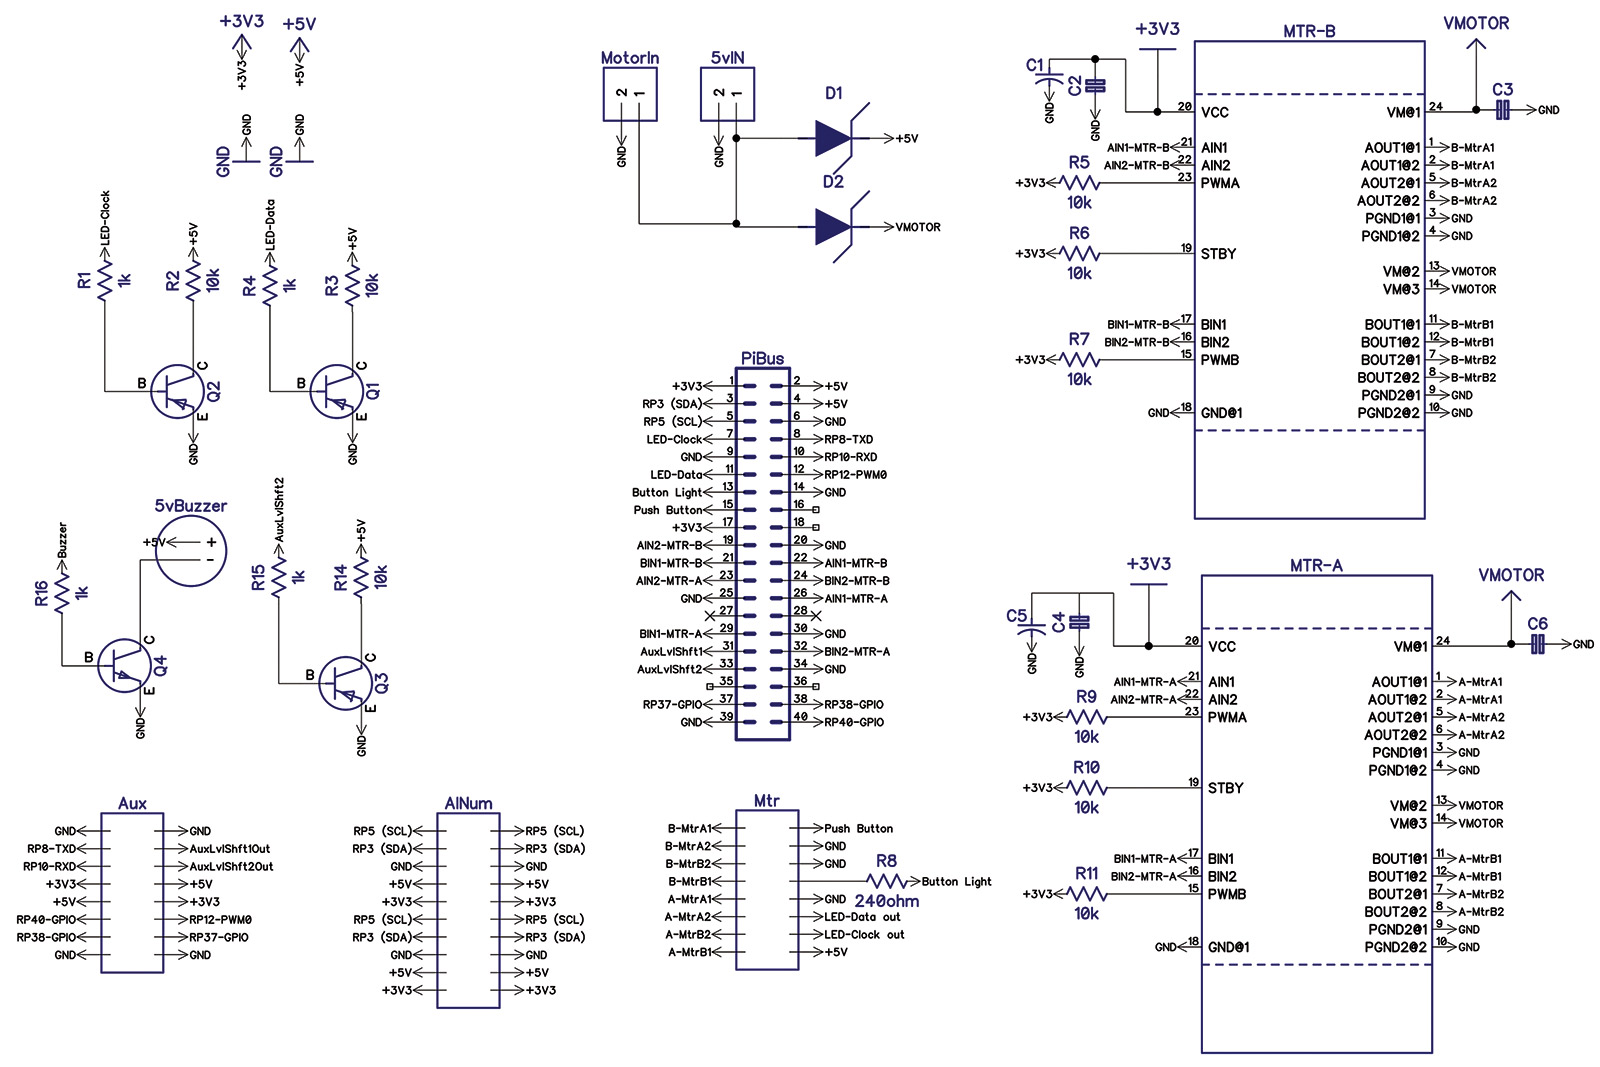
FIGURE 7. Weather gauge RG-2MtrDrvr daughterboard schematic.
As you can see, there are not a lot of components; only two ICs MTR-A and MTR-B — both Toshiba TB6612FNG H-bridge motor drives. Only one is used in this project. However, the RG- 2MtrDrvr board does break out the various interfaces into headers that can directly connect to their components with straight through cables (see the bottom of Figure 8). This helps make the installation manageable.
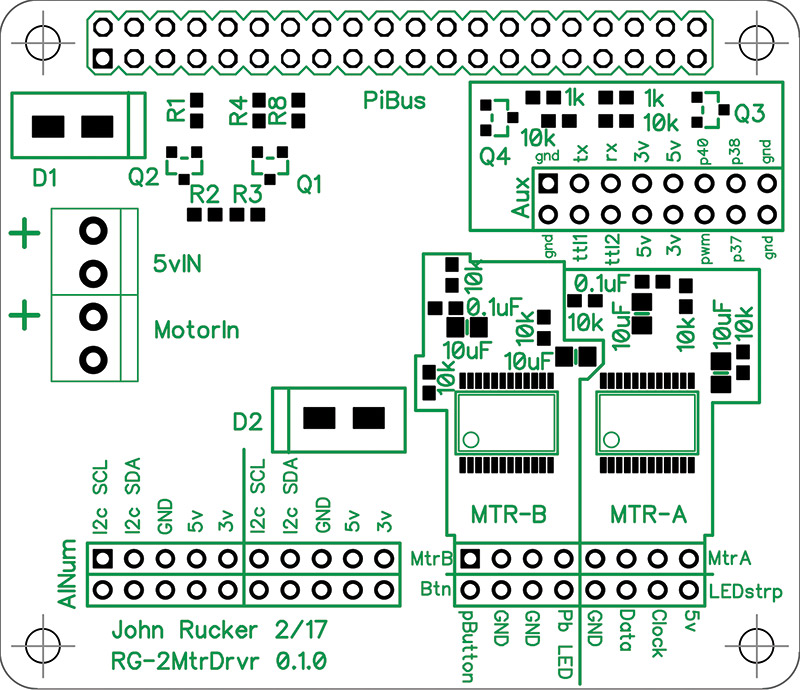
FIGURE 8. Weather gauge RG-2MtrDrvr daughterboard PCB layout.
A 5V power source connects to the 5VIN screw terminal on the left side of the RG-2MtrDrvr PCB. This power source drives both the RaspPi and the motor circuits. A trace on the bottom of the PCB can be cut, and a second power source connected to the MotorIn terminal if using a higher torque stepper motor.
The two diodes, D1 and D2, provide bias protection and isolate the motor noise from feeding back through the power bus. To round out the general overview, you will find a 5V piezo buzzer driven by Q4 in the top right of the PCB (Figure 8). Let’s now go a little deeper into the core components.
LED Strip Circuit Detail
At the bottom of Figure 9, you see the DotStar LED strip connected to a flat ribbon cable.
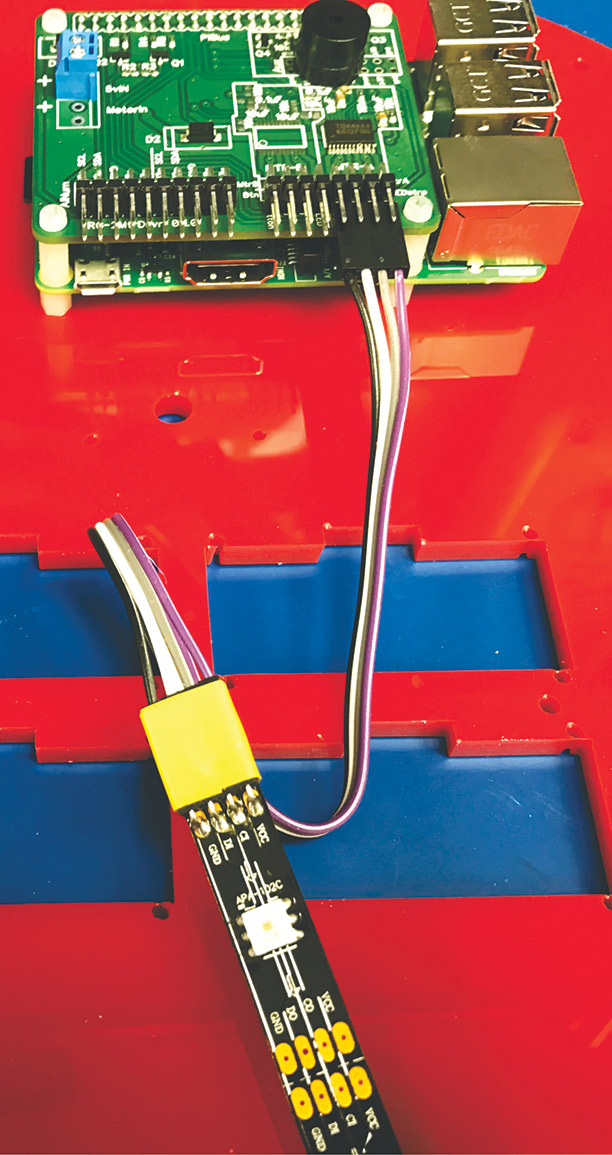
FIGURE 9. LED strip.
This cable plugs into a header labeled “LEDstrp” on the lower right side of the RG-2MtrDrvr as shown in Figure 10.
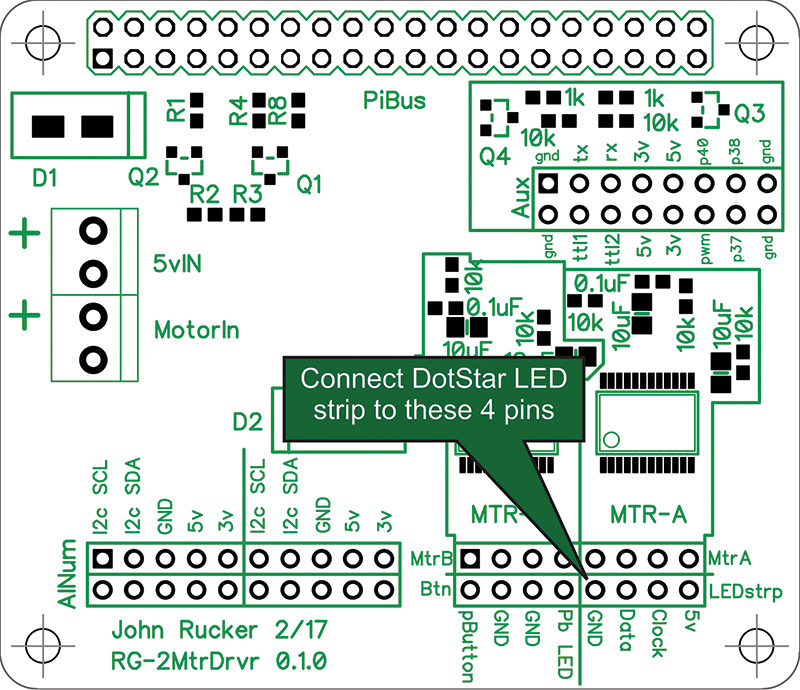
FIGURE 10. LED strip connection.
Adafruit’s DotStar LEDs are 5050-sized LEDs from Shiji Lighting, model APA102C. The LEDs are on a flexible PCB (LED strip) that are driven with 5V. A two-wire SPI interface allows you to send color and brightness commands to each LED in the strip. That’s an easy task to bit bang through software on the Pi.
Two transistors — Q1 and Q2, highlighted in the upper left of Figure 11 — level shift the Pi’s 3.3V up to 5V for the clock and data signals.
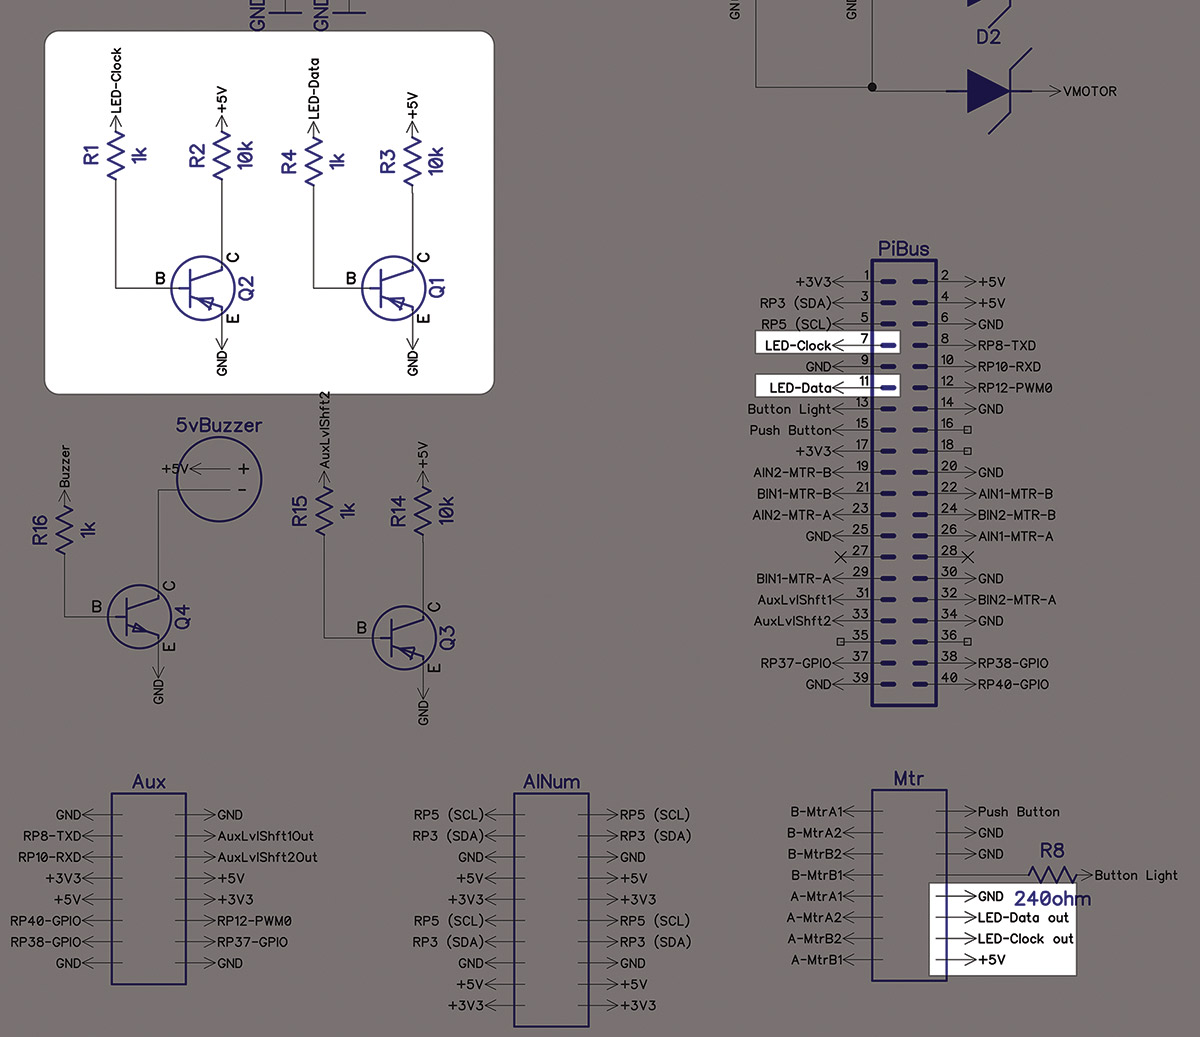
FIGURE 11. LED strip schematic.
You’ll find an RG-LEDstrip Node.js driver in the downloads and/or at https://github.com/RuckerGauge/RG-LEDstrip. This driver is a Node.js class that provides methods for sending commands to the LED strip. For example, the command:
LEDST1.SETALL(10,20,0,0);
sets all the LEDs in the strip to a dim red color. The GitHub site for this driver shows you how to include the driver into your code and has a “testMe.js” application that will test all the methods in the class (this is included in the article downloads as well). The testMe.js app is a useful resource for understanding how your program should make calls to this driver. You’ll find a testMe.js for all the drivers in this project. In fact, testing is standard practice for writing Node.js modules. You’re expected to include a test process and document how to use it.
Quad Alphanumeric Display Circuit Detail
The alphanumeric displays are directly connected to the RaspPi’s I2C bus (pins 3 and 5). Take a look at Figures 12, 13, and 14.
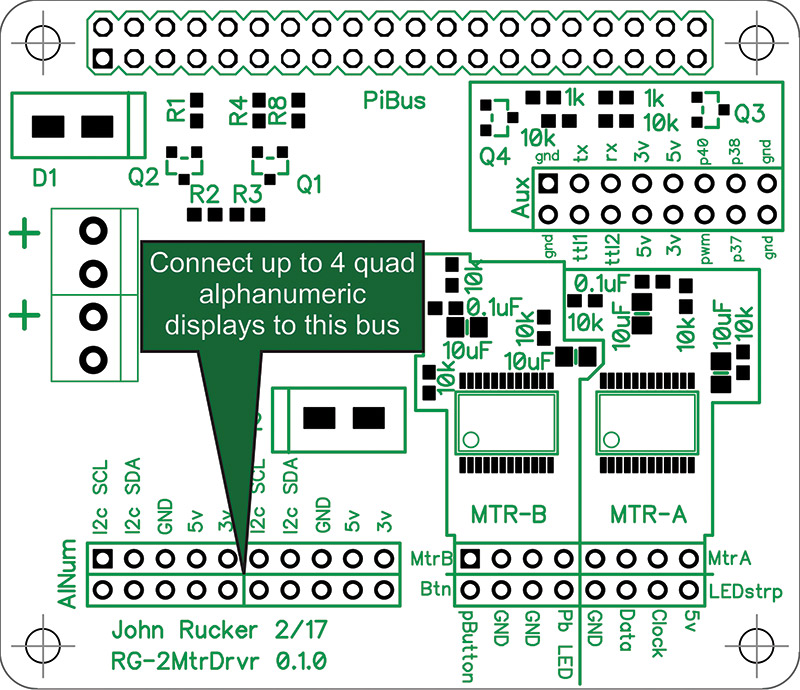
FIGURE 12. Alphanumeric bus.
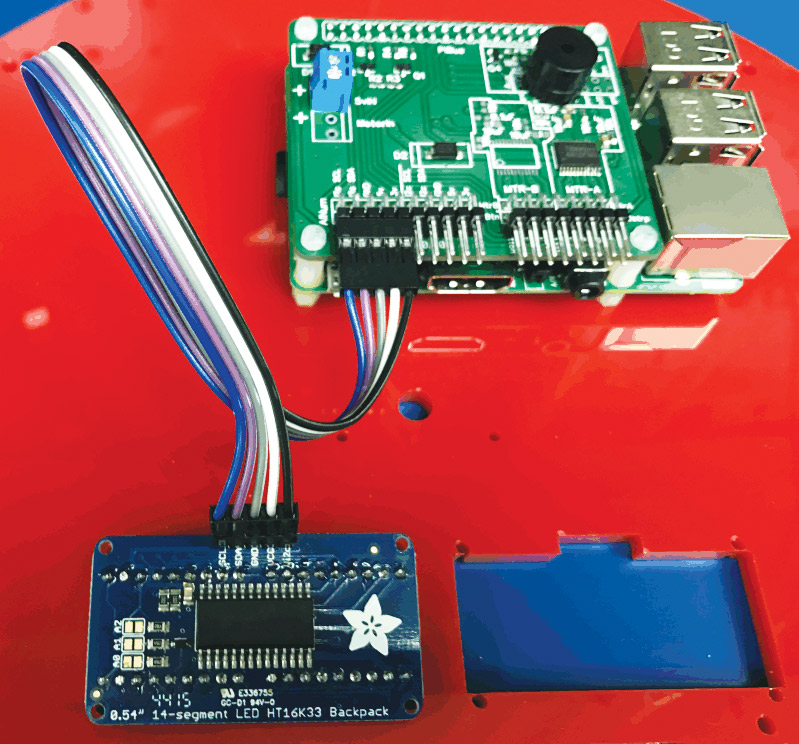
FIGURE 13. Alphanumeric display connection.
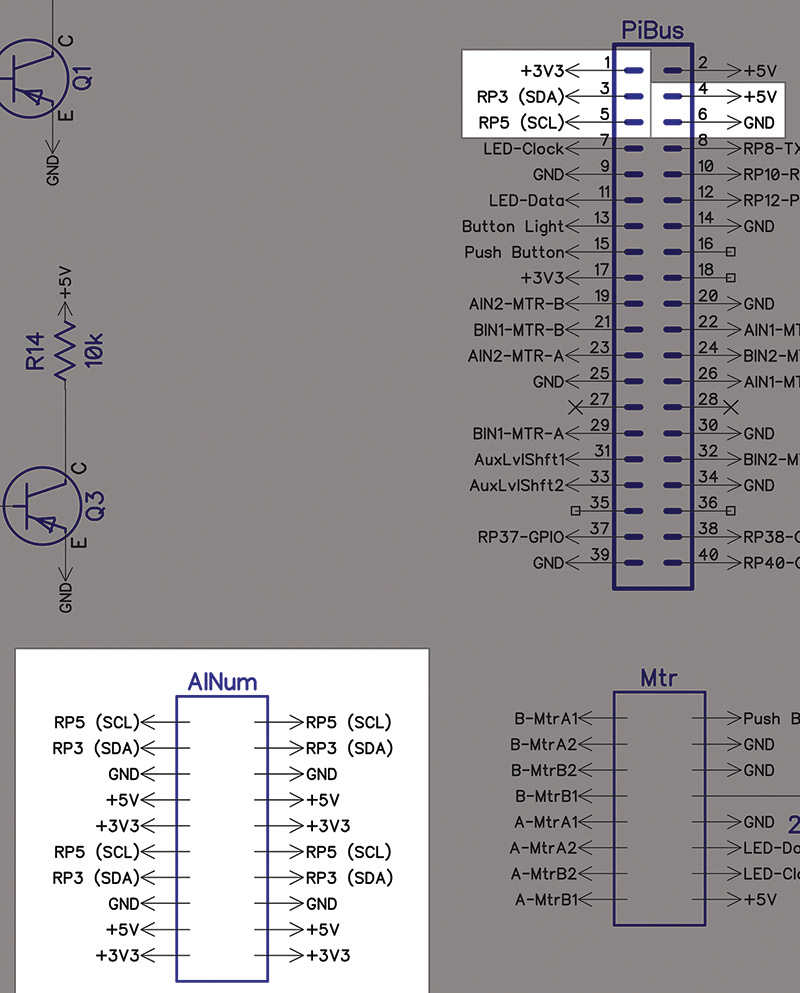
FIGURE 14. Alphanumeric display circuit.
This is a straightforward connection to the I2C bus of each alphanumeric display. No additional components are required. However, I’m not using a bus configuration for the I2C communications. I’m using a star configuration to connect each of the four quad alphanumeric displays. This allows me to use straight-through ribbon cables to connect each display.
Since the cable runs are short and the I2C clock rate is only 1 kHz, the propagation delay should not be a problem. I know this is not ideal, but the benefits of using a center point of connection outweigh the extra work of making a custom cable to connect all the displays together in a bus.
Also included in the article downloads is an alphanumeric hardware driver. The driver is designed to drive one to four quad alphanumeric displays. On the back of each alphanumeric display is an address bus (solder bridge) that allows you to select a unique address for each display.
My driver expects the address to be in a range of 0x70 to 0x73 (decimal 112 to 115). This driver allows you to send text and numbers to each display by passing a string to a method. It also can print a sentence across several of the displays as a ticker. For example, this command:
ALPHNUM1.TICKERPRINT8(‘THIS SENTENCE WILL SCROLL ACROSS THE FIRST TWO BANKS.’);
will print the string “‘THIS SENTENCE WILL SCROLL ACROSS THE FIRST TWO BANKS’ one character at a time from right to left. The letters will appear to float across the eight characters of the first two quad alphanumeric displays.
Since these two quad displays sit side by side, it looks like an eight-character display, making it easy to read a long message. This is great for letting users know about weather alerts and displaying system messages during setup. These displays can be driven at 5V or 3.3V. I drive them at 5V, so they are visible and easy to read in a brightly lit room.
However, they are too bright for dark rooms. No worries, though, because the display’s brightness levels are controllable. The alphanumeric driver controls the brightness as well as the blink rate, just in case you want to blink them on and off to get attention.
Stepper Motor Circuit and Code Detail
The stepper is a small 5V bipolar automotive dashboard stepper connected to a needle in front of the custom gauge face. Refer to the schematic in Figure 15.

FIGURE 15. Stepper motor schematic.
Four I/O pins from the Pi are used to drive the TB6612FNG H-bridge motor driver. The TB6612FNG can drive up to a 15V stepper with an average current of 1.2A. However, in this configuration, we are driving it at 5V.
The same power source used to power the Pi is used to drive the stepper. If you wanted to drive a higher voltage stepper, you can cut the trace that connects the two power headers (labeled 5VIn and MotorIn; see the left side of Figure 16) and drive the two H-bridges with a separate power supply.
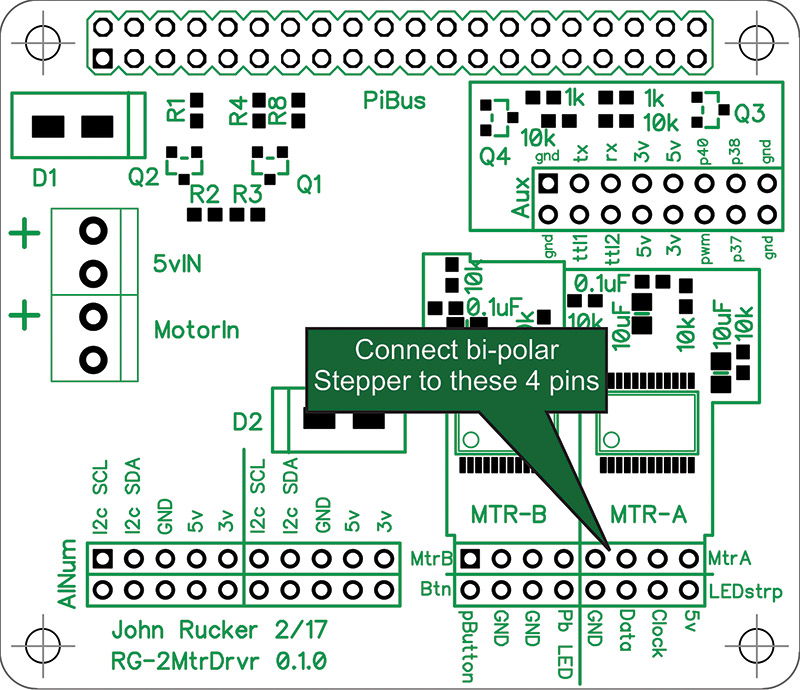
FIGURE 16. Stepper motor header.
If you have worked with the TB6612FNG motor driver before, you may have noticed I don’t use the PWM inputs and just pull them high with a 10K resistor. I did this to reduce the pin count, and I can easily get the resolution I need by using half stepping. Other than that, the TB6612FNGs are wired up close to the reference circuit in its datasheet.
The RG-2MtrDrvr daughterboard supports two TB6612FNC motor drivers but only one is populated on the PCB for this project. Refer again to the Figure 15 schematic of how the motor driver connects to the RaspPi. Notice it uses four general I/O pins that are directly connected to the Pi’s physical pins 23, 26, 29, and 32.
The TB6612FNC is a generic motor driver that can drive two DC motors or a single stepper. Refer to Figure 17.

FIGURE 17. Stepper connection.
That is why its input pins AIN1-AIN2 are paired up with the output pins AOUT1-AOUT2, and the same for the BIN-BOUT. The automotive “dashboard stepper” I’m using has a 600-step resolution over 315 degrees of rotation. It has built-in stops that keep it from spinning a full 360 degrees. The gauge face also has a stop (needle strike) at the zero point for the stepper’s needle to bump against and find the home position.
A stepper driver is posted at https://github.com/RuckerGauge/RG-Stepper and in the downloads for this stepper circuit. This driver is a Node.js class so you can initialize it and pass it the location of a custom configuration file (calibration.json) that lets you tailor the driver to your gauge face. This allows you to use the same code base for multiple projects; you just need a unique calibration.json file for each gauge. All other code will remain the same!
Code Alert
I think it’s time to dig a little deeper into the code. The process I followed when putting together the RG-Stepper driver makes a good place to start.
The first thing I did was document how a bipolar stepper works. Figure 18 shows the polarity of the coils for each of the eight steps a bipolar stepper follows when using half steps. The half steps occur when one of the two coils are turned off; steps 2, 4, 6, and 8 are half steps. A drawback to using half steps is the torque of the stepper is reduced as only one coil is energized.
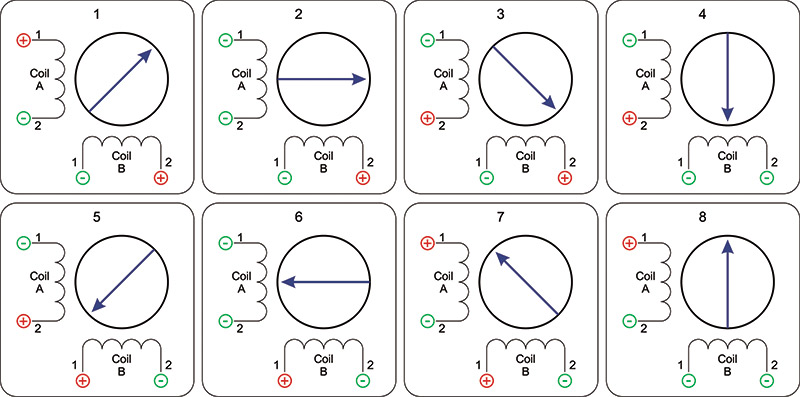
FIGURE 18. Half step sequence for a bipolar stepper (from Thomas Hopkins’ AN235 app note).
I should give a plug to Thomas Hopkins’ AN235 app note from www.st.com. He does an excellent job of explaining how you can increase the current of the energized coil to compensate for the half step torque reduction. The half step torque reduction is not an issue for this project since we’re only driving the gauge’s needle with our automotive dashboard stepper, so I didn’t need to compensate for it. With half stepping, we now have 1,200 steps to represent 315 degrees of movement. This gives us good resolution, so you shouldn’t have a problem lining up the gauge’s needle with a value on the gauge face.
Next, I mapped out each of the eight steps in a table (see the Coil A and Coil B columns of Figure 19) so I could get an understanding of what the logic would look like for each step in the sequence. Using the TB6612FNC datasheet, I came up with the logic for the four Pi pins (26, 23, 29, 32) that drive the TB6612FNC; see columns AIN and BIN.
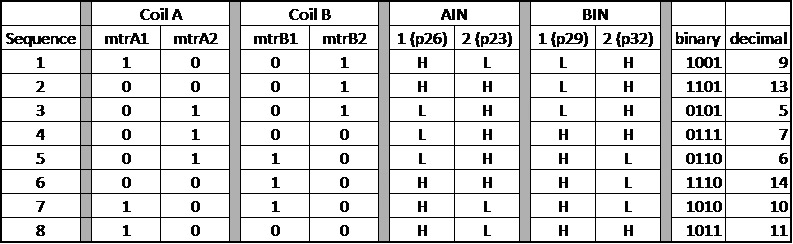
FIGURE 19. Half step logic table.
I would like to point out with the PWM input pins pulled high, the TB6612FNC requires both the AIN1 and AIN2 pins to be high to sink the output pins. I do this for each half step, turning the coil off by grounding both inputs. That’s why you see two highs in the AIN and BIN columns for the half steps.
With my pin states identified, I then mapped the highs and lows for AIN and BIN pins to a binary representation (refer to the binary column). Finally, I converted the binary values to their decimal equivalent, and I had my stepper sequence (9, 13, 5, 7, 6, 14, 10, 11). This sequence would be repeated over and over to rotate the stepper clockwise. The faster you send the sequence, the faster the stepper rotates. To rotate the stepper counterclockwise, reverse the sequence (11, 10, 14, 6, 7, 5, 13, 9).
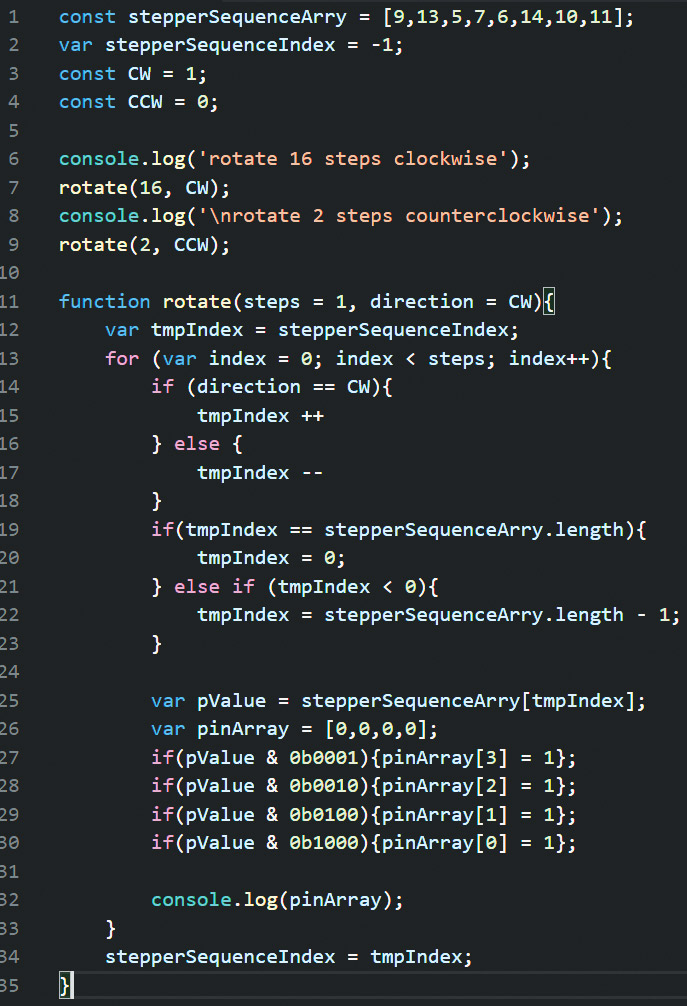
FIGURE 20. Node.js sample stepper sequence app.
Now with the stepper sequence identified, I wrote a small 25-line Node.js app (see Figure 20) to walk through the steps in the sequence and print it to the screen in binary format (see Figure 21).
rotate 16 steps clockwise
[1, 0, 0, 1]
[1, 1, 0, 1]
[0, 1, 0, 1]
[0, 1, 1, 1]
[0, 1, 1, 0]
[1, 1, 1, 0]
[1, 0, 1, 0]
[1, 0, 1, 1]
[1, 0, 0, 1]
[1, 1, 0, 1]
[0, 1, 0, 1]
[0, 1, 1, 1]
[0, 1, 1, 0]
[1, 1, 1, 0]
[1, 0, 1, 0]
[1, 0, 1, 1]
rotate 2 steps counterclockwise
[1, 0, 1, 0]
[1, 1, 1, 0]
FIGURE 21. Output from stepper sequence app.
I placed the sequence (9, 13, 5, 7, 6, 14, 10, 11) in an array called stepperSequencArry. I then created a global variable to keep track of the last step number so my app could keep track of where it is in the step sequence. The test run issues two calls (see line 7 and line 9 of Figure 20) to the rotate function, rotating clockwise 16 steps:
rotate (16, CW);
and then counterclockwise two steps:
rotate (2, CCW);
The output in Figure 21 matches the binary column in Figure 19, telling me my code is a good representation of my logic.
The next step is to control my RaspPi’s pins with this same logic. To do that, I need to control the Pi’s general I/O pins 23, 26, 29, and 32. Since I can’t natively control the Pi’s I/O pins with Node.js, I added a module called node-rpio to my project. Node-rpio was written by Jonathan Perkin from the UK and is published under the open source ISC License. Jon did a fantastic job with this node module. It is rock solid and well documented on his GitHub site at https://github.com/jperkin/node-rpio.
Look at Figure 22, lines 42 through 45; you’ll notice they look very similar to Figure 20, lines 27 through 30. In line 42 of Figure 22, you can see how I’m using the rpio module to set the pin assigned to the AIN1 variable (26) high or low based on the logic of the “if” statement.
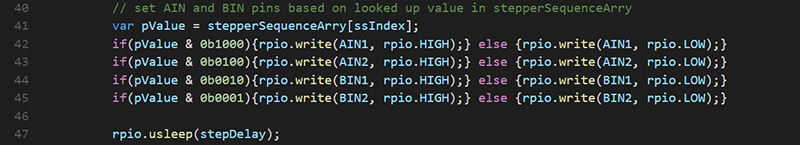
FIGURE 22. Controlling I/O pins with Jonathan Perkin’s node-rpio module.
The code in Figure 22 is a subset of the stepperDriver.js, available in the downloads and at https://github.com/RuckerGauge/RG-Stepper/blob/master/stepperDriver.js. If you’re interested in more, I suggest you go through the testMe.js included in the downloads. My GitHub site shows you how to install it with Node package manager and incorporate it into your project.
That’s all folks ... for now.
In the next article, we’ll assemble all these components onto a custom acrylic base, set up the Raspberry Pi’s operating system, and install our code. We will then connect to the custom gauge’s Wi-Fi network with the browser in our smartphone, and run through the setup and control menus. Finally, I will close with some security suggestions and considerations for your Pi. NV
Parts List
| QTY |
PART # |
MANUFACTURER |
DESCRIPTION |
| 1 |
2237 |
Adafruit |
DotStar digital LED strip |
| 1 |
2424 |
Adafruit |
Automotive gauge stepper |
| 1 |
2448 |
Adafruit |
TB6612FNG 1.2A DC/stepper motor driver board |
| 3 |
2157 |
Adafruit |
Quad alphanumeric display — white 0.54" digits w/ I2C backpack |
| 1 |
1479 |
Adafruit |
16 mm illuminated pushbutton — white momentary |
| 1 |
400 |
Adafruit |
Wire housing pack |
| 2 |
2N3906-AP |
Mouser |
2N3906 transistors |
| 2 |
CF1/4CT52R202J |
Mouser |
2K resistors |
| 2 |
CF1/4CT52R102J |
Mouser |
1K resistors |
| 1 |
CF1/4CT52R221J |
Mouser |
220 ohm resistor |
| 1 |
276 |
Adafruit |
Five volt/two amp power with 2.1 mm ID positive tip connector |
| 1 |
610 |
Adafruit |
Panel mount 2.1 mm DC barrel jack |
| 1 |
SB340-T |
Mouser |
3A Schottky diodes |
| 1 |
2243 |
Adafruit |
GPIO header for Raspberry Pi HAT - 2x20 short female header |
| 1 |
39357-0002 |
Mouser |
3.5 mm screw-terminal block |
| 1 |
3055 |
Adafruit |
Raspberry Pi 3 Model B |
| 1 |
2693 |
Adafruit |
ScanDisk 16 GB Ultra Micro SDHC Class 10 card |
| 1 |
400 |
Adafruit |
Extra long strip headers |
Downloads
What’s in the zip?
Driver and code files for the Custom Weather Gauge