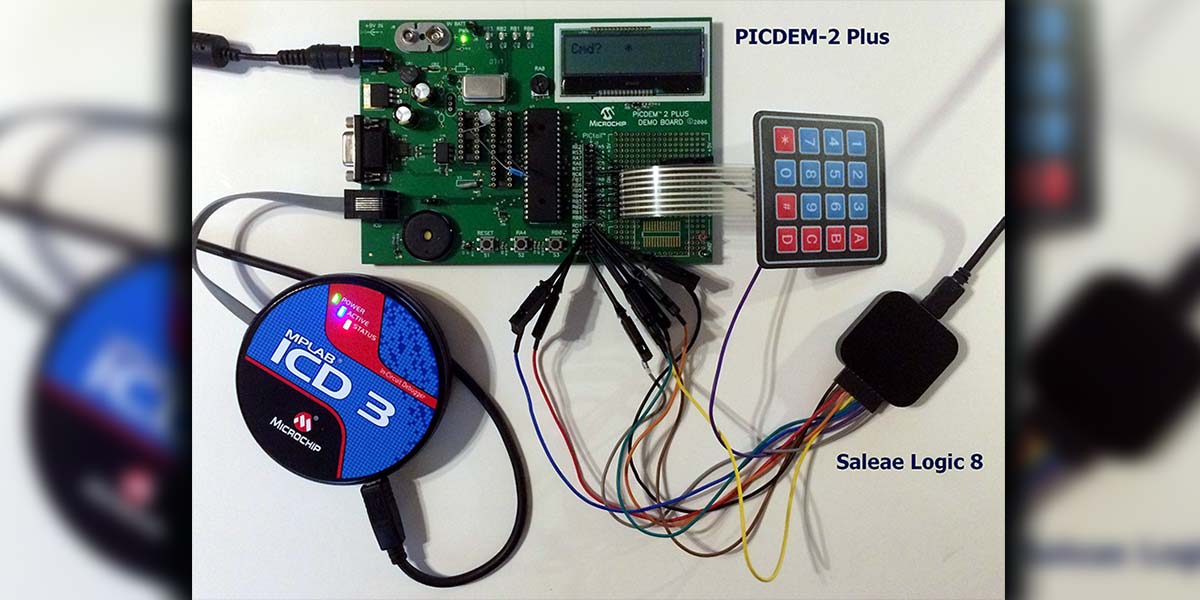
I work with a broad spectrum of low- and mid-range PIC microcontrollers using MPLAB/X and a Microchip ICD2/3 debugger/programmer as shown in Figure 1 above. (Figure 1 - PICDem 2P DevBoard with ICD3 and Saleae Logic 8 Analyzer.) There are many other programming/debugging setups around, but this suite works quite well. My programming technique uses assembly code if space or performance is at a premium or Hi-Tech C (now part of Microchip) if not. This Manchester debugging technique can be implemented in any language, but I will start with C for its structural clarity.
Many of the low- to mid-range PICs have little or no internal debugging capability. Some (with no internal support) have low cost debug headers available from Microchip that replace the target device during development. Others have internal support along with re-writable program memory to support the ICD3 debug executive. In either case, these PIC devices generally have one hardware and one software breakpoint (BP). The hardware BP is always used by the ICD3 executive, leaving one measly BP for your debugging.
Once one BP is set in your code, you have single-stepping control only, and you lose the ability to step into or over functions/procedures/calls, etc. This means that navigating your code in a controlled manner while observing internal registers, values, and/or I/O behavior can be quite a challenge! It’s infuriating to single-step through some problem code only to step into a function call that throws all your monitored values out-of-scope. You can’t easily get back, and there is likely many cycles ahead before the function returns.
Certainly you can run a simulator like MPSIM and get quite detailed debugging control, but if your system interfaces with the real world, you are going to have to simulate real world peripherals and timing events that can be hard to develop and operate. You can also use oscilloscopes and logic analyzers, but to do so you must have access to the event you are studying.
Enhancing Your Debugger
Oftentimes, the purpose of a debug BP is to stop the processor to examine the internal and external machine state in hopes of understanding where a bug is hiding. You then step around your code observing system behavior. When you can’t do this due to resource limitations or event timing, you can often get what you want by leaking it out on an unused pin or on a used pin between I/O operations.
Think of this technique as a probe that can poke around inside the processor at a time and place of your choosing. Of course, this technique will not magically add breakpoint control to your debugger, but it will allow you access to internal state and register values on-the-fly to augment the limited BP features.
The Logic Analyzer
There was a time when a logic analyzer cost thousands of dollars and was as big as a suitcase. With the advent of low cost field-programmable gate arrays (FPGAs) that has all changed.
There are many USB connected eight- and 16-bit pocket sized analyzers in the marketplace now, and they can be acquired for ~$100 and up including the interface software.
I have several Saleae logic units that work very well, like the eight-bit version in Figure 1. Being basic, they are not isolated, and the ground is referenced to the computer. Use a heavy dose of caution before you combine these with anything involving AC or high voltage. You have been warned!
The computer side software is very well done and quite flexible. The best feature of these units is that — in addition to the logic display — they are packed with two dozen protocol analyzers that interpret the data and overlay it on the logic display. You can select analyzers that aggregate pin traces for parallel / I2C / SPI / JTAG / DMX protocols and many others if that is what you’re working with.
We want to keep it simple and use a one-bit protocol. Enter the Manchester (a.k.a., phase code) code. Originally used more than 60 years ago as a self-clocking code on drum memory storage systems, it is still used today in places like Ethernet and RFID. It has some good features such as no DC component and self-clocking, and some bad features like inefficient coding, but we don’t really care about any of that.
The Manchester code is a perfect choice for this project as the decoder is already implemented in the logic analyzer (hard) and the encoder is trivial to embed in your code. It’s a one-bit serial protocol extensible to any length. Transitions for 1 and 0 are created at the mid-point of a bit cell, and if needed, at a bit cell boundary.
Figure 2 graphically shows the serial data encoding process, compliments of Wikipedia.
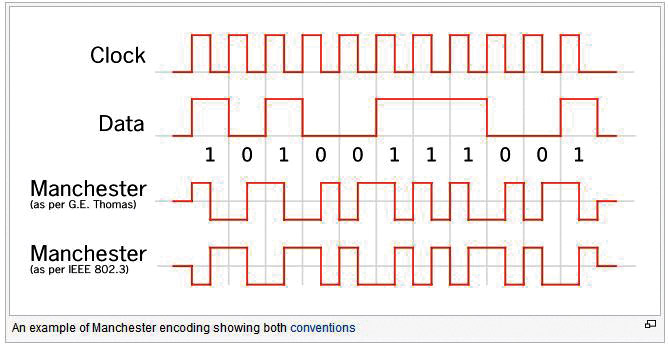
FIGURE 2. Manchester bit encoding.
Figure 3 shows the Options menu for the Saleae Manchester decoder. Every parameter is easily configured, including bit time, 1/0 transition direction, word size, mark/space levels, etc. You simply pick the trace, set the bit rate, direction, size, and you are done.
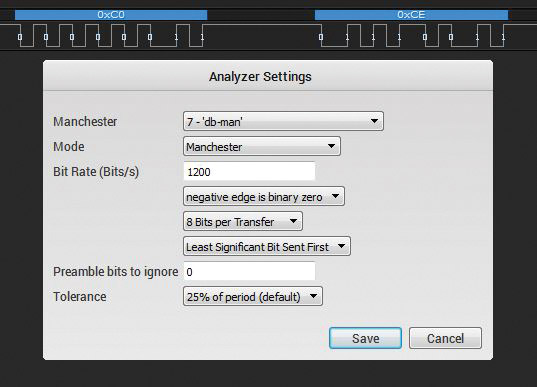
FIGURE 3. Saleae Manchester decoder options.
The Encoder Code
Code Block 1 is a C function call that receives a byte of data and a parameter indicating the number of bits to send. Again, it’s written in Hi-Tech C, but easily adapted to other compilers. The operation is easy to follow as the function simply marks to a 1 (to help the decoder), then formats a bit-cell based on the LSB of the test byte, which is then right-shifted in the for loop. Another mark to 1 ends the transmission. The comments within Code Block 1 provide further explanation.
Code Block 1
#define HBitTime 400
//half the bit time in microseconds
#define DB_Bit RC3
//out serial output bit
void dbyte2man(unsigned char inbyte,unsigned char BitsToSend)
{
unsigned char i;
DB_Bit = 1; //mark 1
__delay_ms(HBitTime*2);
for(i=1;i<=BitsToSend;i++)
//sending LSB first
{
if(inbyte & 0x01)
//position 1 for rising
{
DB_Bit = 0;
__delay_us(HBitTime);
DB_Bit = 1;
__delay_us(HBitTime);
}
else
{
DB_Bit = 1;
//position 0 for falling
__delay_us(HBitTime);
DB_Bit = 0;
__delay_us(HBitTime);
}
inbyte = inbyte>>1;
}
DB_Bit = 1; //mark 1
__delay_ms(HBitTime*2);
}
Embed this function in your code and call it anywhere you want to pass the internal value of a byte to the outside world. If you need to send more than eight bits, just change the data-type in the function definition to int, short long, long as needed, and adjust the BitsToSend parameter.
A Quick and Simple Example
I had a project that needed a character LCD and keypad interfaced to a PIC6F877A controller. It’s easiest to use a four-bit LCD interface as it fits an eight-bit port (seven total lines) and a scanned 4x4 matrix keypad on another eight-bit port. This worked well on both the development board (d_board) as shown in Figure 1, and the target hardware through the early design. However, I could only run the ICD3 debugger on the d_board because the target specifications required an RB[7:4] interface to the LCD.
RB[7:6] are the ICSP and debugger control pins, and are not available to the application during debugger operation. I could move these to another port on the d_board, but only the ICD3 programmer — not the debugger — would function on the target. Figure 4 shows a schematic of the basic interface between the PIC16F877A and the LCD character display. Note the four-bit data and three-bit control buses, as well as the standard PIC ICSP interface.
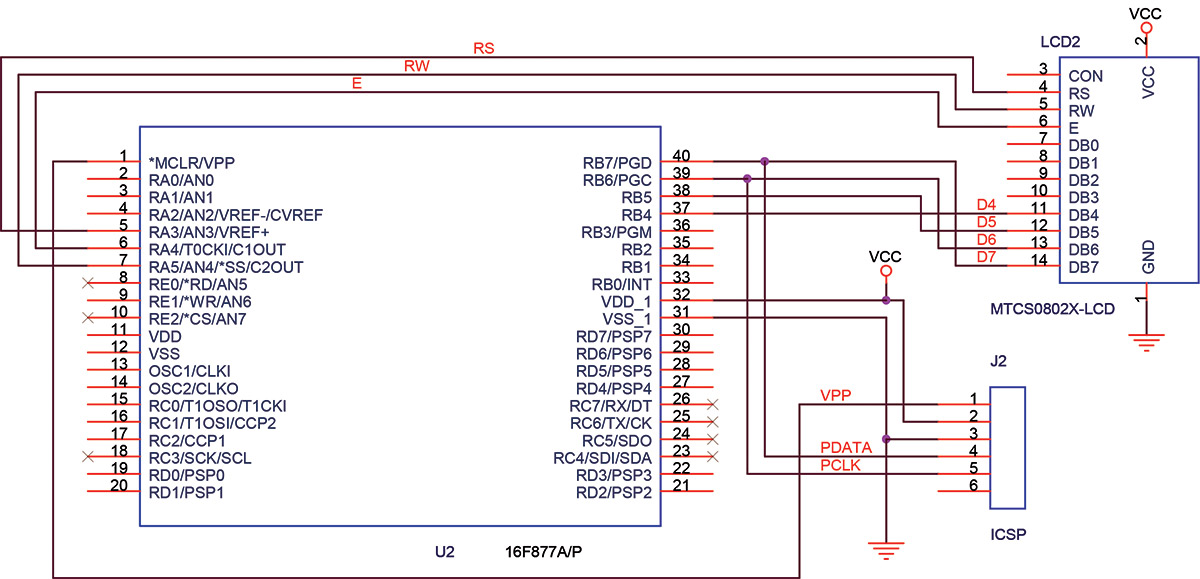
FIGURE 4. Basic target LCD interface schematic.
Having a target wired different from the d_board means some code switching, and physical juggling was required to evaluate code changes. In particular, up to a point I had only written to the LCD (very common). I now needed to read the current cursor position from the LCD which broke the target functionality, but worked correctly on the d_board. To be sure, reading the LCD is only slightly more difficult than writing.
On writes, you know what you sent from inside the PIC and can measure what got out onto the pins with a logic analyzer. On read operations, however, you need the debugger to see that the external pin values get inside the PIC correctly. Plus, in my case, I suspected this was not happening even though externally the pin values were correct, as any attempt to use the cursor position data failed.
Code Block 2 is a snippet of the LCD read_cursor_position code. Notice the four calls to dbyte2man (the third is for calibration, fourth redundant.) Since reading the LCD in four-bit mode is a two-step multiplex process, we first read the high four bits, then the low four bits, then concatenate the results. I placed a dbyte2man call after each port read to capture each half of the handshake transfer. The dbyte2man function then writes the Manchester coded data to spare pin RC3. Let’s now see what the logic analyzer shows.
Code Block 2
unsigned char lcd_getcpos()
// Get the current cursor position
{
unsigned char CursorPos;
RA3 = 0; //command registers (RS)
RA5 = 1; //read from display (R/W)
TRISB = (TRISB|0xF0);
//set port for input bits[7:4]
RA4 = 1; //clock 1 (E) sends LCD hi data out
__delay_ms(1);
CursorPos = (PORTB); //read high nibble
1> dbyte2man(CursorPos,8);
__delay_ms(1);
RA4 = 0; //clock 0
__delay_ms(1);
RA4 = 1; //clock 1 (E) sends LCD lo data out
__delay_ms(1);
CursorPos = (CursorPos & 0xF0) |((PORTB>>4) & 0x0F); //read low nibble and concat with hi nibble
2> dbyte2man(CursorPos,8);
__delay_ms(1);
RA4 = 0;
RA5 = 0;
TRISB = (TRISB&0x0F); //set port for output
3> dbyte2man(0x55,8);
__delay_ms(10);
4> dbyte2man(CursorPos,8);
return CursorPos | 0x80;
}
Figure 5 shows a segment of the LCD traffic at the moment of the cursor position read.
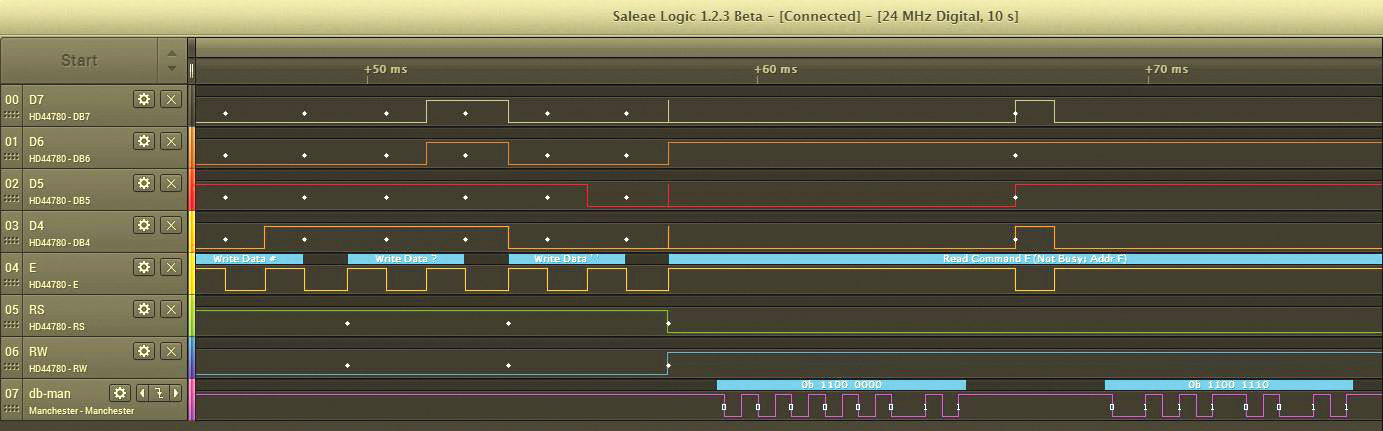
FIGURE 5. Saleae logic error region decoding.
The four data bits are labeled on the left along with the control signals for the LCD. I have used two Saleae protocol analyzers in this display. The Manchester data is by itself on the last line labeled db_man. The other analyzer is for the HD44780 LCD controller, whose Options panel is shown in Figure 5a.
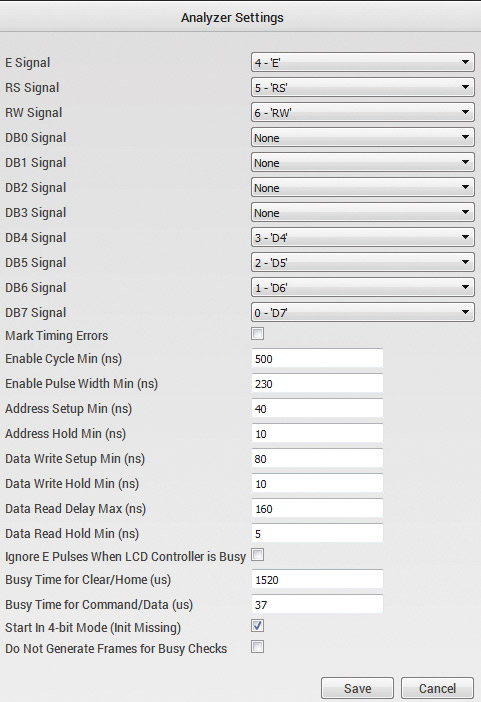
FIGURE 5A. Saleae HD44780 LCD decoder options.
Note that to use the analyzer, the signals are assigned in a four-bit multiplex manner with the decoder clock assigned to the LCD clock (E). Since the decoder understands the two-stage data transfer, it displays the decoded data in the band above a pair of (E) clocks.
Note that prior to the Manchester data showing up on db_man, the LCD is in write mode (RW=0) and the clock (E) is pumping characters to the display. You can see the HD44780 decoder displaying the ASCII sequence “= ? sp” — these characters are visible on the LCD display. Next, we try to read back the current cursor position from the LCD. So, RW=1 and E=1 clocks the LCD internal data onto the bus.
The dbyte2man function serially writes the CursorPos byte after each clock (E) transition. Note that the Manchester bits are sent LSB first, but decoded in the colored band as MSB...LSB. In particular, you will note that the first four bits in the logic analyzer D[7:4] are b0100 externally, but read as b1100 internally via the Manchester code. Similarly, the second four bits were externally b0110 but internally read as b1110, pointing to an interface problem with RB7 and possibly RB6.
Diagnosis
Now that I could confirm the PIC was indeed reading the pins incorrectly, I could look for a physical cause. It might have been internal or external, but turned out to be both! Using the ICD3 as a programmer on pins DB[7:6] while the pins also interface to other hardware can be tricky. Since the target was normally only writing to the LCD, and the LCD inputs are CMOS, two 4.7K resistors were installed in series with each line DB[7:6] between the PIC and LCD. This provided the in-circuit serial programming (ICSP) isolation needed by the ICD3 (the external part of the problem.)
The target and d_board necessarily used different ports for the LCD and keypad. Most PICs have a PORTB with programmable internal 50K pull-ups. The d_board used PORTB for the keypad, and turning on the internal pull-ups made the keypad termination trivial.
However, the target was using PORTB for the LCD and the pull-ups were still turned on. Figure 6 is the actual schematic of the target LCD interface.
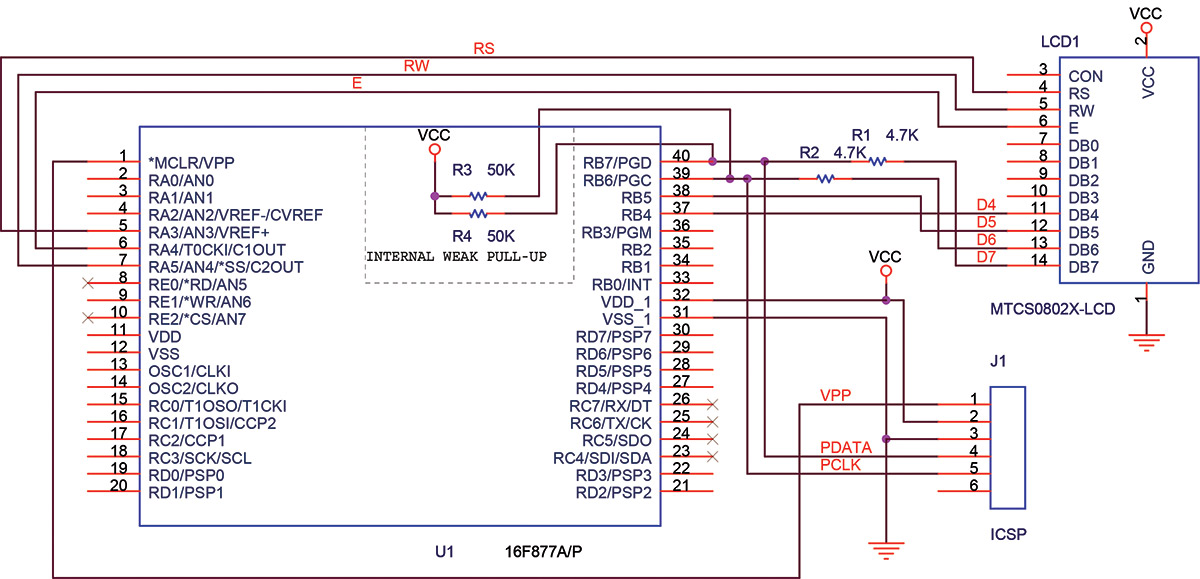
FIGURE 6. Actual target LCD interface schematic.
On inspection, you can see where this error in coding was leading, as the output pin of the LCD was now in a voltage divider. An LCD zero output was raised to

or well above the PIC VOL specification. After properly turning off the weak pull-ups in the target code, all worked fine!
You may think that I should have anticipated this problem, and maybe I should have. There are many gotchas that creep into designs as they evolve and these can wreak havoc on your intuition. The target was not originally designed to support ICSP, but retrofitting ICSP was convenient. In the process of adding the resistors to the printed circuit board (PCB), I neglected to add them to the schematic drawing!
One can stare at a drawing all day long trying to reason why a thing doesn’t work the way one’s mental image says it should. Fortunately, this Manchester probing method can kick you out of a false assumption and head you into a new and profitable direction.
Can This Work in Assembly Code?
It sure can, but the code is a bit more cryptic and requires more tweaking. Code Block 3 is a bit different from the Manchester C code and encodes MSB first, so the logic analyzer settings need to be different.
This module was designed to leak out the register counters in a capacitive touch panel design. Cap-touch sensors are very timing sensitive, and use multi-tone oscillators and counter arithmetic to calibrate and distinguish human interface events.
The cap-sense design used a PIC12F629 eight-pin device — not the PIC you would expect to have debugging resources. (There is a debug header for it though.) Leaking out the register timers during operation made all the difference in understanding and creating a robust interface.
A brief code description starts with the bit timing, which is set near the module bottom to 50 µs for a 4 MHz clock. The leaked Manchester code is on pin GPIO2. There is a function call for 16-bit data and eight-bit data. The eight-bit call marks a 1 for 100 µs then calls a one-bit or zero-bit function to serially output the byte. This is followed by another mark to a 1.
Again, marking helps in synchronizing the decoder. The 16-bit call processes the high byte followed by the low byte in a similar manner. With a bit of editing, this simple code can be adapted to just about any processor, not just low-end PICs.
Code Block 3
;*******************************************************
; *
; Filename: Manchester.asm *
; Date: 081616 *
; Author: Copyright 2002-2016 Kevin J O’Connor *
; Company: Hollywood Controls *
; *
; *
;*******************************************************
;
; SerBit16 takes whatever was loaded into 16 bit reg
; tmpTMR16 and encodes it into Manchester MSB first
; format.
;
;
#include <p12f629.inc>
; processor specific variable definitions
#include <CapBtn.inc>
Manch code
;
;Global/Extern
;
global SerBit16, SerBit8
extern tmpTMR16
;16 bit register pair containing
;word to convert to Manchester
extern tmpTMR8
;8 bit register containing
;word to convert to Manchester
extern cnt1, cnt2
;counters for timer
;
SerBit16
movlw .8 ;bit counter
movwf cnt1
movwf cnt2
bsf GPIO,2 ;mark
call dly50
call dly50
call dly50
s16H
btfsc tmpTMR16+1,7
;do high byte
call Manch1 ;out a 1
btfss tmpTMR16+1,7
call Manch0 ;out a 0
rlf tmpTMR16+1,F
decfsz cnt1,F
goto s16H
s16L
btfsc tmpTMR16,7
;do low byte
call Manch1 ;out a 1
btfss tmpTMR16,7
call Manch0 ;out a 0
rlf tmpTMR16,F
decfsz cnt2,F
goto s16L
bsf GPIO,2 ;mark
call dly50
call dly50
return
;
; SerBit8 takes whatever was loaded into 8 bit reg
; tmpTMR8 and encodes it into Manchester MSB first
; format.
;
SerBit8
movlw .8 ;bit counter
movwf cnt1
bsf GPIO,2 ;mark
call dly50
call dly50
sloop8
btfsc tmpTMR8,7 ;do byte
call Manch1 ;out a 1
btfss tmpTMR8,7
call Manch0 ;out a 0
rlf tmpTMR8,F
decfsz cnt1,F
goto sloop8
bsf GPIO,2 ;mark
call dly50
call dly50
return
Manch1 ;make a 1’s bit cell
bsf GPIO,2
call dly50
bcf GPIO,2
call dly50
return
Manch0 ;make a 0’s bit cell
bcf GPIO,2
call dly50
bsf GPIO,2
call dly50
return
;
;Manchester 1/2 bit timing loop for 50us @ 4MHz clock
;
dly50
movlw D’15’
movwf CounterA
tloop
decfsz CounterA,1
goto tloop
retlw 0
END
In Code Block 4, I have shown just the rudimentary outline of how you might use the assembly code version in a more complete program. (I’m assuming a PIC12F629 again.) In this code, I have allocated and initialized the Manchester registers, as well as provided the module references. The remaining code transfers the PIC status and program counter registers to the Manchester registers and repeatedly streams them out on port GPIO2.
Code Block 4
;
;Code snippet showing typical usage of Manchester ASM function call
;
tmpTMR8 res 1
;reserve some byte registers
rega res 1
tmpTMR16 res 2
;reserve a double byte register
extern SerBit16, SerBit8
;reference the Manchester functions
global tmpTMR8, tmpTMR16
maincode code 0x100
;start main code at 0x100
main
clrf rega ;clear the registers
clrf tmpTMR8
clrf tmpTMR16
clrf tmpTMR16+1
TRIS b’11011’
;set bit for Manchester code to output
movf STATUS,W ;get PIC status register
movwf tmpTMR8 ;save it
movf PCL,W ;get low program counter
movwf tmpTMR16 ;save in lo byte
movf PCLATH,W ;get hi program counter
movwf tmpTMR16+1
;save in hi byte
;
call SerBit8
;leak out the PIN STATUS register value
call SerBit16
;leak out the 12 bit program counter
;
goto main
END
Caveats
This article contains only the code snippets necessary to illustrate the debugging techniques herein. I have anticipated that you are skilled in writing code with Hi Tech C or with the MC macro-assembler. If not, there are many wonderful tutorials on the Web that will bring you to a satisfactory proficiency for this debugging technique in a matter of days.
A good place to start or get a refresher is from the folks at Gooligum Electronics (www.gooligum.com.au). Some stuff is free and most is nominally priced. Their PIC introduction PDF can be acquired at https://github.com/gooligumelec/PIC-tutorials.
Conclusion
Debugging microcontroller designs can be difficult due to resource limitations that block or curtail access to real time information internally and externally.
Diagnostic tools such as scopes and logic analyzers have evolved greatly, and have become much more affordable than only a few years ago. Protocol analyzer plug-ins make complex bus transactions easier to diagnose.
I have demonstrated both a multiplexed bus protocol analyzer (HD44780) and the 1-Wire Manchester decoder. Combining these logic analyzer decoders with an embedded software Manchester encoder forms yet another tool to enhance your debugging and diagnostic skills. NV
Resources
Microchip Stuff:
MPLab-X
www.microchip.com/mplab/mplab-x-ide
MPLab IDE
http://ww1.microchip.com/downloads/en/DeviceDoc/MPLAB_IDE_8_92.zip
ICD3 Programmer/Debugger:
www.microchip.com/Developmenttools/ProductDetails.aspx?PartNO=DV164035
Saleae Logic:
https://www.saleae.com