For years, I’ve had a Davis weather station and enjoyed tracking the wind — especially the sudden gusts that rattle the windows. However, the tiny plot on the station’s LCD screen is not very resolved and I wanted it to be better ... a whole lot better. The solution: a Raspberry Pi!
The Big Picture
I was gassed when I realized that a Raspberry Pi (RPi) could run a plotting program like “Gnuplot” and generate spiffy real time plots of wind speed on one of the small LCD displays from Adafruit (refer to Figure 1). The best part was customizing the display to look just the way I wanted it to.
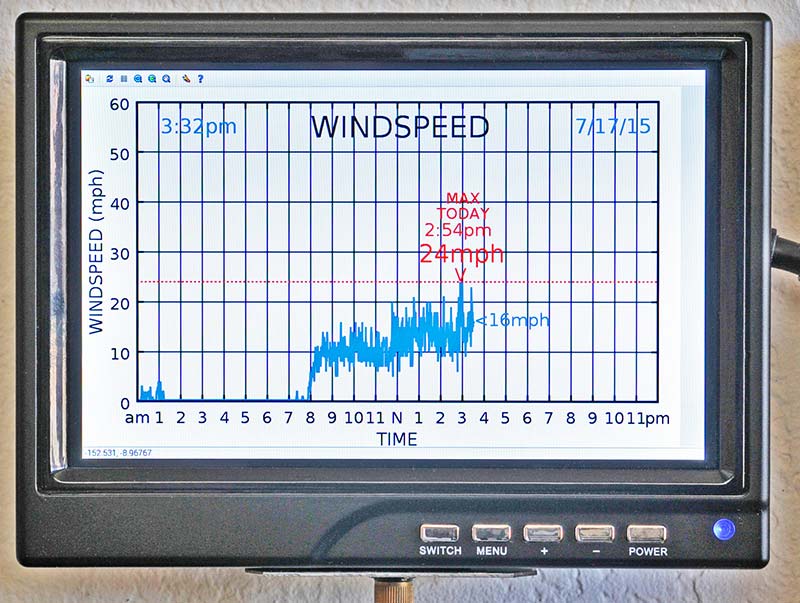
FIGURE 1. The Adafruit seven inch 1280 x 800 LCD plots the max wind speed at one minute intervals, 1,440 times a day.
The seven inch 1280 x 800 display looks great on my wall. The colors are vibrant and the resolution is more than I could hope for. During operation, the RPi updates the peak wind speed once per minute, 1,440 times a day, 24/7, and resets at midnight. It’s fun to watch the peaks climb higher and higher, as I wonder if the house is going to blow away.
The schematic diagram of the project is shown in Figure 2. I realize that some of the functions could be combined to reduce the parts count, but I already had most of them in my stock so I shoved them all into a box and started programming.
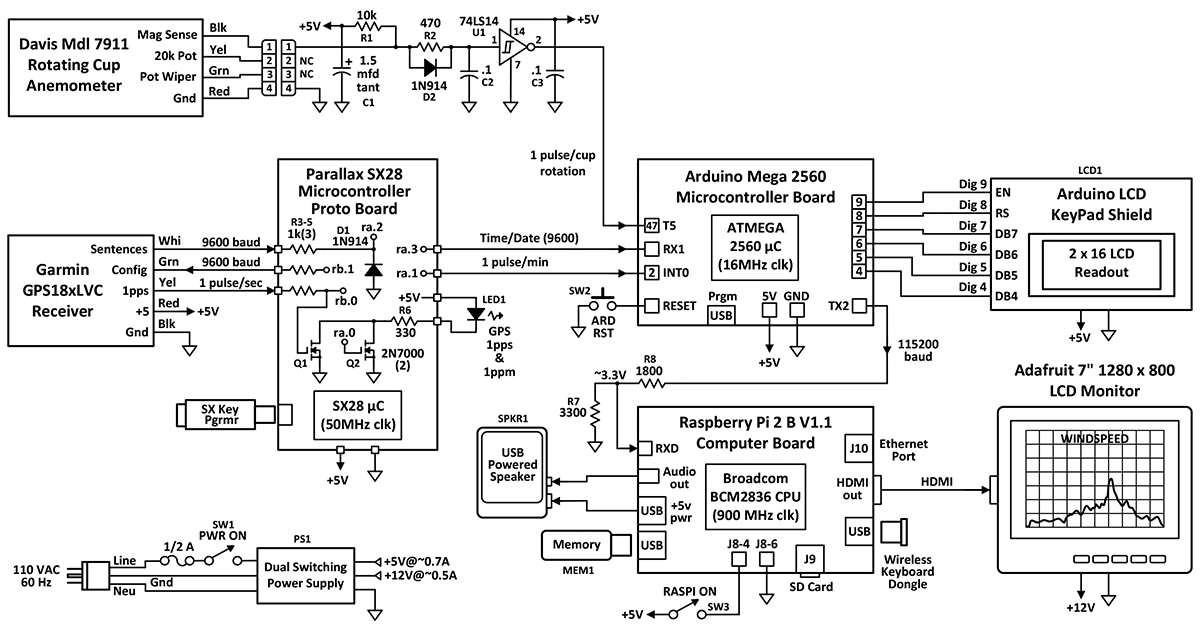
FIGURE 2. An Arduino Mega 2560 is the heart of the system and coordinates all the functions.
Figures 3 and 4 show the box mounted under my desk.
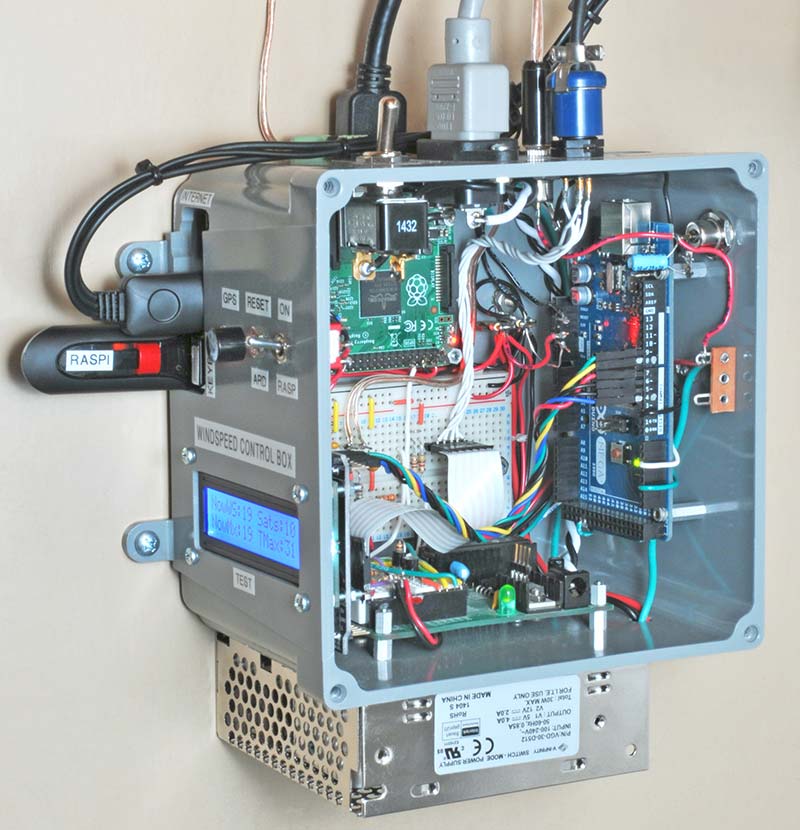
FIGURE 3. The control box contains three processors: a Parallax SX28, Arduino Mega 2560, and Raspberry Pi 2.
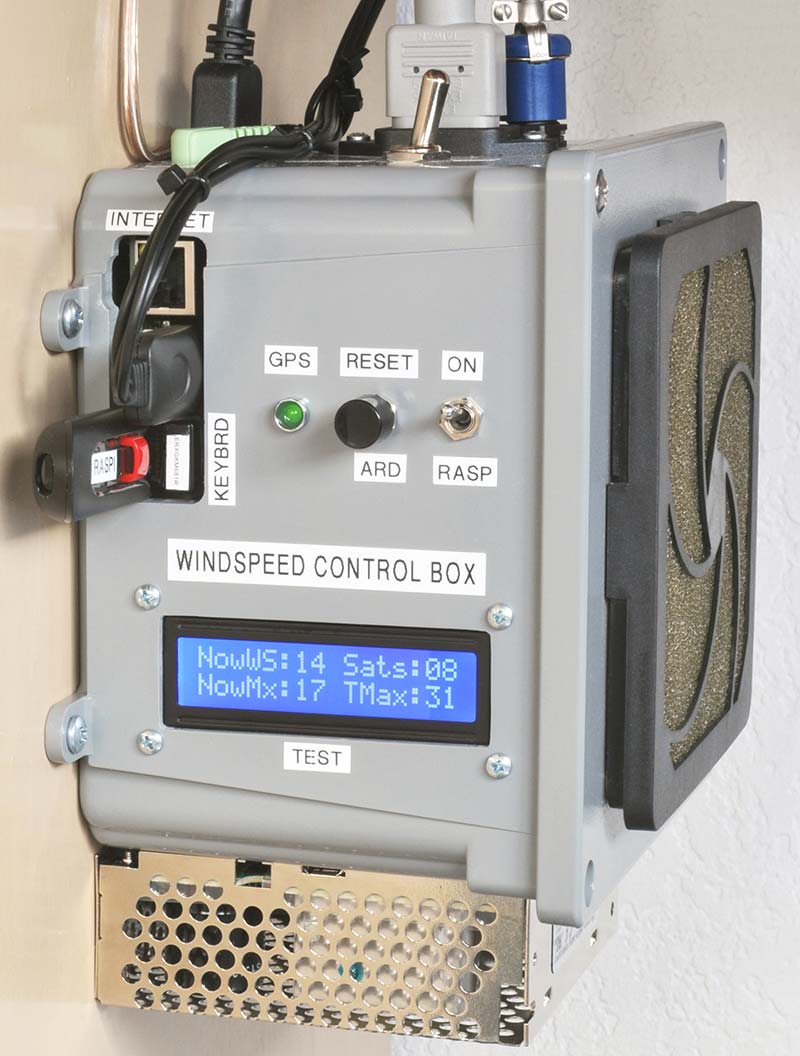
FIGURE 4. Here, 8-10 GPS satellites are typically in use (as shown on the LCD), even with the GPS receiver mounted indoors.
Davis Anemometer
As seen in the schematic, the project starts with the anemometer on the left. Many years ago, I purchased a Davis Model 7911 anemometer and it’s still working today (Figure 5). I checked eBay and there are some less expensive units from overseas, but their outputs may not be compatible. Both eBay and Amazon sell the older model 7911.
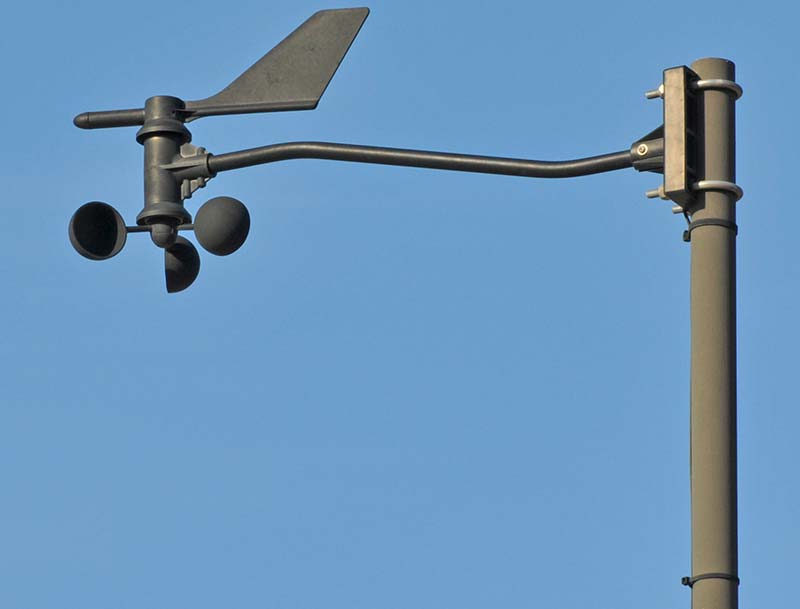
FIGURE 5. The Davis anemometer measures the number of rotations in 2.25 seconds; 10 rotations/2.25 sec = 10 MPH.
The cups in the Davis unit rotate a magnet past a magnetic sensor once every revolution. The calibration is extremely simple. You count the number of pulses occurring in 2.250 seconds: 10 pulses = 10 MPH; 20 pulses = 20 MPH; and so on. The unit also contains a 20K ohm continuous-rotation potentiometer which can be used to track the direction of the wind. However, I didn’t use the pot in this project.
The output of the anemometer is filtered to eliminate any noise from the sensor or the 75 feet of cable running through the attic. I didn’t employ any lightning arrestors, although whenever a thunderstorm comes along I can’t help but think about whether the next lightning strike is going to electrify my desk and me with it!
The pulses from the cups are counted by an Arduino (also used in this project) for exactly 2.250 seconds and stored in a small array. This counting process repeats every 2.250 seconds until a full minute has elapsed, so there are approximately 25 readings/minute. Next, the peak wind speed from the 25 readings is determined and stored as the next data point to be plotted, i.e., each minute the peak during the past minute is plotted. Of course, you could plot the average value for the past minute instead of the peak.
GPS Receiver and Decoder
For the time base, I chose the Garmin GPS receiver shown in Figure 6, mainly because I already had it left over from a previous project.
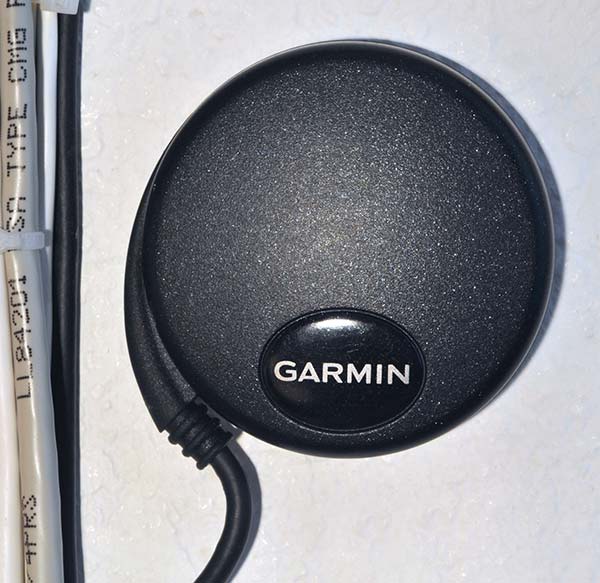
FIGURE 6. Using a GPS receiver to extract the time and date doesn’t require setting, but an RTC could be substituted.
I could have used an RTC (Real Time Clock) but then I would have had to add more buttons to set the time. Besides, in my junk box I also had a Parallax SX28 microcontroller programmed to parse the sentences and output the time and date over a 9600 baud five volt line. I bought a bunch of SX28 protoboards when Parallax had an End-Of-Life sale several years ago; they are handy for small projects like this one.
The time and date are parsed from the GPS RMC sentence and the number of satellites in use is taken from the GGA sentence. As you’ll notice in Figure 4, I display the number of satellites on the 2x16 LCD, only because I am awed by the whole GPS concept and love to see it working. The Garmin unit works fine inside my single-story house, but your reception may vary.
For some obscure reason, I decided to write my own Arduino routine to convert UTC time to local time/date, instead of adapting a Library routine. Big mistake! It looked simple enough, but then I realized that I would have to include time zones, leap years, and daylight savings. Garf! After many hours of debugging, I got it working and confirmed that it converts the UTC data to the correct time and date for all 50 states. Just enter your Time Zone (TZ) in the Setup Section of the code before you load it. If you are not in the US, simply adapt the code to fit your location.
Program Flow
The basic program flow is as follows:
1. In the background, the Arduino measures wind speed at 2.250 intervals, and the SX28 reads the GPS time/date and number of satellites.
2. At the end of each minute, the SX28 sends a pulse to the Arduino.
3. The Arduino then:
a. Determines the peak velocity for the past minute and adds the value to the daily array (1440 points).
b. If the daily maximum velocity has increased, it moves the red fid mark and value to a new point, and sounds an audio signal.
c. It serially transmits updated config and data array files to Gnuplot in the RPi.
4. The RPi sends a new HDMI plot to the LCD monitor, but in a small window.
5. The RPi expands the window to fill the LCD screen.
6. Steps 3, 4, and 5 are repeated at the end of each minute, 1,440 times per day.
7. Everything resets at midnight.
8. The GPS GMT time/date from the SX28 is converted to local time as it comes in.
The biggest problem I had with the programming was juggling the code for the three different processors. The SX28 used assembly language, the Arduino used C, and the RPi required a combination of command-line programming and Python. I had a heck of a time keeping track of which language I was using at any one time. Plus, it was my first experience with Python, so there was a learning curve. Fortunately, the Internet has a cornucopia of helpful hints and I was able to work my way through the problems. I also bought several books and tapped my knowledgeable friends.
This project was also my first experience with the fantastic free Gnuplot plotting program. It was fun to customize the display, but it was almost impossible to stop tweaking it. (You know how it is.) I chose to locate the main Gnuplot configuration file in the Arduino because I needed to update many of the displayed numbers 1,440 times a day. Normally, the config file would be permanently located in the RPi main directory. Instead, I send an updated config file to the RPi at the end of each minute, at 115200 baud.
The source code for the Parallax SX28, Arduino Mega, and RPi is available in the downloads. Also available is a document explaining how to install the necessary support applications/tools for the RPi.
Booting Up and Other Details
Getting all three processors to boot up concurrently was almost my downfall. I could not figure out how to autostart the .py program on the RPi. I scoured the Internet for several days and tried numerous suggestions. No joy.
Finally, I found a reference to an autostart file located deep within the /etc/xdg/lxsession/LXDR-pi subdirectory. The reference suggested adding @lxterminal and the name of the wind speed program to the file, and bingo! It took off. Now, if the power fails, the three processors boot themselves up, collect data for several minutes, and start plotting a full screen. It’s amazing that the system runs all day and night, day after day with no glitches. That’s a total of 1,440 plots/day x 365 days = 525,600 plots/year.
Speaking of problems, the Arduino Mega has a subtle shortcoming. Not all of the pins of the 2560 controller chip are connected to the header on the board, and some are fairly important. For example, most of the external inputs to the six timer/counters are missing. I found this out the hard way when I thought I could use any one of the timers to count the pulses from the anemometer. I checked the Mega schematic and found that there were no external (Tn) connections to Timers 1, 2, 3, or 4. Only Timers 0 and 5 were hooked up. However, Timer 0 was tied up by the Mega to support some of the timing functions, which left just one Timer: T5.
In fact, the most important code for counting the anemometer pulses uses Timer 5 and is only five lines long:
TCNT5 = 0x00 //reset timer/counter 5
TCCR5B = 0x06 //start timer/counter 5, on falling edge of external pulse on T5
delay(2250) //continue counting for 2.250 seconds
TCCR5B = 0x00 //stop timer/counter 5
windspeed = TCNT5 //transfer count to global variable
BTW, I spent considerable time trying to downsize the “over-qualified” Arduino Mega to an Uno. The largest array in the program required 1,440 bytes and the Uno had 2K bytes. It seemed like there was plenty of extra RAM, but I just couldn’t get it to play nice. Plus, with the Uno, I had to invoke a software serial port because I needed two ports with different baud rates. The software port worked fine by itself, but when I folded it into the full program it caused a number of mysterious interaction problems that I got tired of trying to sort out. So, I stayed with the Mega. There is only so much time. (Any ideas?)
I also added a 16 x 2 LCD display to the system for debugging and to display other parameters. I really love all the USB connectors on the RPi. They allowed me to connect a wireless keyboard/trackball in order to make changes to the program and a Flash drive to save the changes — not to mention the convenient five volt power for the speaker.
Construction
Punching the round and rectangular holes in the thick plastic box and its cover was a snap this time, mainly because I had purchased a Grizzly benchtop milling machine a while back. In the past, making such holes involved a lot of elbow grease, i.e., get out the big rattail file and have at it. With the machine, I milled a big hole in the cover as shown in Figure 7, and mounted a fan filter over it to let air circulate around the processors. The power supply is mounted externally to allow plenty of airflow through it.

FIGURE 7. Fabricating the box and its cover was a snap with my benchtop milling machine. No more filing for hours!
Sound
After the whole system was successfully running, I had yet another brainstorm: Why not add sound? For example, there could be a “ding” every time an extra-large gust of wind came along. So, I did it. The RPi required yet another app called Pygame to make it happen. I recorded the sound I wanted using Audacity and put the .wav file in the pi directory. Now, it dings four or five times a day when the wind picks up. I tried using the HDMI audio output jack on the little monitor, but the correct command line instructions eluded me. So, I went with the audio output jack on the RPi board and it worked great.
The Future
The future for this project is wide open. Gnuplot can easily handle multiple plots in different colors and line styles. You can measure temperature, humidity, barometric pressure, whatever. Although I think my next plot to add is going to be another wind speed measurement, but this one will be generated by a no-moving-parts ultrasonic anemometer. Ultrasonic wind sensors typically have a time constant of 0.25 seconds or less, which will catch the fast rise time gusts that the Davis unit completely misses. I can’t wait to see how the two plots compare.
The RPi and Adafruit LCD have opened up a whole new world of dedicated displays for me — no more tying up my laptop or desktop monitor. There is bad news and good news, though. My house may still blow away, but at least I’ll know how fast it went down the street. NV
RESOURCES
www.adafruit.com (displays and Raspberry Pis)
www.ebay.com (anemometers)
www.davisnet.com (anemometers)
www.dfrobot.com (cheap 2x16 LCD shield)
www.digikey.com (general components)Big
www.parallax.com (SX28 IDE)
Arduino Cookbook, by Michael Margolis, 2013
PARTS LIST
| DESIG |
COMPONENT |
Digi-Key (unless noted) |
| R1 |
Resistor, 10K |
10KQBK |
| R2 |
Resistor, 470 ohms |
470QBK |
| R3-R5 |
Resistor, 1K |
1.0KQBK |
| R6 |
Resistor, 330 ohms |
330QBK |
| R7 |
Resistor, 3.3K |
3.3KQBK |
| R8 |
Resistor, 1.8K |
1.8KQBK |
| D1, D2 |
Diode, 1N914 |
1N914BCT |
| C1 |
Capacitor, 1.5 mfd 35V |
478-1853 |
| C2, C3 |
Capacitor, 0.1 mfd 50V |
399-8994-1 |
| SW1 |
Toggle Switch, SPDT |
480-3077 |
| SW2 |
Pushbutton, N.O. |
RadioShack |
| SW3 |
Toggle Switch, SPDT |
CKN1023 |
| LED1 |
LED, Green |
RadioShack |
| LCD1 |
LCD Shield, 2x16 |
DF Robot, DFR0009 |
| PS1 |
Power Supply, 5V, 12V |
102-2527 |
| Q1, Q2 |
FET, 2N7000 |
2N7000TACT |
| U1 |
IC, 74LS14 Schmitt Trig |
296-3638-5 |
| MEM1 |
Thumb Drive, 8 GB |
Best Buy |
| SPKR1 |
Insignia Portable Spk |
Best Buy |
| BOX |
Carlon/Cantex, 6x6x4 |
Lowe's/Home Depot |
Note: The major components/boards are labeled on the schematic.
|
Downloads
Raspberry Pi, Arduino, and SX28 code files from Wind Speed Tracker