Back in the 18th century, it was suspected that bats navigated using sound, but it took until 1938 to conclusively demonstrate echolocation. The mechanism almost exclusively utilizes ultrasonic frequencies which are inaudible to humans. In brief, bats emit high frequency, short duration energetic pulses of sound and interpret the echoes that return to their ears. The sounds have been shown to be quite complex, featuring swept frequency chirps and constant frequency components. Some people (including me) can hear a limited portion of the sounds emitted by bats. This may be the lowest parts of their frequency modulated content. Certainly, it’s perfectly possible to be surrounded by bats alongside some woodland at dusk and hear nothing but their wings fluttering.
Listening In
That’s where the bat detector comes in. By down-converting the ultrasound into our audible range, we can indirectly detect it and at least enjoy a window into the hidden world of echolocation. It has been suggested that bats utilize delay times, arrival time differences, and the Doppler effect to interpret echoes. Of course, we can only guess at what bats actually perceive. Perhaps the end result is somewhat analogous to vision, with an image that is refreshed as new information comes in.
This bat detector is a heterodyne design. This means that realistic sounding calls are heard, but bear in mind that they have been frequency shifted and are representative artifacts of the original sounds. Nevertheless, the sounds heard with this detector are highly informative with real scientific value. It is perfectly possible to identify bat species by careful observation using this detector as their call patterns are species-specific and can be quite distinctive. I personally (along with a knowledgeable assistant) have identified two species locally, namely brown long eared bats and common pipistrelle bats.
What is Heterodyne?
The incoming ultrasonic signal is mixed with a locally generated signal that is close to the same principal frequency. The mixer output contains a signal which is the difference between these two. So, for example, if the incoming sound is based at 45 kHz and the local oscillator is running at 42 kHz, the output will be around 3 kHz — nicely within the range of human hearing. Interestingly, the same output would also be produced if the local oscillator was set to 48 kHz as the mixer produces difference signals in both senses, positive and negative.
The block diagram in Figure 1 is pretty much as it was when I first sketched it out. The project subsequently grew from it. The diagram shows the main functional components, starting at the microphone which is sensitive to ultrasonic frequencies. This feeds a pre-amplifier and high pass filter combination.
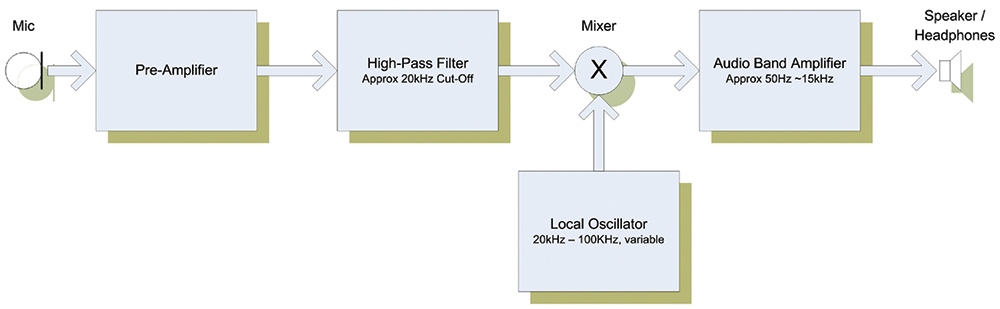
FIGURE 1. Block Diagram.
The amplified signal is combined with the local oscillator output in the mixer. The local oscillator is adjusted so that its tone is close to the ultrasonic frequencies of interest. The mixer effectively multiplies the ultrasonic signal with the local oscillator tone and produces audio-band signals representing their difference. The audio band amplifier block buffers the mixer output and drives the user’s headphones.
Circuit Description
Unlike competing designs which use quite complex digital processing techniques, this project uses straightforward analog circuitry comprised of a quad op-amp and a handful of passive components. With the possible exception of the microphone, most hobbyists will find that everything needed is already at hand, making this an unusually inexpensive project.
The circuit diagram in Figure 2 shows the complete project and it really is as simple as it looks. Each of the four amplifiers in the quad op-amp IC is used as a building block, and these correspond quite closely with the functions shown in the block diagram. IC1/a and IC1/b comprise a two-stage, high gain microphone pre-amplifier. Capacitors C1 and C3 were selected to produce a two-pole, high pass filter characteristic which blocks audio-band input while favoring ultrasonic frequencies.
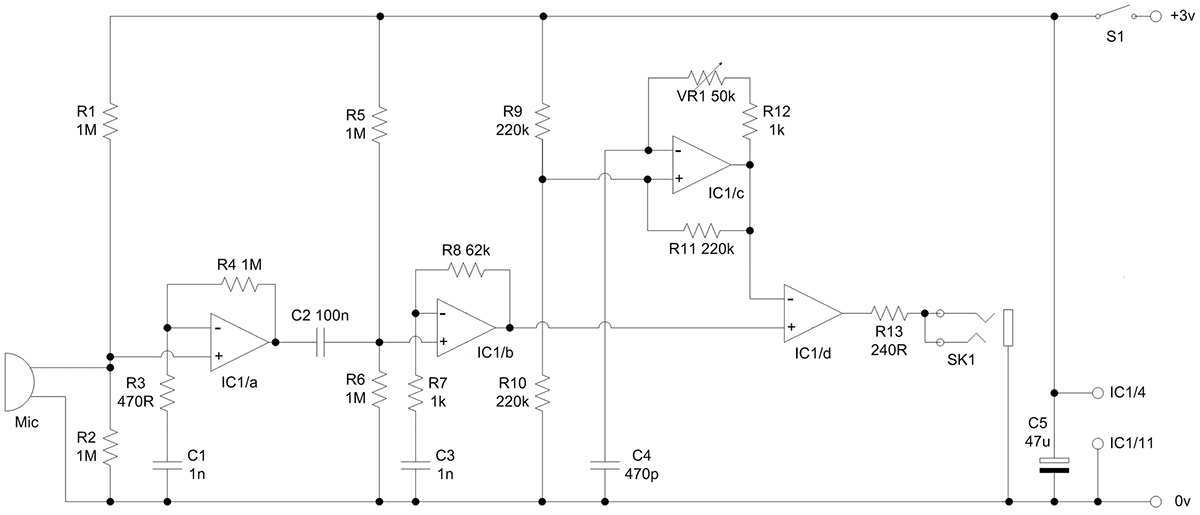
FIGURE 2. Bat Detector Schematic.
Resistors R3 and R4 were selected for high gain in IC1/a — consistent with acceptably low noise. The gain of IC1/b is set by R7 and R8. The latter was, in fact, selected to match the sensitivity of the microphone, given the high gain of IC1/a. It may be necessary to alter R8, depending on the specific microphone used. For this reason, it is worth considering something like a 220K potentiometer in its place during construction and initial setup.
IC1/c is a conventional RC oscillator. Its frequency is determined by C4 and the combination of VR1 and R12. With the values shown, the usable range is about 15 kHz to 110 kHz.
IC1/d serves as our mixer, combining the filtered and amplified input signal with the local oscillator tone to produce an audio-band signal. IC1/d also buffers the signal and drives the headphones. Resistor R13, in series with the headphones, was found to be necessary to prevent feedback. It’s not quite clear whether the feedback arises via the external headphone-microphone route or it is an electronic circuit phenomenon, but it was an unbearable effect which R13 completely cured.
Measured battery drain is just 5 mA when a 3V supply is used as shown. Using a 9V battery instead increases consumption to 20 mA.
Choice of Components
The project was constructed around an LM324 quad op-amp, simply because it was available. Other similar quad packages will most likely work just as well, and the IC pinouts are usually identical but check to be sure first. While we’re on the subject of pinouts, note that the four op-amps in ours have been labelled to match the suggested circuit layout, not the conventional order usually seen. (See Figure 3.)
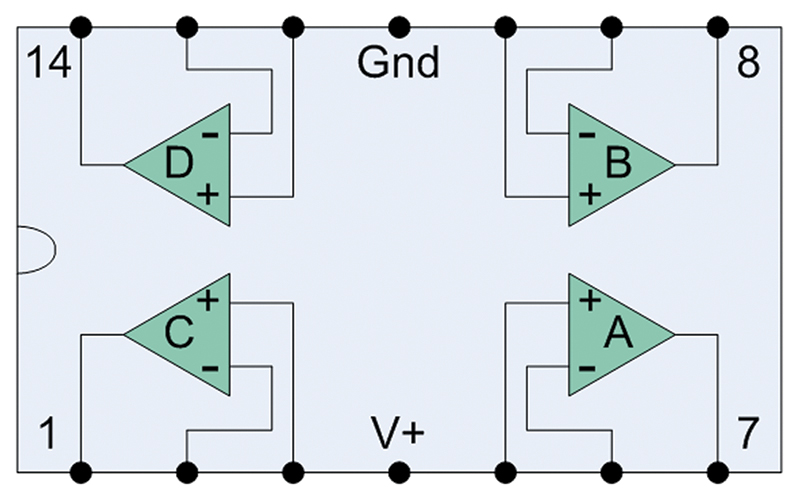
FIGURE 3. IC1 Pinout.
The microphone used in this project was in fact a simple piezo sounder, selected for best performance from a variety that were at hand. (More on this later.) The decoupling capacitor C5 is an electrolytic type. For the suggested layout, an axial-leaded component is most convenient, although a radial-lead one could be used. Its value is listed as 47 µ, but it is not at all critical and anything in the range of about 22 µ to 100 µ would be fine.
The passive components (resistors and capacitors) are entirely conventional, as shown in the Parts List. It is unlikely to matter whether polyester or ceramic capacitors are used, so just pick out the parts from what you have available. In a similar vein, the project case, battery box, and headphones can be selected according to taste and availability, as well. If desired, you may elect to use AAA cells instead of the larger AA ones. Power switch S1 and frequency control potentiometer VR1 may also be chosen to suit your needs. It is worth bearing in mind that having a numbered scale around VR1 has proved to be indispensable when using the device.
Construction
While it is certainly possible to create a PCB for this project, it’s hardly worth all the effort. The circuit can be readily constructed on strip-board such as Vero board, producing a satisfyingly neat, durable, and reliable result.
The suggested layout fits on a 1.25 x 2 inch board. It is 18 holes high and 12 tracks wide, and requires just 14 track cuts. Experienced builders may of course prefer to adjust the layout as desired.
Gather together all the electronic components first, then prepare the board. It may be better to build up the circuit on a large piece of Vero board first and then cut it to size afterwards. This makes it easier to handle the board while soldering. Carefully drill out all the breaks in the copper strips, preferably using a simple hand tool. Insert the components and secure them lightly by bending their wires a little with needle-nose pliers. It can be easier to do a few parts at a time. Watch the polarity on C5 and the orientation of IC1. Solder the components in, then clip off surplus wire neatly. The suggested layout uses five wire links on the component side of the board and four on the solder side to bridge across the copper tracks.
Sharp-eyed builders will notice that R7 and C3 have been swapped over to make the layout a little more convenient. As these two components are simply connected in series, this does not affect circuit behavior in any way.
One lead of the 62K resistor R8 goes right over a wire link without being in contact with it. It may be advisable to slip a short piece of plastic sleeve over the link to ensure that the wires cannot inadvertently come into electrical contact.
Once the components are mounted, add the various connecting wires. In the photograph of the circuit board in Figure 4, the pink wires go to the microphone and the gray wires go to the potentiometer. Red and black are from the battery box; these are positive and negative, respectively. The orange pair is from the power switch. The Vero board cuts are arranged to place the switch in series with the battery. Finally, the yellow and black wires feed the headphone socket.
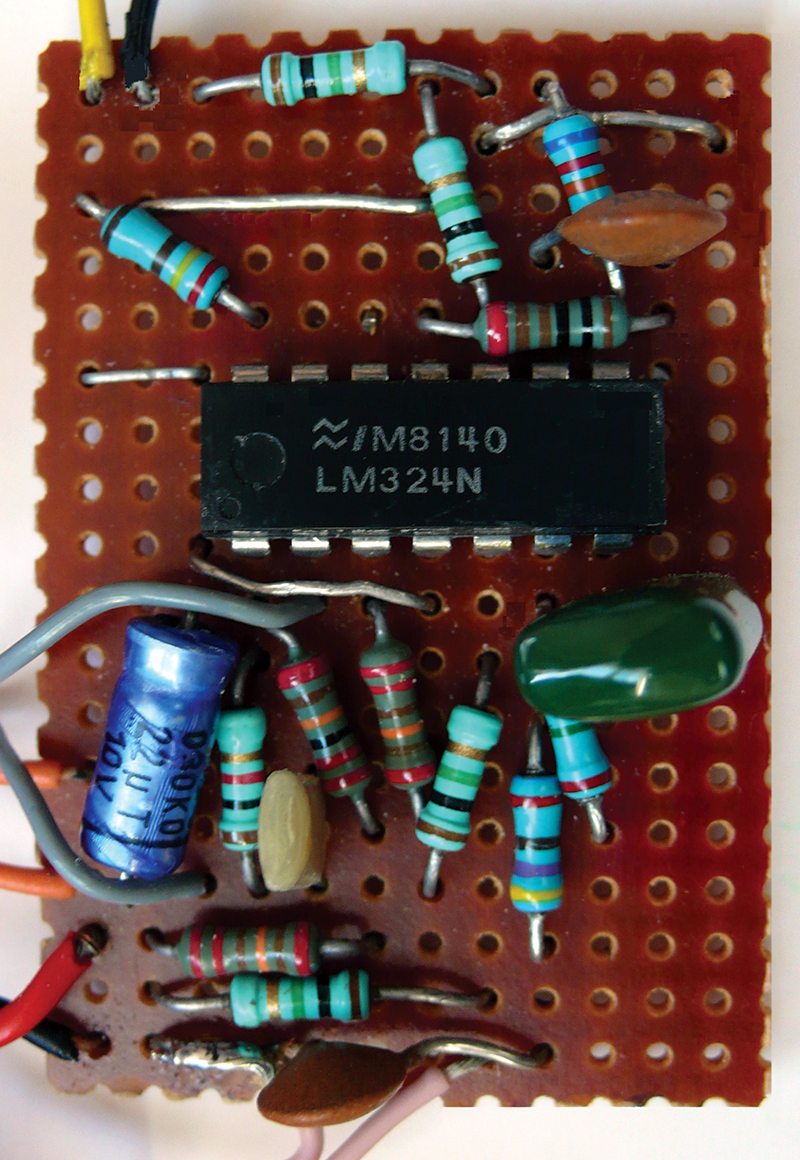
FIGURE 4. Circuit Board (component side).

FIGURE 5. Board Layout (component side).
Initial Testing
Plug in some headphones, power up the circuit, and take a listen. As the frequency potentiometer is turned, noise should be heard. The intensity and spectral content of the noise varies a great deal across the control range. If an oscilloscope or frequency counter is available, examine the output of the local oscillator IC1/c. The frequency range available should be in the range of about 15 kHz to 110 kHz. If no scope is available, it is possible to hear the local oscillator running. Turn the potentiometer towards its minimum value. A high pitch whistle should be heard.
If the circuit is not behaving as it should, it’s always worth checking for simple build errors first. Inspect the rear of the board. Are all the wire links fitted? Are there any unintentional solder bridges or whiskers of wire between tracks? Check that all the track cuts are present and in the right locations, and that every component leg is actually soldered. Turn the board back over and look at the component side. Is each item in the correct holes? Try comparing it with the board photograph and layout diagram. Check that all the connecting leads are in the correct locations.
Once it is established that the local oscillator is running, check out the high gain amplifier comprising IC1/a and IC1/b. This is most readily achieved by examining the output of IC1/b with a scope, but, of course, it may also be done simply by listening to the mixer output using headphones in SK1.
Microphone selection is critical. Some experimenters have reported that the usual ultrasonic transducers are not always the best choice. In fact, a simple piezo or ceramic sounder used as a microphone can produce superior results. During development, a selection of sounders were available, as shown in Figure 6. They were all assessed and the winner was the flat one on the right. The component was unbranded and was by no means the only possibility.

FIGURE 6. Mic Line-up.
In contrast with audio projects, ultrasound ones always pose a special challenge: how to simulate the input signal. Having tried all manner of things, the simplest and most effective ultrasound source was actually one’s mouth. Making a hissing noise anything up to a meter (yard) away from the microphone resulted in a lovely rush of noise in the headphones, arising from the surprisingly strong ultrasonic components of the sound. Another technique is to rub two fingers together or slide a fingertip over a sheet of paper held near to the microphone.
Calibration
It is very useful to be able to set the device to the desired frequencies, and conversely to be able to determine what frequency the device happens to be tuned to. For this reason, it’s well worth marking or fitting a numbered scale around the frequency potentiometer and then calibrating the device. For this purpose, an oscilloscope or frequency counter is required. Observe the output of the local oscillator while rotating the control across its entire range, and note what frequency corresponds to each point on the scale.
Using the Bat Detector
Once the detector has been tested as far as it can be on the workbench and the dial has been calibrated, it’s time to venture out at dusk. Hearing your first bat is a very satisfying experience. Start by setting the frequency to about 30 kHz. You should hear a uniform hiss in the background. It is sometimes possible to hear leaves rustling ultrasonically in the wind, some seconds before the gusts are even felt. Keep as still as possible. At these frequencies, the microphone is highly directional.
When bats are seen flying close by, point the microphone directly at them. The device is sensitive enough to produce good results from quite a few meters (yards) away. You are listening for a series of click or plop sounds as the bat passes by. Some species actually synchronize the clicks with wing motion, giving the illusion that it is wing beats that are heard when, in fact, it is the echolocation pulses.
It can be rewarding to stand among trees during early dusk, directing the microphone upwards. It is possible to hear the chattering of social calls in bat roosts. Try scanning around the lower part of the frequency range as this is generally used for social communication. Who knows how many bat species you’ll be able to identify. NV
Using The Detector
Expert biologist Dr. Ochre Brittlegill was only too pleased to assist with evaluating the performance of the bat detector.
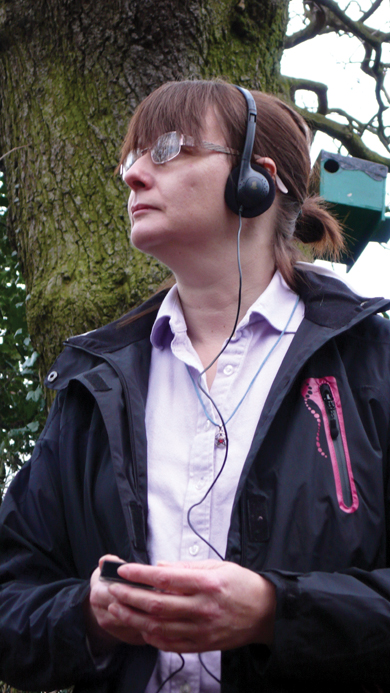
Having surveyed a tract of English woodland several times, Dr. Brittlegill had established that at least two species of bat were present. Making definitive identifications was proving tricky, however. Listening to their distinctive echolocation features such as pulse repetition rate and frequency sweep, our expert identified the smaller species as common Pipistrelle (Pipistrellus pipistrellus), a widespread resident with a wingspan of around 19-25 cm (7.5 to 10 inches). The larger species proved to be the brown long eared bat (Plecotus auritus) which has a wingspan of about 22-25 cm (9 to 10 inches).

Mixed woodland adjoining open spaces such as fields is ideal for many bat species. Ancient trees such as the venerable old oak, shown in the photo, provide myriad roosting opportunities. Bats use ultrasound for social communication, as well as for echolocation. The frequencies utilized for this purpose are generally considerably lower, as indeed is the volume. With a little patience, Dr. Brittlegill was able to tune into the faint chattering in some bat roosts early in the evening before the nightly hunting for food got underway.
PARTS LIST
| ITEM |
DESCRIPTION |
| Resistors |
All 250 mW 5% axial carbon film. |
| R1 |
1M |
| R2 |
1M |
| R3 |
470R |
| R4 |
1M |
| R5 |
1M |
| R6 |
1M |
| R7 |
1K |
| R8 |
62K |
| R9 |
220K |
| R10 |
220K |
| R11 |
220K |
| R12 |
1K |
| R13 |
240R |
| VR3 |
50K rotary potentiometer (see text) |
| Capacitors |
All polyester or ceramic except C5. |
| C1 |
1 n |
| C2 |
100 n |
| C3 |
1 n |
| C4 |
470 p |
| C5 |
47 µF 10V electrolytic |
| Active Components |
| IC1 |
LM324 quad audio op-amp or similar (see text) |
| Miscellaneous |
| Mic |
Piezo type (see text) |
| SK1 |
3.5 mm stereo phone socket |
| S1 |
SPST switch (see text) |
| Battery |
Two-off AA cells for 3V operation |
| Battery Box |
Double AA box to suit construction |
| Project Case |
Select according to construction needs |
| Headphones |
Dynamic in-ear or on-ear type, 300R approx. |