Sometimes discovery occurs during the pursuit of something else entirely. Such is the case of the circuit presented here. I stumbled upon this circuit while trying to design a custom frequency tuner for my guitar.
When practicing chords (groups of three note patterns), it's difficult to know when they are being played properly other than how they sound. There's no electronic device that I’m aware of that can measure if the chords are being played correctly. If I try to use a standard frequency tuning device, a "C" chord displays as the "G" note. So, I ended up building a circuit that would respond to what sounded correct, and that turned out to be the discrimination of the entire octave the chord was played in. This led to the construction of a device that could respond to any one of the seven traditional octaves. I found that playing music through the device was like having my very own extremely responsive computerized light show. I can truly say without equivocation that, "This circuit is hands down the best sound to light device you could ever build."
What Makes This Device So Different
The CHROMATICON is actually an octave display device and should not be confused with circuits that are often referred to as color organs. Traditionally, color organ circuits that translate sound to light are active bandpass filters comprised of capacitors, resistors, and op-amps. These filters separate the low, mid-range, and high frequencies that can be used to illuminate different wavelength LEDs.
The last color organ circuit I tried building was purchased after watching a slick YouTube video entitled “Circuit Skills.” The video was for a kit bundle that sold for around $40 and contained quite a few parts. For some reason, having so many parts made me feel like it had to be better than the last one I built. After taking what seemed like forever to construct and tweak, its performance fell short of what must have been too great an expectation on my part.
Just like other similar circuits I have built in the past, I find that the wholesale summing of frequencies in this manner to be somewhat uninteresting. Personalizing these circuits typically means just selecting a different color combination of lights for the three bands, and scalability is limited to the strength and number of lights. This is where the CHROMATICON and the color organ circuits part company.
With color organ circuits, the patterns that can be displayed are fixed by the physical placement of the LEDs. With the CHROMATICON, however, displayed patterns are controlled by software. Instead of a sluggish response to the music input, the CHROMATICON comes to life with each note played, and every song displays in some unique way. It has caused me to have a renewed interest in my collection of music, and I am anxious to see how each song will get displayed.
What Exactly Are Octaves
The following is a simple overview of the fundamentals of how music is composed, and may help in understanding the approach I have taken toward my technique of sound to light conversion. Traditional music is comprised of individual frequencies that make up the seven note or diatonic scale consisting of the notes C, D, E, F, G, A, and B. If you include the sharps (notes raised a half tone), there are actually 12 notes to the chromatic scale written as C, C#, D, D#, E, F, F#, G, G#, A, A#, and B.
On a piano, these 12 note scales repeat as the first octave (CDEFGAB) to seventh octave (CDEFGAB), plus a minor third (A0 to C8) across a keyboard of 88 keys. An octave is the simplest interval in music. It is the interval between notes in one octave to the same note in a lower or higher octave. The range of frequency between notes from one octave to the next is either one half or twice the frequency of the note.
For example, the A note from the fourth octave has a frequency of 440 Hz. The A note one octave higher (A5) is at 880 Hz, and the A note an octave lower (A3) is at 220 Hz. With the octave being such a fundamental part of creating music, it just makes sense to me to build a circuit that can visualize the notes played in the full range of octaves used to compose music.
Digital Hardware for an Analog Task
The heart of this circuit is the PICAXE, but it can be constructed using any processor that is capable of frequency measurement. The PIC, PICAXE, and Stamp micros are able to measure frequency with the COUNT or PULSIN command. I haven’t tested the circuit with the Atmel family (Arduino), but I believe that it does have a similar Pulse(IN) command.
The operation of the circuit is extremely straightforward. A line level output from an audio source is coupled to an input pin on the 08M2 by way of a 0.1 µF capacitor through a limiting resistor. The PIC 20M2 chosen for this project allows for up to 15 outputs to drive the LEDs, and one pin necessary for the audio input.
There are two design camps when using this method to convert sound to light. In one camp, by hard-wiring patterns of LEDs more patterns can be had using fewer I/O ports. An alternative method is to individualize the connections to the LEDs. This method will exhaust I/O lines faster, but allows for greater flexibility in displaying patterns of LEDs by simply changing the software. This is how the circuit covered here was designed.
Following the schematic shown in Figure 1, a left or right channel line out from an audio source is coupled to the C.6 pin of the PIC using a 1 µF capacitor. The only difference between this circuit and the minimal circuit is the use of an additional Darlington array to meet the higher I/O count.
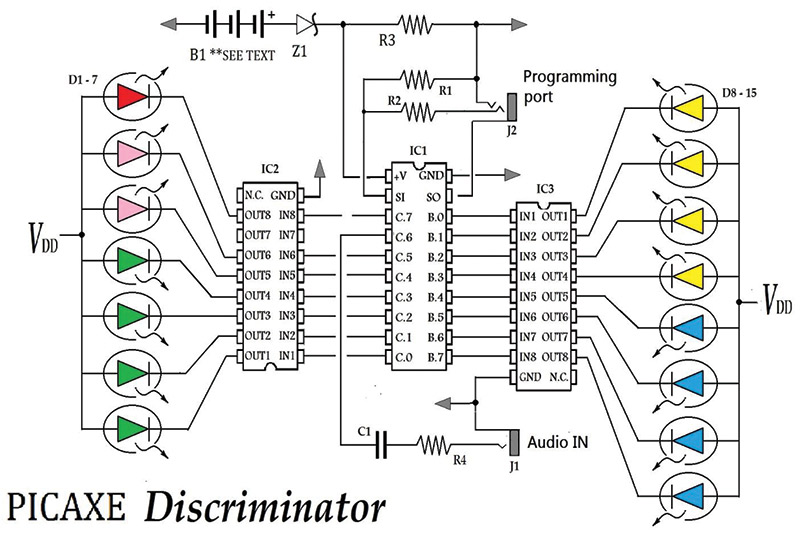
FIGURE 1. Example system design using the PIC 20M2 micro-controller.
Any medium output LED will work for the display. The medium output range is usually between 2,500 and 8,000 mcd. LEDs used in this design are in that range, and all have a maximum current rating of about 22 mA. The LEDs are pulsed and are never turned “on” for longer than 50 msec. This keeps current down to around 15 mA and allows you to parallel diodes without the need for current-limiting resistors.
You may want to include resistors while experimenting, and they should be added between the outputs of the Darlington transistors and the cathode side of the LEDs. Be sure to use the LINE OUT from the audio source and not the amplified output. There is a minimum voltage threshold for the input (approx 1V peak to peak). It’s best to start at the maximum LINE OUT setting from the source device and then lower it as needed for personal taste.
Building the Display Board
Figure 2 is an example layout of LEDs for the CHROMATICON. The board used for the display is a 4” x 6” plated through hole prototyping board. With 15 I/O lines available, there are many options for the organization of LEDs. If you connect more than one LED per line, connect the additional lights in parallel. The individual and grouped diodes are wired to female SIP headers of eight pins each on either side of the board, mounted in the center as shown in Figure 2.
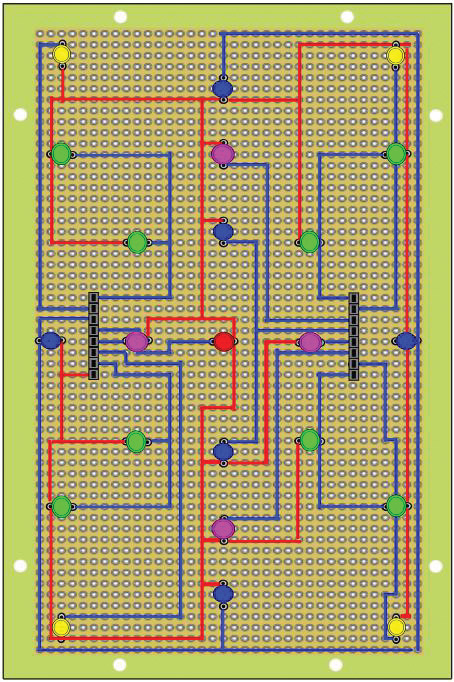
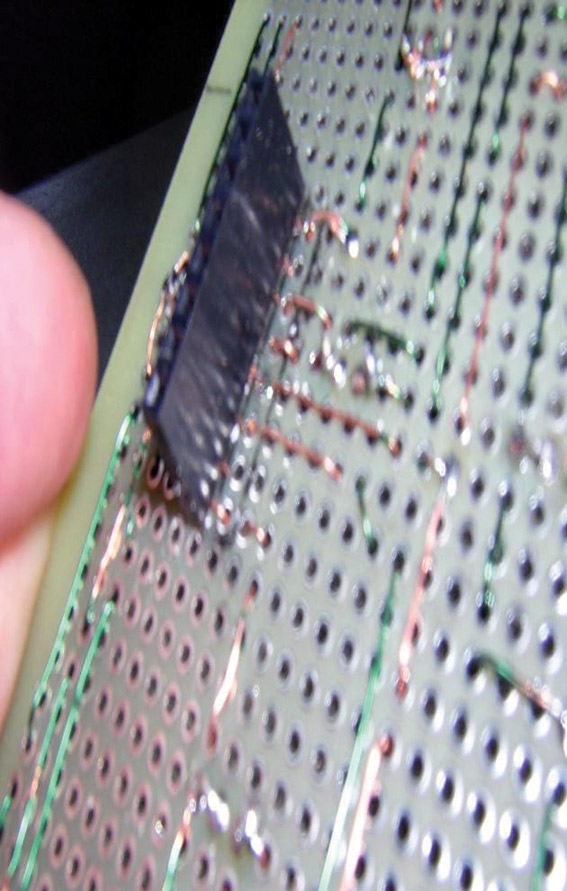
FIGURE 2. Interconnect for the LEDs and a close-up of the display wiring.
The only pin that matters for alignment to the driver circuit is the +5V supply line. The remaining connections to the LEDs do not need to follow any strict order and should be made opportunistically trying to avoid using jumper wires.
Building the Driver Board
Figure 3 is a photo of the driver circuit that was used in the prototype. The driver contains all of the electronics needed for the circuit.
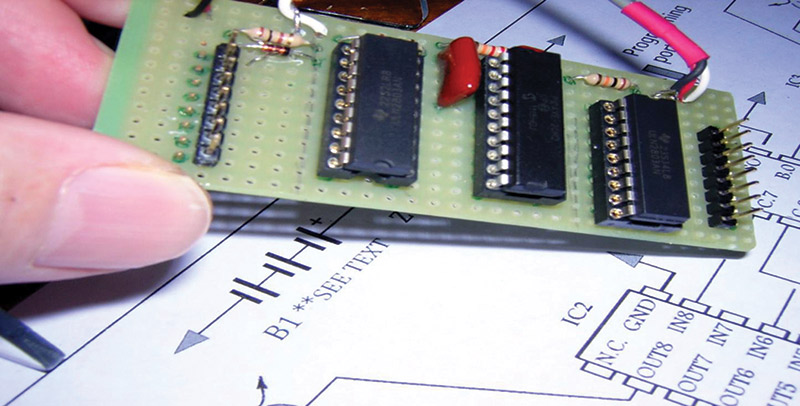
FIGURE 3. Component side of the driver circuit.
The components on this board were connected together using silver conductive ink, but any interconnect method will work. Figure 4 is the back or interconnect side of the driver board. The connections for the prototype were made with conductive ink but any method of connection can be used. The parts are very close together, making it easier for interconnect.
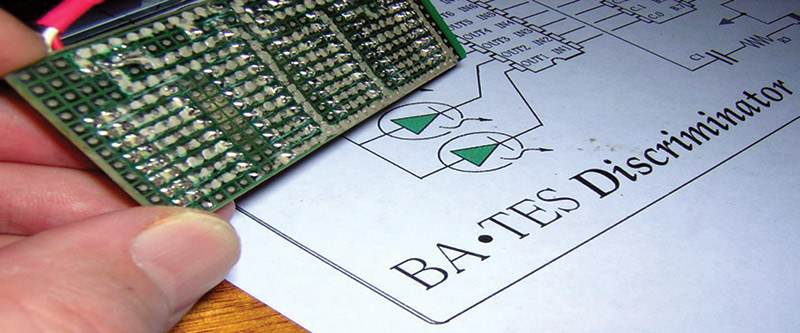
FIGURE 4. The wiring side of the driver board.
Figure 5 shows the reflected inking pattern for the design. The connections from the back need to be reflected to insure that the pin 1 locations for the ICs are correctly connected. This same pattern can alternatively be used for soldering wire busses to connect the components.
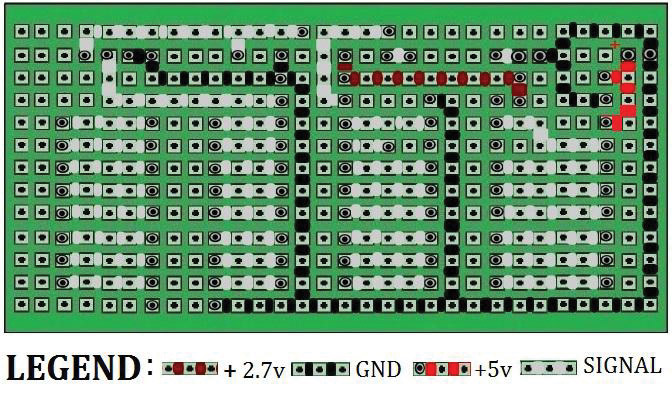
FIGURE 5. Connection side of the driver board.
The routes are color coded to separate power, ground, and signals. Figure 6 shows a side view of the board with the correct placement of the male headers. They need to be mounted so the pins are facing the direction shown to plug into the female headers on the display board.
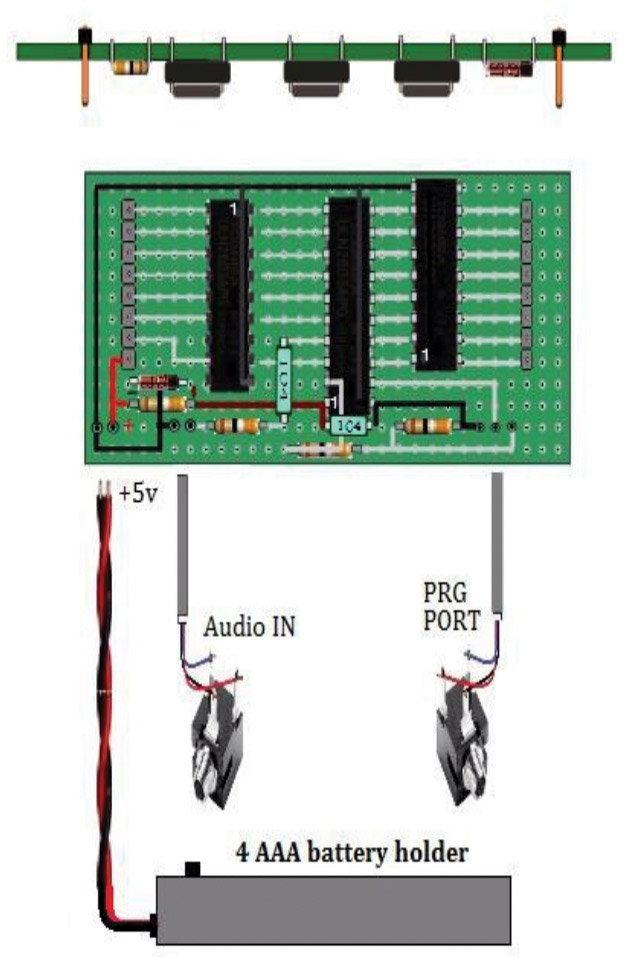
FIGURE 6. Wiring connections to the driver board.
Wiring for the circuit is brought to the base of the document holder behind the display board. This consists of the programming cable, audio input, and power supply for the circuit as shown in Figure 6. You may want to use a shielded cable for the connection to the 3.5 mm audio jack for the Audio IN. Connection of the programming port requires a specific connection to the jack as described in the PICAXE manual. The four AAA battery pack is connected directly to the board and doubles as the power switch for the circuit. If you like, you can substitute or add a 5V supply such as from a USB port or other rectified source to power the circuit without modification to the electronics. The NiMH supply will last about a week before needing to be recharged.
Figure 7 is an example of the assembled components. The display driver connects to the back of the display board in a shield-like fashion using SIP headers. With the driver connected to the display board, the entire assembly mounts to the upright panel of the document holder, also shown in Figure 7.
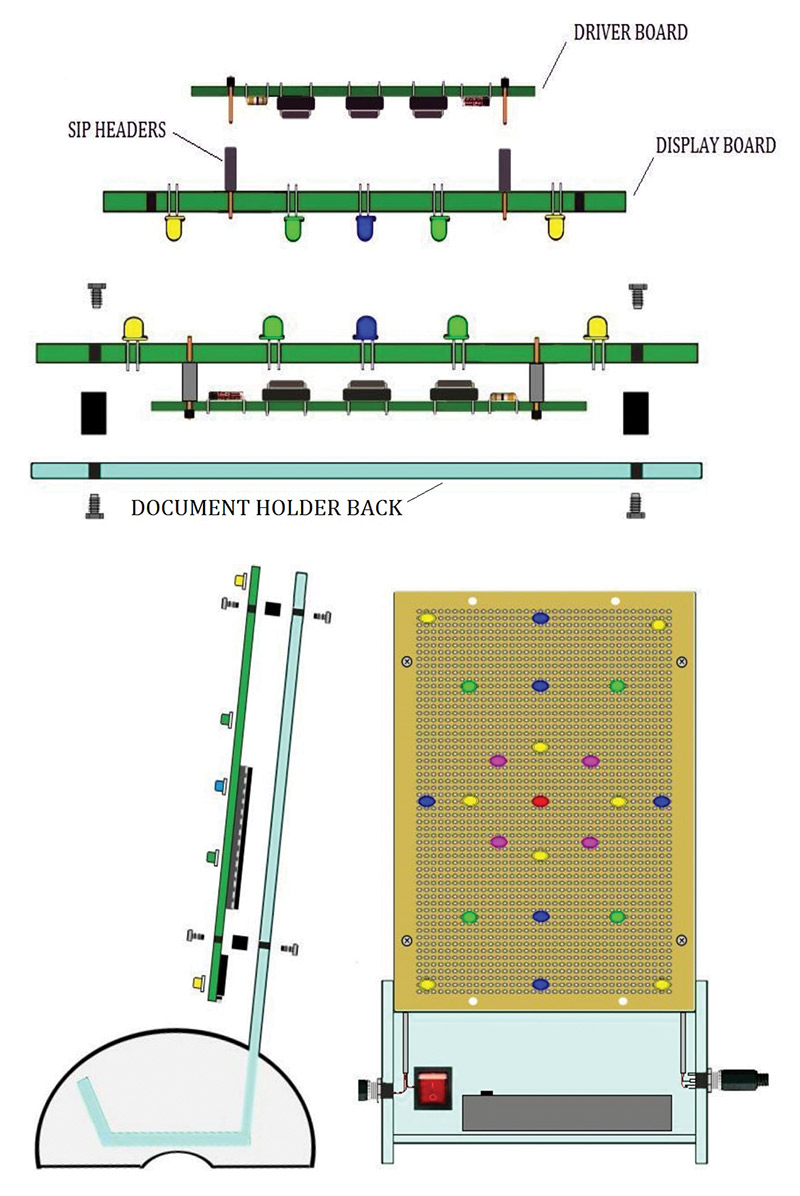
FIGURE 7. Display and driver board connecting to the front of the document holder.
The two eight-pin male headers located on the driver board supply the display board with 15 I/O lines and a positive supply by way of the two headers. Threaded standoffs are used to attach the display and driver shield to the frame of the document holder.
The Discriminator Software
Software for the circuit is pretty straightforward. We are basically using the PIC as a low-level resolution frequency counter. I began writing this software using the COUNT command to actually measure the literal frequency. This would work fine if we were just measuring static tones, but for dynamic music it turned out to be a little too slow. The alternative is to use the PULSIN command which measures the length of the incoming pulses and produces a corresponding number between zero and 255. This is less graceful but at the end of the octave sampling day, achieves the same net result. You just have to be willing to translate your target frequency range initially into their corresponding 256 bit values, and then use that translated value in your conditional statements. This is actually easier than it sounds. To translate the output using the PULSIN command, start a DEBUG window and input a frequency to the PIC using the following example code:
DO            ; begin loop<br />
PULSIN C.6, 1, W0<br />
 <br />
  ; measure the frequency on pin C.6 and put<br />
  ; result in variable W0<br />
DEBUG W0    ; start DEBUG monitor<br />
LOOP        ; do again
The DEBUG window will show a list of all your variables. If the input frequency was 2,400 Hz, the translated value of 19 is what got stored in W0 as shown in Figure 8. Instead of using the actual frequency in Hz for the octave range, you would record the translated value for both the low and high end of the octave range and then use those values in your conditional statements.
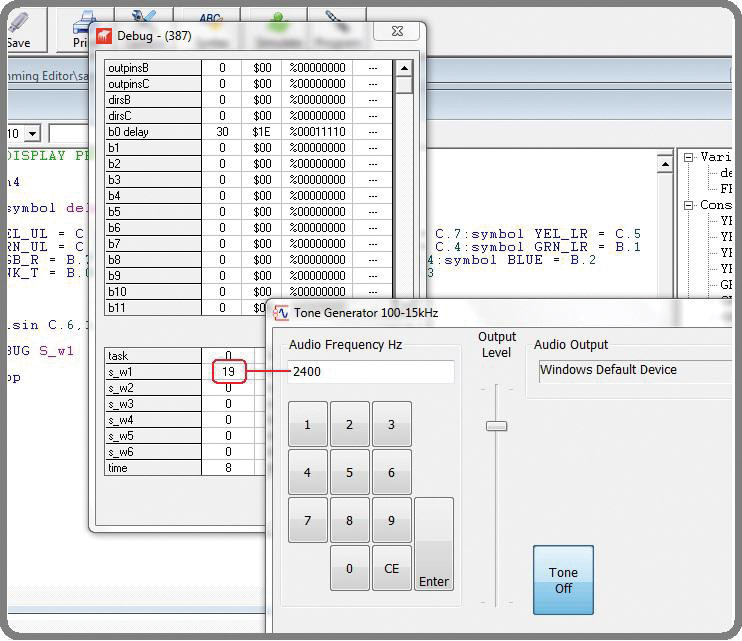
FIGURE 8. Example of the frequency translation process.
The software that accompanies this project already has translated values. You may want to double-check the calibration, especially if you make any modifications to the supplied schematics. The PULSIN frequency measurement command requires only three arguments which are the port or Pin# for the input, the State from which to measure from, and the Variable used to hold the value for the frequency. This command measures the length of a pulse on the input pin. Depending on the State variable, it either measures from the rising edge of the input or falling edge indicated by declaring a 0 or 1 value on the command line. The measured result is placed in the variable of choice. For example:
PULSIN C.6, 1,  W0  <br />
   ; measure the low to high transitions on C.6<br />
   ; & stores in W0
The default 4 MHz clock speed for the microcontroller is more than adequate for measuring audible frequencies. By using a table of the established frequencies for musical notes, the result held in the W0 variable can be used to initiate some event such as lighting a designated LED or group of LEDs. We can use a list of the frequencies that make up the chromatic scale for any octave, such as the example shown in Table 1 used for the fourth octave scale.
| Note |
Frequency (Hz) |
| C4 |
261.63 |
| C#4/Db4 |
277.18 |
| D4 |
293.66 |
| D#4/Eb4 |
311.13 |
| E4 |
329.63 |
| F4 |
349.23 |
| F#4/Gb4 |
369.99 |
| G4 |
392.00 |
| G#4/Ab4 |
415.30 |
| A4 |
440.00 |
| A#4/Bb4 |
466.16 |
| B4 |
493.88 |
TABLE 1. Frequencies of notes for the 4th Octave.
Using this list and with the help of a tone generator, you can compile an inventory of the translated numbers for each octave. For the list in Table 1, the translation would look something similar to this:
C4 = 261 Hertz Translated value = 17 (beginning of the 4th Octave)
B4 = 493 Hertz Translated value = 37 (end of the 4th Octave)
To light an LED or group of LEDs with a specific wavelength that includes a range of frequencies, you only need to provide a conditional IF/THEN statement for the range desired. The following is a code fragment that would cause the grouping of four yellow LEDs shown in the schematic to light if the sampled input frequency was between 260 and 493 Hz:
EXAMPLE DISCRIMINATION FOR THE 4TH OCTAVE :
If W0 > 16 and W0 < 38 THEN<br />
      ; any notes between 260Hz<br />
      ; to 494Hz
HIGH Y_UL,Y_UR,Y_LL,Y_LR : PAUSE<br />
DELAY:LOW Y_UL,Y_UR,Y_LL,Y_LR     <br />
      ; light these 4 LEDS
This IF/THEN statement lights the four LEDs connected to ports B.0-B.3 if any notes within the fourth octave are sampled. You can go even further to enhance the effect of the translation of sound to light by carving up the octave into several patterns of yellow lighting. We can accomplish this by lighting the upper left (Y_UL) and lower right (Y_LR) LED if it is the lowest part of the octave, and upper right and lower left LED if it is the highest frequency part.
By reserving just the center part of the octave to light all four lights, it creates a very interesting effect. It helps to assign names for the ports that is indicative of their physical locations. This same technique can be used to indicate when notes from the other octaves are played.
Using LEDs of the same color arranged in various patterns creates another interesting effect. I find that by using enough LEDs to make square, diagona,l or cross patterns can produce the best effects with the least number of LEDs. The layout of LEDs shown in Figure 2 is an example of this suggested arrangement. The software that is available for download was written expressly for the arrangement of diodes shown in Figure 5. The code has been well documented and should serve as a starting point for a layout of your own design. This design can be scaled up using several methods. One method to free up I/O lines would be to hard wire the LED patterns. This would allow you to have more patterns. Another method would be to connect more LEDs in parallel to the existing I/O lines. Each ULN2803 is rated up to 500 mA.
The duration for how long the LED is kept open during operation is controlled by the value held in the DELAY variable. In the program listing provided, the DELAY is set to 50 milliseconds, but you may want to use different delay times for the ranges of the discriminated frequencies. There can be a noticeable difference using longer on times for higher frequencies, and shorter times for the lower frequencies.
Final Thoughts
This circuit is a single channel or mono design, so the choice of using the left or right channel is up to you. A stereo circuit may require more than just another input due to the time needed for both sampling and processing the results. A twin circuit would be ideal to produce a stereo effect. A sensitive microphone can be used as an input to the processor, as long as an amplifier is included to boost the signal. An alternative to using a separate board for the driver would be to mount the components directly to the back side of the display board. The 4” x 6” board for this project is a plated through hole design which would allow the parts to mount on either side. If you prefer that kind of design, feel free to email me if you need help with that implementation.
However you decide to implement this circuit, I hope you enjoy how it enhances the music you listen to as much as I have. NV
Parts List
| ITEM |
QTY |
DESCRIPTION |
SOURCE/PART# |
| BRD1 |
1 |
Proto Board |
Digi-Key V2009-ND |
| BRD1 |
1 |
Proto Board |
Digi-Key V2025-ND |
| SCKT1 |
1 |
20 Pin Socket |
Digi-Key A106188-ND |
| SCKT2 |
2 |
18 Pin Socket |
Digi-Key ED3019-ND |
| IC2,3 |
2 |
ULN2803 |
Digi-Key ULN2803APG(ONHZA-ND) |
| J1,2 |
2 |
3.5mm Audio |
Digi-Key CP1-3543-ND |
| Z1 |
1 |
2.7V Zener Diode |
Digi-Key 1N5223B-ND |
| C2 |
2 |
.01 µF Capacitor |
Digi-Key P4525TB-ND |
| R1 |
1 |
10K 1/4W Resistor |
Digi-Key A105970CT-ND |
| R2 |
1 |
22K 1/4W Resistor |
Digi-Key 22KAACT-ND |
| R3 |
1 |
100 Ohm Resistor |
Digi-Key 10QBK-ND |
| R4 |
1 |
10 Ohm Resistor |
Digi-Key 100DSCT-ND |
| SP |
4 |
1/2” Standoffs |
Digi-Key 3480K-ND |
| PH |
8 |
4-40 Screws |
Digi-Key 335-1082-ND |
| D1-8 |
8 |
Green LED |
Digi-Key C4SMF-GJS-CV0Y0792TB-ND |
| D9-14 |
6 |
Blue LED |
Digi-Key C503B-BCS-CV0Z0461-ND |
| D15-18 |
4 |
Yellow LED |
Digi-Key 897-1071-ND |
| D19-22 |
4 |
Pink LED |
Digi-Key 67-2062-ND |
| D23 |
1 |
Red LED |
Digi-Key C503B-RBN-CW0Z0AA1-ND |
| HDR1 |
1 |
40 Pin Male SIP |
SparkFun PRT-00116 |
| HDR2 |
1 |
40 Pin Female SIP |
SparkFun PRT-00115 |
| IC1 |
1 |
PICAXE 20M2 |
SparkFun COM-10807 |
| BATT |
1 |
4AAA Batt Holder |
RadioShack Cat# 270-411 |
| HLDR |
1 |
Document Holder |
Office Max SKU# 309264 |
| MISC |
Shielded 2 conductor wires for audio connection. |
Downloads
Chromaticon Code and Correct Schematic Image: ERRATA FIG1.jpg