Build an Oscilloscope Accessory That Displays the B-H Curves of Inductor Cores
A while back, I built a handy self-contained inductance meter (What the L is it?). It works well, but it registered nothing when I tested some inductors I’d picked up at a hamfest. I set up my old standby — a parallel capacitor, a signal generator, and an oscilloscope — and found these inductors were extremely lossy. As their cores were wound from metal tape, I wondered if they were designed to have square-loop characteristics.
I put together a device to display their behavior. Here it is.
Why Use Cores?
The field induced in a ferro-magnetic core by an applied current can be thousands of times higher than that generated in air by the same winding. Inductors with iron-dust or ferrite cores are much smaller than air-cored ones as they store more magnetic energy in the same space. They need fewer turns of wire so their resistive losses are lower, leading to a higher Q.
Such cores have three disadvantages. One is that if the core material conducts, it behaves like a resistive secondary winding and absorbs input power. Most cores are made either from high resistivity magnetic solids such as a ferrite or from very fine iron dust in a non-conducting matrix. Cores intended to reduce high frequency interference and oscillation are lossy and are unsuitable for tuned filter or DC-DC converter applications.
With a core, inductance depends on the current flowing. It’s high for small currents but falls enormously when some threshold — the saturation current — is reached.
Some cores remain magnetized after the current drops to zero. This effect is known as hysteresis. Early computers used tiny two-state cores to store data bits. At one time DC-DC converters used hysteresis to control their oscillation frequency. My unknown cores might have been intended for that use.
B-H Curves
Saturation and hysteresis can be explored by displaying a core’s B-H curve on an oscilloscope. This curve plots the relationship between the magnetic intensity (H) applied to the core and the resulting magnetic flux (B) in the core. It can be displayed on an oscilloscope switched to its X-Y display mode. In a toroid, H equals NI/L. N is the number of turns, I is the current, and L is the mean circumference of the toroid. Here, N and L don’t change so H is proportional to the current.
In this tester, the inductor current is swept linearly above and below zero. This current also drives the oscilloscope’s X input. The Y input is made proportional to the magnetic flux. This, as I’ll explain, is not measured directly.
In air B = H and the B-H curve is a straight line with unit slope. The ratio B/H is the relative permeability of the core. It may be as low as five in some dust cores and as much as 5,000 in ferrite cores. The curve is now much steeper; the oscilloscope’s Y gain must be readjusted to create a reasonable display.
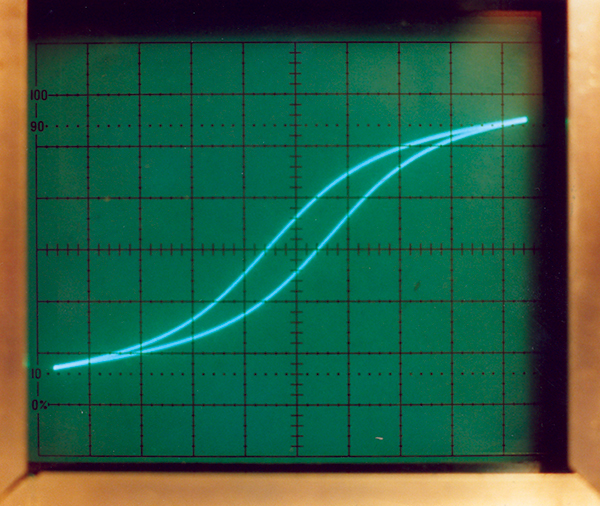
FIGURE 1. The B-H curve of a just-saturating 470 uH inductor.
Typical core materials show a straight line which curves towards the horizontal at both ends (see Figure 1). The curved tips show the core’s permeability falling at high currents.
Using the Curves
In many DC-DC converters, a constant voltage is applied to an inductor. Initially, the current increases linearly with time, storing energy in the inductor. When the current reaches the saturation level, the inductance falls and the rate of current increase rises. This increased current stores little additional energy in the inductor but may damage the switching transistor. In DC-DC converters, inductors nearly always operate below their saturation level so this level is essential design information.
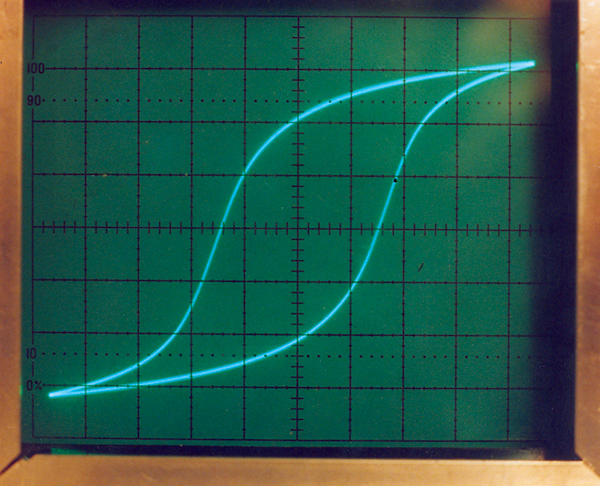
FIGURE 2. This noise filter toroid won’t make a high-Q inductor.
Low-loss core materials have a B-H curve in which the positive- and negative-going curves almost match. A loop with a gap between the two traces, as in Figure 2, reveals both core losses and residual magnetization. I’d wound this inductor on a large ring used as an interference suppressor in an old keyboard.
The B-H Instrument
For clarity, I’ve split the tester schematic into the ramp current generator (Figure 3) and the core analyzer (Figure 4). The part numbers are sequential across both figures.
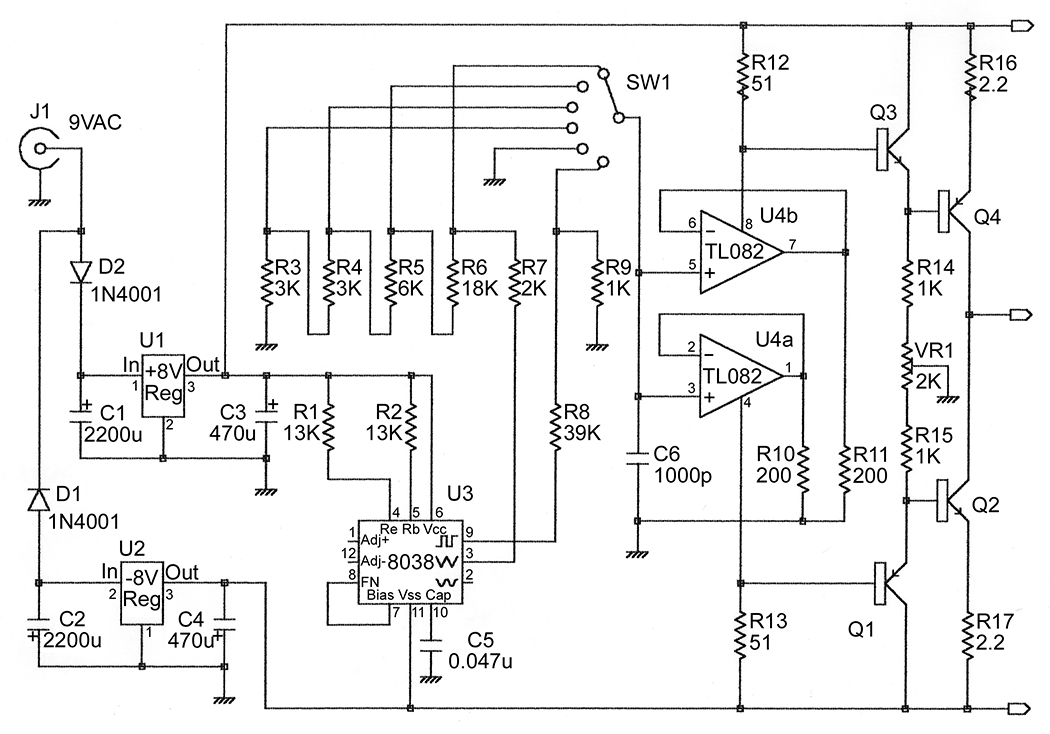
FIGURE 3. The ramp current generator.
The current ramp drives the inductor under test with equal positive and negative peak currents. These are adjustable up to 0.5 amps with switch SW1. A one ohm resistor (R18) in series with the inductor measures the actual current flowing and supplies the horizontal (X) sweep signal for the oscilloscope.
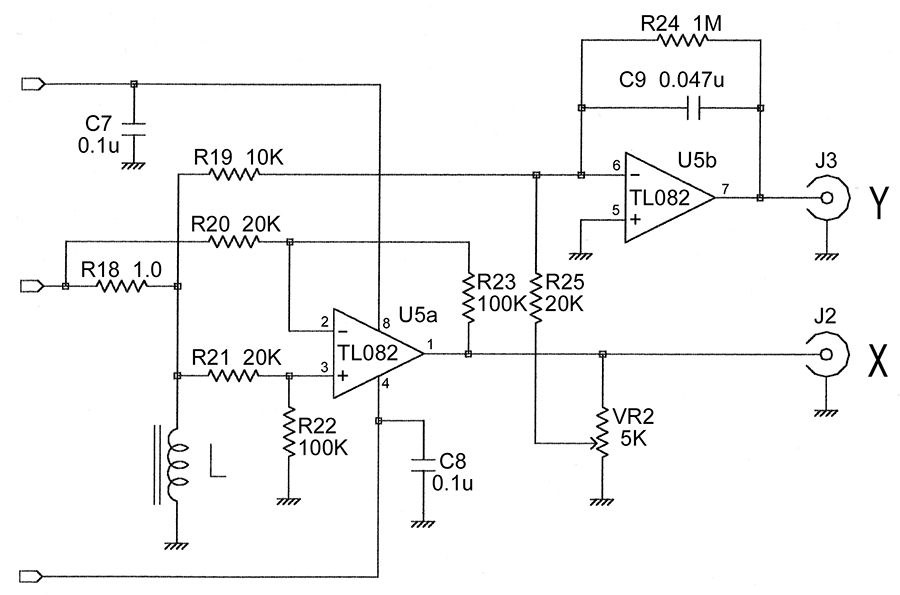
FIGURE 4. A differential amplifier measures the current. An integrator supplies the vertical signal.
It isn’t practical to directly sense the flux in the core so it’s calculated from the coil voltage. Since the rate of current change is constant, this voltage is proportional to the coil’s inductance. With a pure inductor, it would be a square wave with positive and negative values proportional to the inductance times the rate of change of the current. If the permeability changes, then so does the inductance and the voltage changes accordingly.
For the oscilloscope’s vertical (Y) input, we want a voltage that rises linearly to match the increasing current. This is achieved by feeding the inductor voltage to an integrator. This cancels the differentiation of the input current by the inductor. The result is a curve whose slope represents the permeability.
In an integrator, any input offset causes the output to grow without limit. As there should be no net DC voltage across the inductor, the mean Y voltage must be zero. This is emulated by placing a 1 megohm resistor (R24) across the integrating capacitor. This doesn’t materially alter the displayed curve but any net DC Y output should be ignored.
Real Inductors
Any real winding has some resistance so the voltage across an inductor has a term proportional to the drive current. Since the X voltage is a linear function of the current, we can subtract a little of it from the coil voltage to correct for the winding resistance. VR2 lets you make this adjustment for windings up to 2.5 ohms. Switch SW1 has a calibration setting which applies a current square wave to the inductor under test.
With the oscilloscope in its normal mode, the resulting Y output should also be a square wave. Any tilt in its horizontal sections reveals a resistive imbalance that should be trimmed out. In practice, I found I could adjust VR2 to give a plausible B-H display in the normal test mode. Loops whose tips cross themselves show misadjustment.
Design Details
This tester arose from my interest in inductors for small DC-DC converters. Thus, the test range is 10 to 1,000 mH and the maximum test current is 500 mA. The latter limit let me power the tester from a conventional wall-transformer and to use rather skimpy heatsinking.
The time taken to sweep the current from -500 mA to +500 mA depends on the voltage one wants across the maximum inductance. I chose the peak-to-peak voltage for a 1 mH inductor to be 2V.
A voltage (V) across an inductor (L) causes the current through it to increase at V/L amps per second. One volt across 1 mH causes a 1 A/ms current change. The opposite also applies; a 1 A/ms rate of current change induces 1V across a 1 mH inductor.
The maximum test current ramps from -0.5A to + 0.5A in 1 ms. This induces a +1V signal across the reference inductor. As the current ramps down from plus full scale to minus full scale, the inductor voltage becomes -1V, giving the desired 2V peak-to-peak signal. As the test signal ramps up for 1 ms and down for 1 ms, the repetition rate is 500 Hz.
Making a Ramp
I avoided a lot of board clutter by using an ICL8038 signal generator chip (U3) to create the ramp waveform. This chip contains the necessary switched current sources, comparators, and buffer amplifiers to generate a ramp having equal positive and negative peaks. It also has sine and square wave outputs. The latter supplies the test signal for setting VR2.
The ramp length is controlled by two equal resistors and a capacitor. The capacitor (C5) is 0.047 µF and should be plastic foil, not ceramic. The resistors (R1 and R2) should be 1% types and, ideally, should be matched. The six-way switch (SW1) selects one of four output peak amplitudes: 50 mA, 100 mA, 200 mA, and 500 mA. It also selects the square wave and zero.
Driving Current
An ordinary op-amp can’t supply a bipolar current output. Here, I used an old trick. An op-amp drives a load resistor and its power pins supply positive and negative drive currents to a push-pull output stage. The op-amp used should have an output stage with matching NPN and PNP transistors. The TL081 would be ideal, but I only had TL082 (dual) and TL084 (quad) amplifiers in stock. I used both halves of a TL082 and gave each half its own 200 ohm load resistor.
The current driver runs open-loop. I tried feedback from the current-sensing resistor but it was unstable when driving a test inductor. This version assumes that the op-amp’s output and supply currents change in step and that the driver stage has a well-defined gain. It uses modified PNP and NPN current mirrors.
Each power transistor (Q2 and Q4) has a large emitter resistor that drops over a volt at the current peaks. These transistors are driven by opposite polarity emitter followers so the base-emitter voltages of each pair roughly cancel. The drivers’ bases are connected to the amplifier’s power pins and to the power rails via 51 ohm resistors (R12 and R13).
The current gain of this combination is 23. Apart from about 3 mA of static current, the amplifier’s power currents equal the current flowing through its combined 100 ohm load. That is, a 100 mV amplifier input generates 23 mA at the driver output. SW1 selects a suitable drive voltage for each current range. C6 reduces noise and stray feedback and makes the current ramp much cleaner.
The op-amp’s static current causes the output transistors to pass nearly 100 mA when the output current is zero. I tried reducing this, but only introduced cross-over distortion. We must just live with about 1.6 wasted watts. The regulators’ and transistors’ peak dissipation is around 5W, but no heroic heatsinking is required.
The output transistors’ base currents are adjusted to balance out offsets. Short the inductor terminals and set the switch to its grounded input position. Measure the voltage across R18 with a multimeter on its 200 mV scale and adjust VR1 until the meter reads zero. The specified output transistors have current gains exceeding 150 at 500 mA. Many popular power transistors have lower gains and won’t work unless R14, R15, and VR1 are reduced to supply more base current.
Why Eight Volts?
The current driver doesn’t need more than about +-2V of output compliance, so bipolar 5V power rails might have sufficed. However, at a current peak the input to the current mirror is 1.3V less than the positive or negative power rail. If the main power were ±5V, the net supply to the op-amp would be about 8.5V. Since the TL082 is rated for 10V minimum, I boosted the power rails to ±8V to avoid risking odd non-linearities. This means hunting down 7808 and 7908 three-terminal regulators. By the way, I used 2,200 µF reservoir capacitors for space reasons, 4,700 µF ones would be better.
I/V Sensing
One end of the inductor under test is grounded. This makes measuring the voltage across it easy, but you need a floating current-sensing resistor (R18). A differential amplifier (U5a) drives the scope’s X input with a scale factor of 5V per amp. The inductor voltage goes to the integrating amplifier (U5b) whose output drives the scope’s Y input. As mentioned above, an adjustable amount of the X voltage is fed to the integrator input to compensate for the inductor’s winding resistance.
The control switch has an off position that shuts off the ramp generator. Ideally, it should be put in this position before removing the inductor under test. The output voltage swings from one power rail to the other if you don’t.
Construction
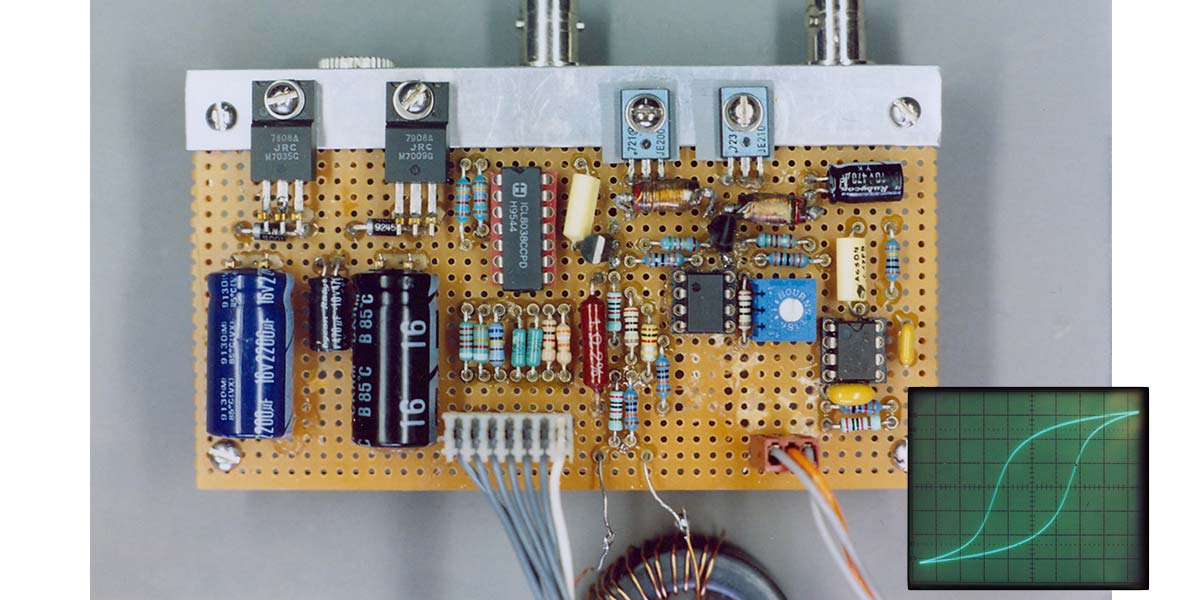
I built this project on a piece of perforated board (see Figure 5), intending to put it into a plastic or metal box at a later date. I’d already cut a 2.5” by 4.6” board, so I juggled things to fit. To simplify making changes, I used wire-wrap sockets for all the small components. This adds considerably to the board height and you might be more comfortable using PC sockets and sleeved bus wire.
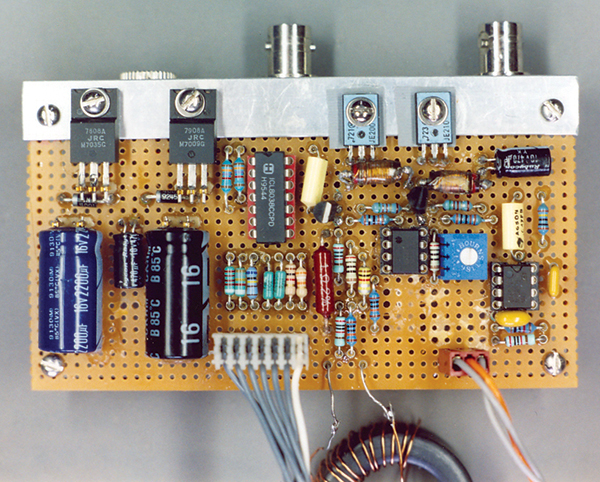
FIGURE 5. The unboxed B-H tester board.
The back edge of the board is fitted with a length of 0.5” by 0.75” aluminum angle. This supports the power input socket and the two BNC sockets that connect the unit to the oscilloscope. It also acts as a heatsink for the power regulators and the two output transistors. If you put the board in a case, this angle fits flush against one wall so use a metal box.
Power comes from a 9 VAC wall transformer. Mine is an old RadioShack one rated at 780 mA. These ratings are about the minimum acceptable for this application. If you use a 12 VAC or higher voltage transformer, you’ll need a bigger heatsink.
The inductor under test can be connected with banana-pin screw terminals. You can get away with a foot or so of test lead between the tester and the inductor; we’re not talking RF here.
Applications
This tester can be used to analyze a core material or to evaluate a finished inductor. In the former case, as many or as few turns as one needs may be put on the core. Use the highest test current to avoid winding more turns than necessary. The loop’s Y voltage depends on the inductance so you may run out of scope gain if you try to test very small inductors. The results you get tell you what type the core is. As Figure 6 shows, my unknown cores were definitely square-loop devices.
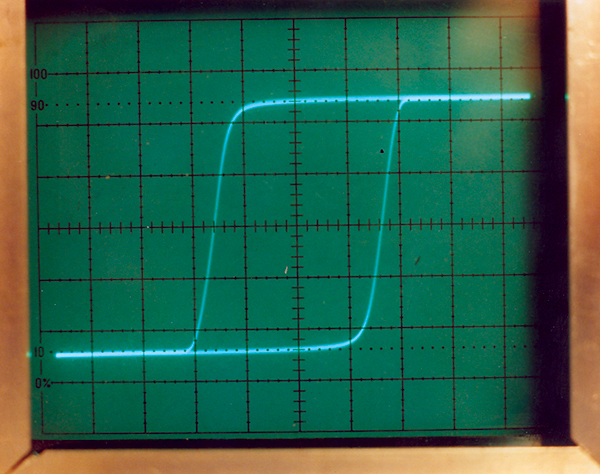
FIGURE 6. As suspected, my metal tape cores show a square loop.
When testing a pre-wound inductor, the parameter of interest is its saturation current. The test currents let you focus in on the most interesting part of the curve. Some inductors may not saturate even at the highest test current. This design could be adapted to considerably higher currents, but I’ll leave that development to the more intrepid readers. NV
PARTS LIST
| Item |
Description |
Item |
Description |
| U1 |
+8 V regulator, 7808, JRC |
R8 |
5% resistor, 39K |
| U2 |
-8 V regulator, 7908, JRC |
R9 |
5% resistor, 1K |
| U3 |
Function generator, ICL8038, Harris |
R10, R11 |
1% resistor, 200 ohm |
| U4, U5 |
Dual op-amp, TL082, TI |
R12, R13 |
1% resistor, 51.1 ohm |
| Q1 |
PNP transistor, 2N3906 |
R14, R15 |
1% resistor, 1.0K |
| Q2 |
NPN power transistor, MJE200, ON Semiconductor |
R16, R17 |
2% resistor, 2.2 ohm 0.5 W |
| Q3 |
NPN transistor, 2N3904 |
R18 |
2% resistor, 1.0 ohm 0.5 W |
| Q4 |
PNP power transistor, MJE210, ON Semiconductor |
R19 |
1% resistor, 10.0K |
| D1, D2 |
1A rectifier, 1N4001 |
R20, R21 |
1% resistor, 20.0K |
| C1, C2 |
Electrolytic capacitor, 2,200 µF 16V |
R22, R23 |
1% resistor, 100K |
| C3, C4 |
Electrolytic capacitor, 470 µF 10V |
R24 |
1% resistor, 1.00 M |
| C5 |
Plastic capacitor, 0.047 µF 50V |
R25 |
1% resistor, 20.0K |
| C6 |
Ceramic capacitor, 1,000 pF 50V |
VR1 |
Trimmer, 2K |
| C7, C8 |
Ceramic capacitor, 0.1 µF 50V |
VR2 |
Variable resistor, 5K |
| C9 |
Plastic capacitor, 0.047 µF 50V |
L |
Inductor under test |
| R1, R2 |
1% resistor, 13.0K |
SW1 |
Six-way switch |
| R3, R4 |
1% resistor, 3.01K |
J1 |
Coax connector to PSU |
| R5 |
1% resistor, 6.04K |
J2 |
BNC connector (X output) |
| R6 |
1% resistor, 18.2K |
J3 |
BNC connector (Y output) |
| R7 |
1% resistor, 2.21K |
9 VAC 800 mA wall-transformer |