My "Poor Man's Seismometer" project, from the Nuts & Volts May 2012 edition, generated a lot of email activity — especially since geophones became available for $15 on eBay. Geophones increase the sensitivity and make for a small unit. So, I decided to follow up with a three-axis accelerometer, which is an adjunct for seismology.
Accelerometers can be used in many applications. For those who are studying vulcanology, accelerometers can be used for determining which direction the magma is moving using the Z axis. The sensor being utilized measures in three dimensions, using an ST Microelectronics 2-16 g LIS3DSH accelerometer.
In my first design, I used a Freescale Semiconductor 2-8 g three-axis accelerometer eight-bit A/D. However, the ST model (which is 16 bits) is 256 times more sensitive, and has a FIFO register which allows you to see activity just prior to an earthquake. ST also makes a 100 g to 400 g sensor which plugs in, replacing the lower g unit if you are interested in impact gs or a shipping monitor.
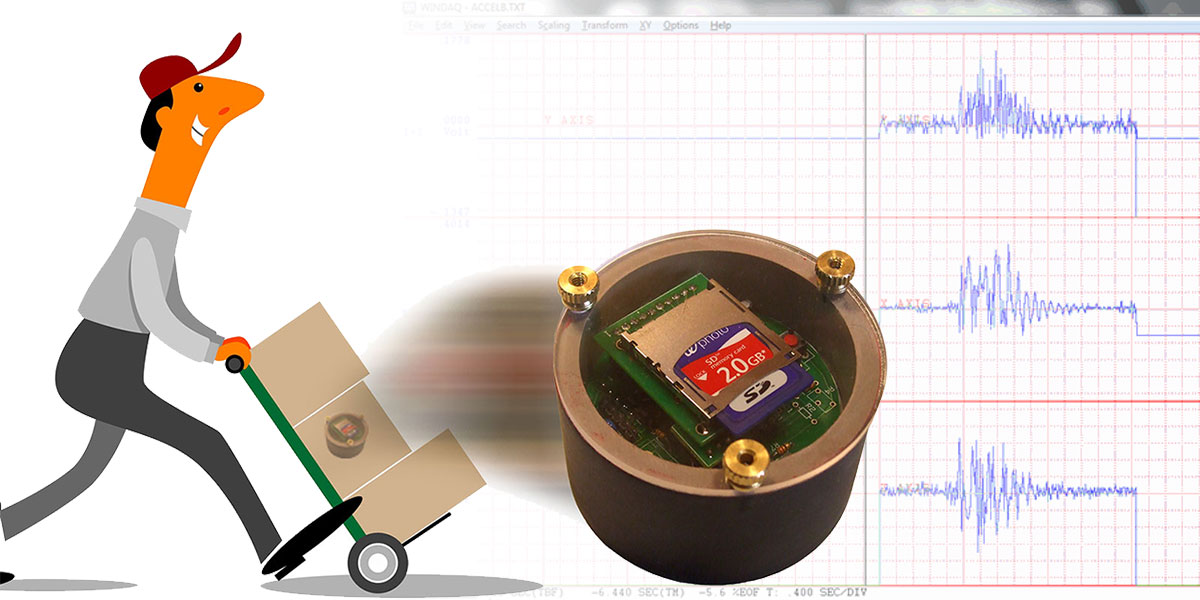
I designed this project so that it can be programmed utilizing the same SD card as the previous seismograph article used. Figure 1 shows the low g accelerometer which can be used as a seismograph, continuous monitor, or a tripping monitor.
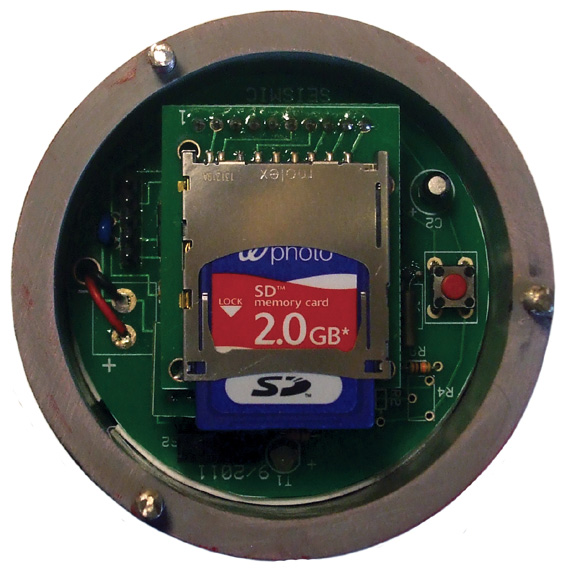
FIGURE 1.
The data collected on the SD card can be downloaded into a computer and displayed using either Excel or the Dataq web browser (which is free software from Dataq). All three dimensions are displayed at the same time, giving the date, time, and parameters.
There are two main types of scales for measuring earthquakes: the Richter and the Mercalli. The Richter scale is logarithmic and was developed in 1935. Each number represents 10 to that power. An earthquake of three is about what most people can feel: 103 = 1000. The San Francisco, CA quake in 1906 was estimated to be an eight: 108 = 100,000,000. This is 100,000 times more powerful than a three.
The Mercalli scale is an arbitrary measurement based on what people feel. It was revised in 1902, and is a 12-point scale. The San Francisco quake equates to an X or XI on the Mercalli.
Gravity is the force pulling things down, and accelerates objects 9.8m/s2. For something to leap in the air during an earthquake requires a force wave traveling above 9.8m/s2 (1 g) which is equivalent to an 8.1 on the Richter, or an 11 on the Mercalli scale.
The sensor used in this article can measure down to .00006 per digit, or 0.00006m/s2 (Figure 2).
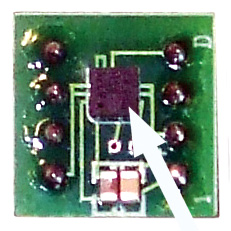
FIGURE 2.
This would be a 2-3 on the Mercalli scale or about a 2 on the Richter scale. The accelerometer is more akin to the Mercalli scale than the Richter scale. What the accelerometer does over the seismograph is to give you a three-dimensional view of the g forces involved. This is an engineer’s dream tool for studying structural engineering.
In the seismograph mode, once an earthquake above .001 g is detected on the X or Y axis, it records all three axes onto the SD chip for one minute using the 2 g sensitive mode. As far as using it as a seismograph, it will not be as sensitive as the poor man’s version (Figure 3) but will work for slightly larger earthquakes, showing the direction of the waves and their g force. The earthquake is determined using the zero crossing mode which makes it very sensitive.
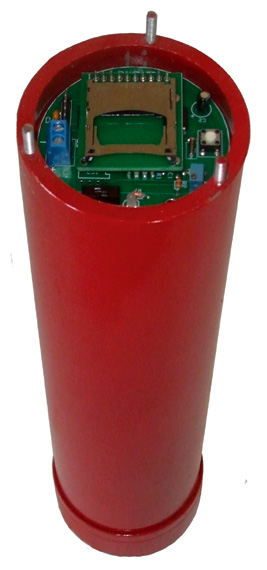
FIGURE 3.
For a continuous monitor, all three axes are watched on any of the settings of 2 g, 4 g, or 8 g. This is also set using an Excel spreadsheet. It will continue monitoring until the program button is pressed.
The continuous monitor has many applications, e.g., racing cars, model airplanes, rocketry, etc. The SD card size will determine how long it will record; it records 50 samples per second. How about a physics project of building a container that contains an egg and dropping it from a height of 20 feet without breaking it? This device will tell you the forces involved. With drones all the rage now, how many gs can they pull?
The trip mode allows the user to set the tripping threshold from 0 g to 15 g. The data collection rate — along with amount of time recorded — is programmable.
The sensors measure 3 x 3 mm. The lower g sensor cost is minimal — around $3. They are quite difficult to solder, however, and there is no use in ruining the larger board which holds the microprocessor and SD card. I mounted the sensor on an eight-dip header (Figure 4).
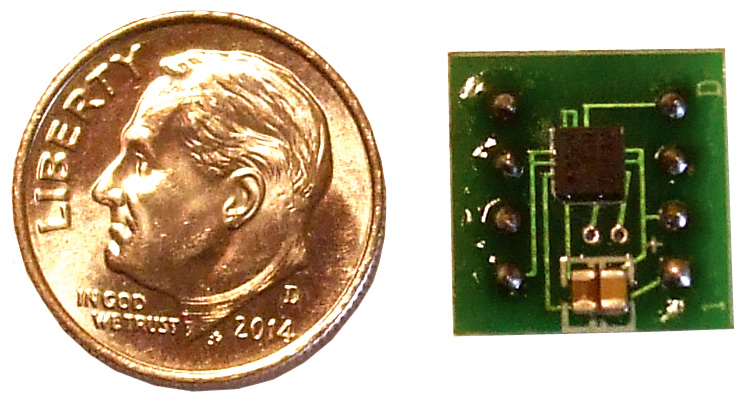
FIGURE 4.
If you wonder why the chips are so inexpensive, they are mass-produced for handheld computers and detect if they are shaken, jarred, and rotated or tapped just by utilizing g forces. They use two capacitors with a plate in between and measure the change of capacitance between them.
The LIS3DSH has an analog to 16-bit A/D (analog-to-digital) converter and transmits the data using the I2C protocol. By using the two’s complement, it gives positive or negative g forces. The first 15 bits give 215 = 32,768 bits of information. The 16th bit changes the sign, and the following data bits are another 32,768 bits of information.
The unit has a built-in clock which is programmed with the SD card. There is a power switch and pushbutton switch that program the unit. A bi-colored LED acts as an indicator for programming.
When the g force exceeds a predetermined amount, it starts the recording and indicates by a flashing LED that data has been collected. The unit draws 1 mA when in sleep mode. Two AAA batteries will provide power for about 40 days. For a lighter weight version, a lithium coin cell can be used, which should last about 10 days. After recording, the SD card is removed and downloaded to a regular PC.
Ever wonder how hard the post office or UPS throws your package marked fragile? By changing the accelerometer chip to the ST 100-400 g, this device will show you. Its tripping point can be set from 1 g to 400 g on all three axes. It normally records for five seconds and then goes to sleep. The recording time can be changed in the Excel spreadsheet. The advantage this unit has over static g monitors is that this one dates and times the events.
For example, a three foot drop on a hard surface can produce up to 40 gs. It will date and time the event happened when its tripping point is exceeded, but will not show the amount of gs since it does not have FIFO capabilities. If you need this feature, you can run the unit in continuous mode.
Electronics
The microprocessor used is a Microchip 16-bit PIC24J64GA200. Programming pins are made available on the board for use with PICkit 2 or 3 programmers. The software is free from Microchip. To change the programming, you need to know how to program using C. There is plenty of documentation on how to interface this chip with SD cards. (Refer to the October 2010 “Implementing a File I/O for the 16-bit Micro Experimenter” by Thomas Kibalo as one example.) If you don’t have a programmer, a pre-programmed chip is available at the NV webstore.
The power for this chip is three volts; the accelerometer chip has a range of 2.4-3.6 volts.
If you want to make your own boards, the Express PCB files are at the article link. Express PCB provides free software at www.expresspcb.com.
The SD card sits above the microprocessor and is easy to remove. The board is round to fit in a 2.5” PVC EMT tube.
The microprocessor talks to the accelerometer using I2C. The accelerometer has a built-in A/D converter and outputs the results in digital form. The micro is put to sleep in the seismic and shipping modes, thus it draws very little power.
The SD card programs the micro with the date, time, mode, and tripping point. There is an Excel program at the article link to program the SD card. Each time an event happens, the date, time, and results, are recorded on the SD card. The files are named Accel1.txt, Accel2.txt, etc.
Each event advances the name of the file up to 1,000 names. The LED will flash every four seconds indicating that an event has taken place.
The card can be removed any time by turning off the power and placing it into a computer for downloading and viewing.
Constructing the Board
There are three boards used for this project: a square board, a round board, and the accelerometer board. (The accelerometer board comes assembled in a kit, also available through the NV store.)
Turn the square board over and solder the five 10K 805 surface-mount pull-up resistors. The best way of doing this is to melt a small amount of solder to the top six pads. Using tweezers to hold the 805s, touch the tip of the soldering iron to the pad and place the 805 on the pad allowing the solder to flow to the resistor. Do this for the rest of the resistors.
Now, solder the other side of the resistor to the pads (Figure 5).
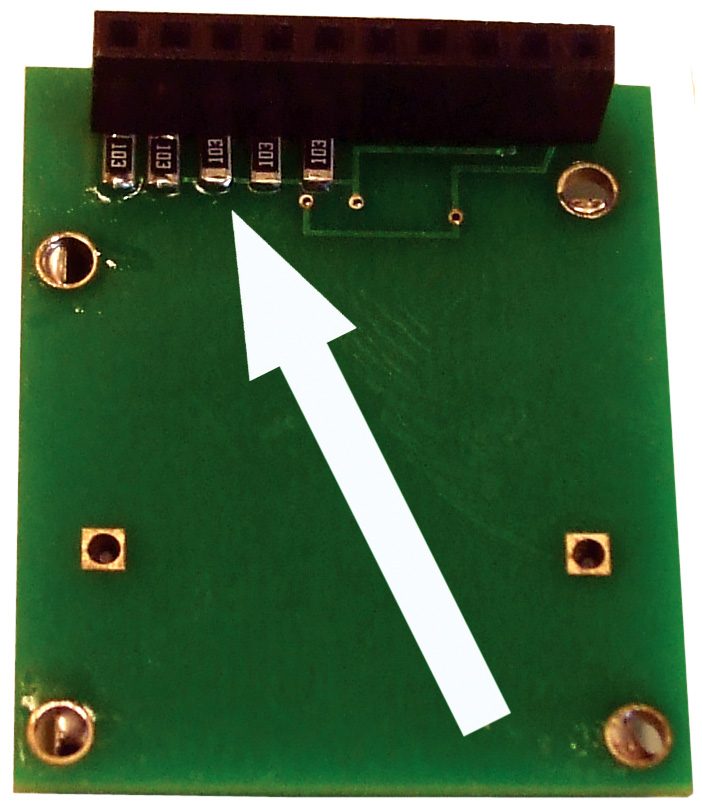
FIGURE 5.
Make sure you use rosin core solder; I normally use a .6 mm diameter. Turn the board over and solder the SD holder to the top side. Solder each of the pins and ears in their respective holes. Push the 10 female headers from the bottom side of the board and solder.
The round board will need to be trimmed to the outside circle. The easiest way is to use a sander. All the components are placed on the top of the board.
Solder IC2 to the board. Note the square hole is pin 1 of the chip. Place the chip in front of you with its notch pointing left. Pin 1 is the lower left pin. Usually, there is a small dimple above it. There will be a number of areas vacant, so don’t panic. These were for the previous seismograph article, and are not included in the Parts List.
| ITEM |
QTY |
DESCRIPTION |
SOURCE/MODEL # |
NOTES |
| Battery Holder |
1 ea |
Two AAA batteries |
|
|
| C2 |
1 ea |
10 µF 16V |
|
|
| C3 |
1 ea |
.1 µF 100V |
|
|
| C4-C5 |
2 ea |
33 pF 100V |
|
|
| Header 1 |
10 ea |
.1 vertical male |
|
|
| Header 2 |
10 ea |
.1 vertical female |
|
|
| IC2 |
1 ea |
PIC24FJ64GA002 |
Microchip |
|
| R7 |
1 ea |
330 ohm 1/8 watt |
|
|
| R6-R8 |
2 ea |
10K 1/8 watt |
|
|
| R9-R13 |
5 ea |
10K 805 |
|
|
| S1 |
1 ea |
SPST tactile red |
Tl1105F250Q |
E-switch |
| S2 |
1 ea |
SPST slide switch |
EG1903 |
E-switch |
| SD Holder |
1 ea |
SD-I/O memory card holder |
0678408001 |
Molex |
| T1 |
1 ea |
Bi-colored LED |
|
|
| X1 |
1 ea |
32.768 kHz 6PF CYL |
|
|
| 2-16 g LIS3DSH accelerometer mounted with capacitors |
Nuts & Volts Webstore |
|
| 100-400 g H3LIX331DLTR accelerometer mounted with capacitors |
Nuts & Volts Webstore |
|
PARTS LIST.
Solder resistors R3-R6, R8, R14, and R15; capacitors C2, C3, C4, and C5; and the crystal. Note the polarity of the 10 µF cap. Solder the two switches, then the LED with its long lead going to the square pad.
Push the 10 male headers into the top of the board where the in-line 10 pads are and solder. There will be extra pads next to the microprocessor that can be used for other projects
Pass the two wires of the battery holder through the strain relief hole and solder them to their pads. If you are going to use the accelerometer as a seismic detector, I recommend you use D batteries so you won’t have to change them so often. D batteries should last about a year.
The chip can be programmed or re-programmed repeatedly using a Microchip PICkit 2. The square pad is pin 1 for the programmer. There are only five pins needed (the sixth is redundant).
Container Construction
The container is made out of a 1.4” piece of 2.5” EMT PVC pipe. Both the top and the bottom of the pipe should be smooth.
You will find a template for the Plexiglas lens at the article link. Cut it out and glue it to a 1/4” piece of Plexiglas. Sand the Plexiglas to the edge of the circle. Using a 9/64 drill, make three holes. Remove the template using hot water. Place the lens over the smoothed end of the PVC pipe and mark the pipe where the holes are. Using a #36 drill, make the three holes 1/2” deep. Tap each hole with a 6-32 tap.
Using three 1” screws, add a drop of “super glue” to each hole and drive each screw into the PVC pipe. Use a cut-off tool and remove the heads. Glue a second piece of Plexiglas on the bottom. The top lens is secured using three knurled nuts.
Cut a piece of .06” x .125” Styrene plastic strip to 7.75 inches. Bend the strip and place it 3/4” from the top edge of the PVC pipe. Again, using super glue, attach the strip in place. This will act as a support for the board.
If you don’t want to build the holder, the available kit comes with a tin container which the battery holder and the PCBs fit into. Just add your own foam insulation.
Using the Unit
Plug in the accelerometer that you are going to use. Plug in the SD card holder to the 10 pins. It will rest on the accelerometer board (Figure 6).
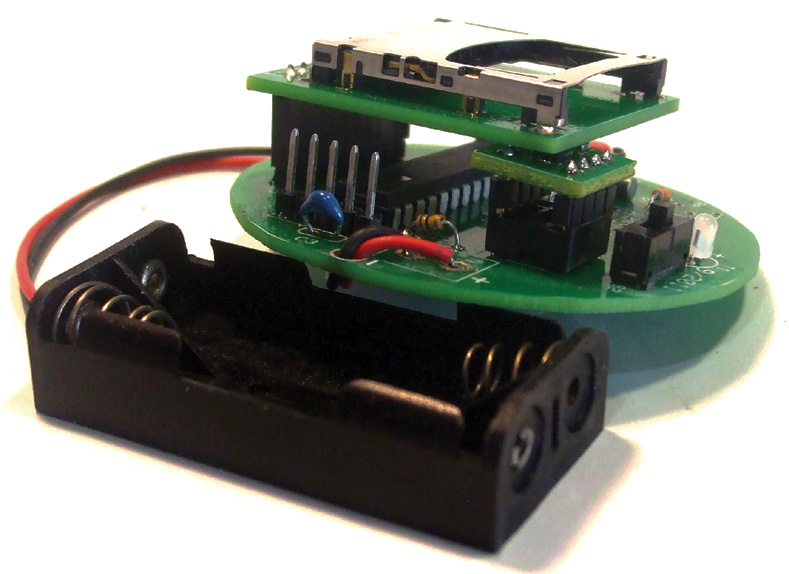
FIGURE 6.
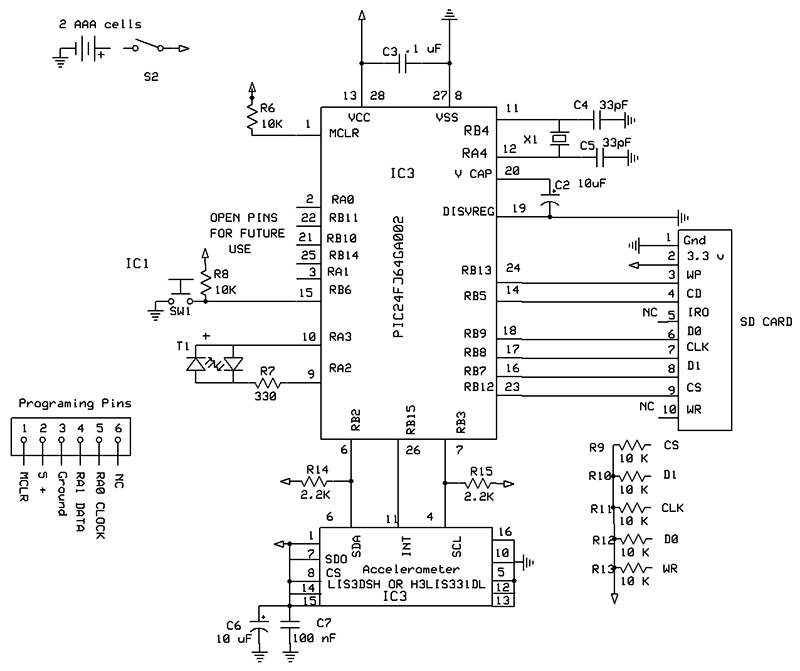
SCHEMATIC.
The modes and several parameters of the accelerometer are set by programming the SD card using an Excel spreadsheet. Make sure you have the right spreadsheet. There are two: one for 2-16 gs and the other for 100 gs-400 gs.
Using your computer, format an SD card from 256 MB up to 2.0 GB using Fat 32. We are now going to set the time in the microprocessor’s clock. (NOTE: If the power is turned off, the micro’s clock will be lost.) Download the Excel sheet titled “Accelerometer Programming 2g-16g” or “Accelerometer Programming 100g-400g.” Follow the directions in the spreadsheet. The time is written to the SD card using a BCD format in hexadecimal code. Ten six-bytes of code in one long statement are stored in time.txt. Make sure you pre-program the time ahead to allow enough time to place the card into the unit.
Seismic Detector
In the Excel spreadsheet, type in an x next to Seismograph. Load the card and turn on the unit. The LED should be red. Watch the clock, and when it reaches the proper minute, press switch 1 and release. The LED should flash green, indicating that the micro’s clock has been set to the time you programmed on the SD card.
Once you have located the area where you are going to place the seismograph, you can activate it by pushing the switch. The LED will turn on steady red for one minute. This will allow you to put the lens on and secure it with the knurled nuts. When the red LED goes out, it indicates that it is armed.
When the unit is jarred or an earthquake happens, the data will be written to the SD card and the LED will turn green, indicating that it is making a measurement. Once the unit has made a one minute measurement, the LED will flash red about every four seconds, indicating that an earthquake (or event) has occurred.
When you are ready to read the data, remove the lens (this will activate the unit and record the jarring from the removal, but will also end up as an invalid txt file). Turn the power off and remove the SD chip.
Continuous Monitoring
In the Excel spreadsheet, type in an x next to Continuous Monitor and load the card. Turn on the unit; the LED should be red. Watch the clock, and when it reaches the proper minute, press switch 1 and release. The LED should flash green, indicating the micro’s clock has been set to the time you programmed on the SD card.
Press the switch; the LED should flash red and go dark, indicating that it is collecting data. I turned the LED off to save battery power. To stop recording, press the switch again. The LED should turn red. Turn the power switch off and remove the SD card. The g ranges can be changed to 2 g, 4 g, 8 g, or 16 g using the spreadsheet. Note: When the unit is used for continuous monitoring, the SRAM card becomes a power hog pulling 25 mA constantly, whereas the seismic mode or tripping mode only pulls 1 mA.
Tripping Monitor
In the Excel file, type in an x next to Tripping Monitor. You’ll need to type in the trip point you want the unit to start recording at. This can be 0 .1-15 g. Follow the instructions for loading the Notebook file in the spreadsheet.
Load the card and turn on the unit. The LED should be red. Watch the clock, and when it reaches the proper minute, press the pushbutton switch and release. The LED should flash green, indicating the micro’s clock has been set to the time you programmed on the SD card.
Once you have decided where you are going to place the shipping monitor, you can activate it by pushing the button. The LED will turn on steady red for one minute. This will allow you to put the lens on and secure it with the knurled nuts. When the red LED goes out, it indicates that it is armed.
When the unit is dropped, jarred, or thrown, and exceeds its trip point, it will record for five seconds (this can be changed) when an event happens. The data will then be written to the SD card. Once the unit has made a measurement, the LED will flash red about every four seconds indicating the trip point has been exceeded. NOTE: Only one mode can be used at a time.
Viewing the Data
Using Excel for Downloading Data
Excel can be used for short runs, but can only hold 1,048,576 readings and will only graph 32K. The Dataq Waveform can hold a lot more. However, the Excel is easy for reading one minute seismic data.
- Open Excel.
- Click on the Office Button (very upper left corner) and then Open.
- Change the All Excel Files to All Files in the bottom right corner.
- Locate the SD card and click on one of the Accelx.txt files.
- Make sure the Delimited box is checked, then click Finish.
- The file will load.
- Put the cursor on A8 and hold down the shift and Ctrl; use the down arrow and it will highlight column A. Press the right arrow button and it will highlight all the cells. You don’t have to use the whole file.
- Click on Insert, then Line, and the top middle chart. The chart will display the data.
I hope you’ll be able to shake things up with this unit. Happy egg dropping! NV
STEPS TO USE THE WINDAQ WAVEFORM BROWSER
Getting rid of the header:
- Insert the SD card into your computer.
- Open the file in Excel as described in the text.
- Remove any header and date.
- Remove blank cells by using “Delete Sheet Rows.”
- Save the file with a different name (as a txt file).
Putting your Accelx.txt file into WinDaq:
- Open the WinDaq Waveform browser.
- The screen will flash “WinDaq Waveform Browser” and then “WinDaq Playback Open.”
- Change the file type to txt mode.
- Load the file which you just named.
- Click on Open. The text file will need to be converted to a wdc file, e.g., Seis1.wdc.
- Use a spreadsheet file.
- Rename and save. A new black screen will open. In the center area, it will probably display “Translating 3 Channels” of data.
- Press return and the graph will pop up.
Using the Graph:
- Click on Options, and then click on Cursor Time.
- At the bottom of the screen, the time and date the data was collected will display.
- If you place the cursor under the black line and below the last red line, you will be able to read the number of seconds since the start.
- Use the keyboard arrow keys to see the rest of the chart.
HINTS & TIPS FOR THE HOCKEY PUCK ACCELEROMETER
To view and change the board files and schematic, go to www.expresspcb.com and download their free CAD software. There is no obligation and you will not be harassed by emails.
Microchip provides free software for programming their microprocessors at www.microchip.com.
MISSING PARTS LIST
The following parts are not needed:
R1, R2, R4, C1, IC1
These were used with the "Poor Man's Seismometer" published in the Nuts & Volts May 2012 edition.
DOs AND DON'Ts
If data won't record on the SD card, check to see (with Notepad) if Accel1 is corrupt. If it is, reformat the SD card and add time.txt.
If no file recorded on the manual setting, make sure you stop it by pushing the button. If you just turn off the power, the file will not close.
If the green LED doesn't flash, make sure the SD card is in place and locked.
When using a high g impact, I recommend using solder tab batteries. When mounted in the battery compartment, they tend to break contact upon impact and reset the machine. The red LED will turn on if this happens.
Although both chips have the ability to collect data up to 1,600 Hz, do not exceed 50 Hz as writing to the SD card along with the micro won't keep up.
When using continuous mode, be aware the unit pulls 25-30 mA Use a hefty battery for long runs.
I use the new Notepad++ for viewing raw data. It is free software.
USING THE WINDAQ WAVEFORM BROWER:
To view the data, go to www.dataq.com and download their free software titled WinDaq Waveform Browser (Figure A) under downloads.
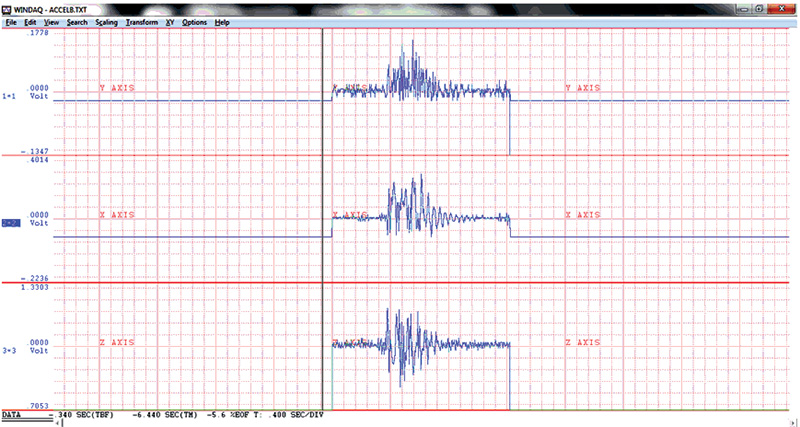
FIGURE A.
For those that are interested in great data loggers and data acquisition, I can't say enough good things about WinDaq. The browser is also located at the article link.
WARNING: YOU MAY HAVE TO REMOVE THE HEADER INFORMATION FOR THE FILE USING NOTEPAD.
Once the Waveform Browser is downloaded, there should be an icon on your computer; click this icon.
A window should open up. Locate the SD card and make sure you have Files on the *.txt type. Look for the Accel1.txt file or other numbered seismic files.Click on this. Save Accel1.wdc (default). Use the #15 spreadsheet print file (ASCII) with fixed scale. Add an "a" after the file name and save. The convert screen should pop up with “Translating 3 Channels.” Put in 50 for the sample rate per channel and the default on volts. Hit the return key. (This is subject to change depending on what version you have of the browser.)
The Waveform Browser should now be visible. If you go to Options and click on Cursor Time, the date and time will show at the bottom when an earthquake happened. Moving the cursor below the red line will show the time. By pressing F4 to place a time marker, you can measure from the time marker the seconds from an event.
You can increase the amplification by centering the wave form (Z axis), changing the voltage:
- Place the cursor on 3=3 and right-click.
- Hold down the right button and make a box around the first data.
- Drag the box so that the data is approximately at the center line.
- Put the curser back on 3=3 and right-click; this will reduce the spread voltages.
There is a plethora of commands you can use in the WinDaq browser, so I defer you to their help menu as it would take a small book to explain them all. Once you have downloaded your data, delete all the Accel.txt files on the SD card to re-record.