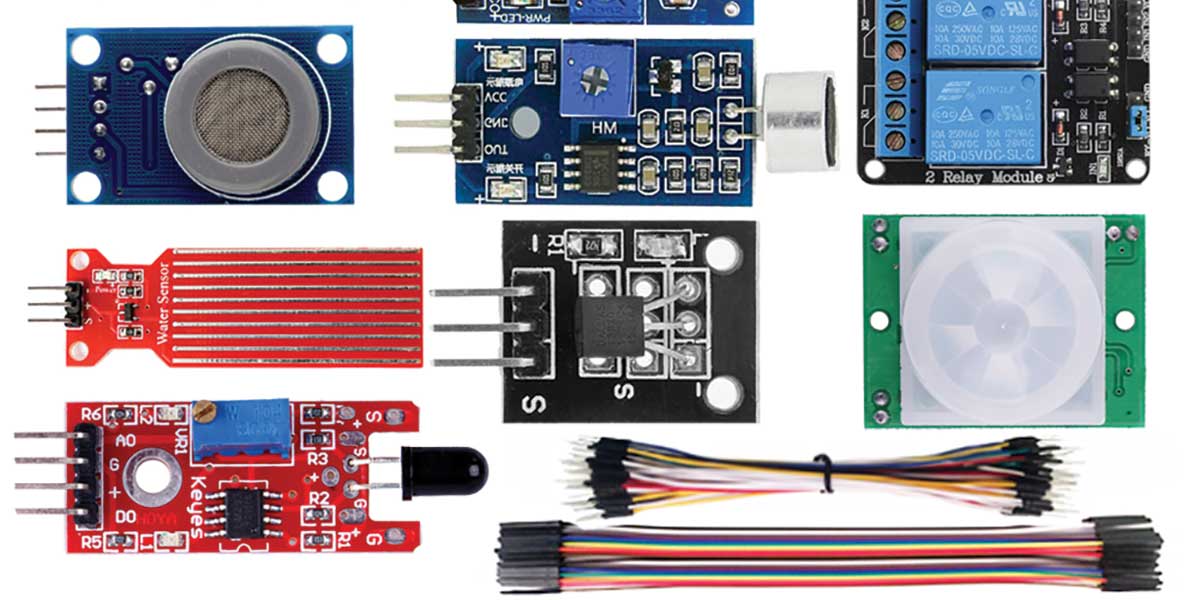
See how to use the DS18B20 and a Raspberry Pi to generate temperature graphs for monitoring anywhere your Internet connection can reach. I used it to collect data to see how a wood burning stove was heating my house and shed during the winters when I was telecommuting from home.
:::
Read This Article!
If you’re a subscriber and your subscription includes this issue of Nuts & Volts, you can read this article in our digital edition by clicking the blue icon in the upper right corner. Use the email address associated with your subscriber services account to login.

If you're a member of our Preferred Subscriber Network, not only will the magic blue icon let you read this article, but EVERY article in EVERY issue is yours to enjoy! Over a decades worth of content is stored in our digital archive!
If you’re not a subscriber, you can still view a few sample pages of our digital edition or subscribe here for full digital access and/or print delivery. Also, as you browse around our site, you will find selected articles have been posted in their entirety for you to enjoy.
Downloads
What’s In The Zip?
Python Program
Dallas Semiconductor Datasheet DS18B20
Maxim Datasheet DS18B20


