This time, we're going to introduce you to MakerPlot's best kept secret: the Logs(Debug) Immediate window. It's really not a secret, just seems so when it's mostly overshadowed by all the other graphical functions that MakerPlot is known for. It’s buried behind a small logbook icon (Figure 1) on the toolbar, so it's easy to miss. As they say, big things come in small packages, and the Logs(Debug) Immediate window is one of them.
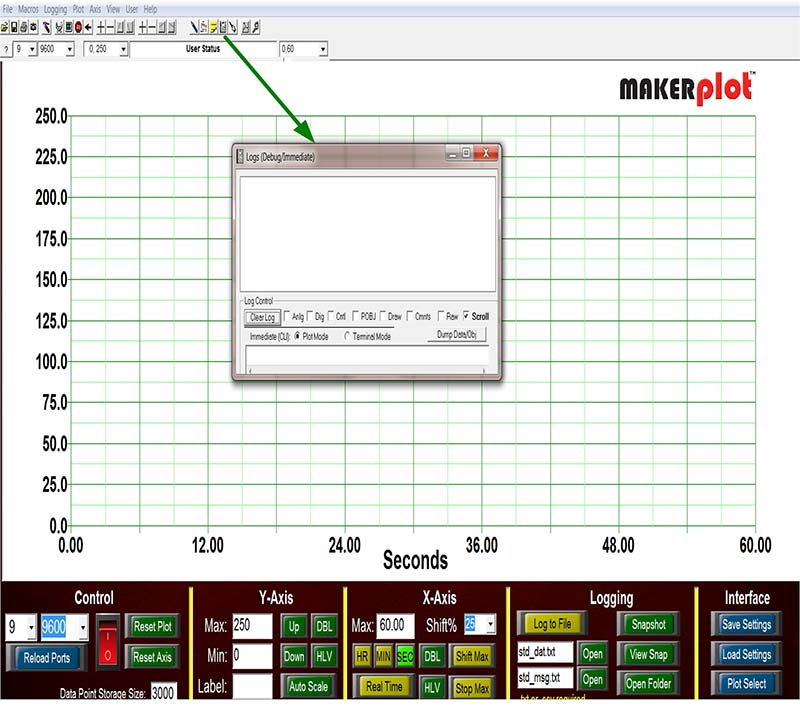
Figure 1. The Logs(Debug) Immediate window.
If you’ve been following this series, you may remember in Part 1 where we devoted nearly the entire article to how MakerPlot can be a debug tool for your micro’s code. This time, we’re going to get into the thick of things and show you how the Logs(Debug) Immediate window can make that happen. If you haven’t already done so, you can download a free 30 day trial copy of MakerPlot from www.makerplot.com to follow along. (Be sure to receive your $5 discount off the regular MakerPlot price by using this discount code if you decide to order: NVMP092713.) Let’s get going.
MakerPlot Data Paths
Data in and out of MakerPlot can come from many different sources and directions; Figure 2 is an illustration of this.
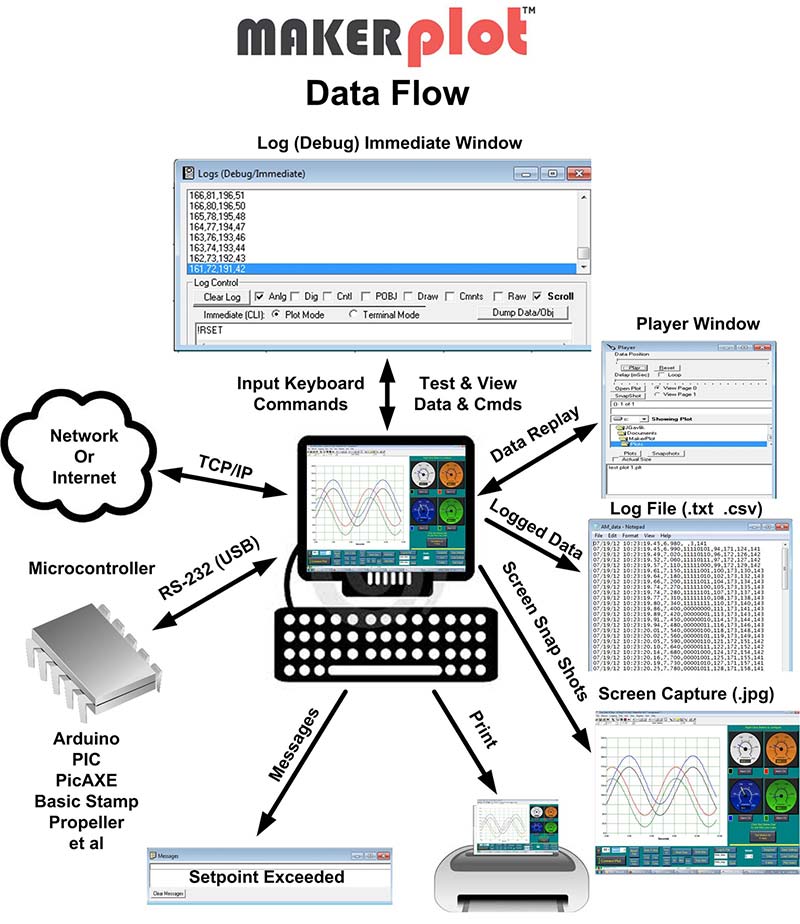
Figure 2. MakerPlot data paths.
What’s important to note is that the majority of the data flow from all these diverse directions are captured in the Logs(Debug) Immediate window at the top of Figure 2. This means that anything coming into and going out of MakerPlot can be seen, stored, and analyzed. This not only includes the analog and digital data that the code sends from your microcontroller, but also instructions for MakerPlot that come in alongside this data. This was shown to you in the previous articles on bi-directional control, but what wasn’t shown was how the Logs(Debug) Immediate window operates to capture and display that data. Let’s do that now.
Capturing MakerPlot Instructions
We’re going to continue with the bi-directional code (Figure 3) that was used in Part 6 to first show how the Logs(Debug) Immediate window displays the MakerPlot instructions that are transmitted from the Arduino to: 1) reset MakerPlot; 2) adjust the time scale; and 3) turn the four LEDs and toggle switches ON then OFF. Take a look at the code in Figure 3 to see what that means (Figure 5 will show how it looks as it’s happening in the Logs(Debug) Immediate window).
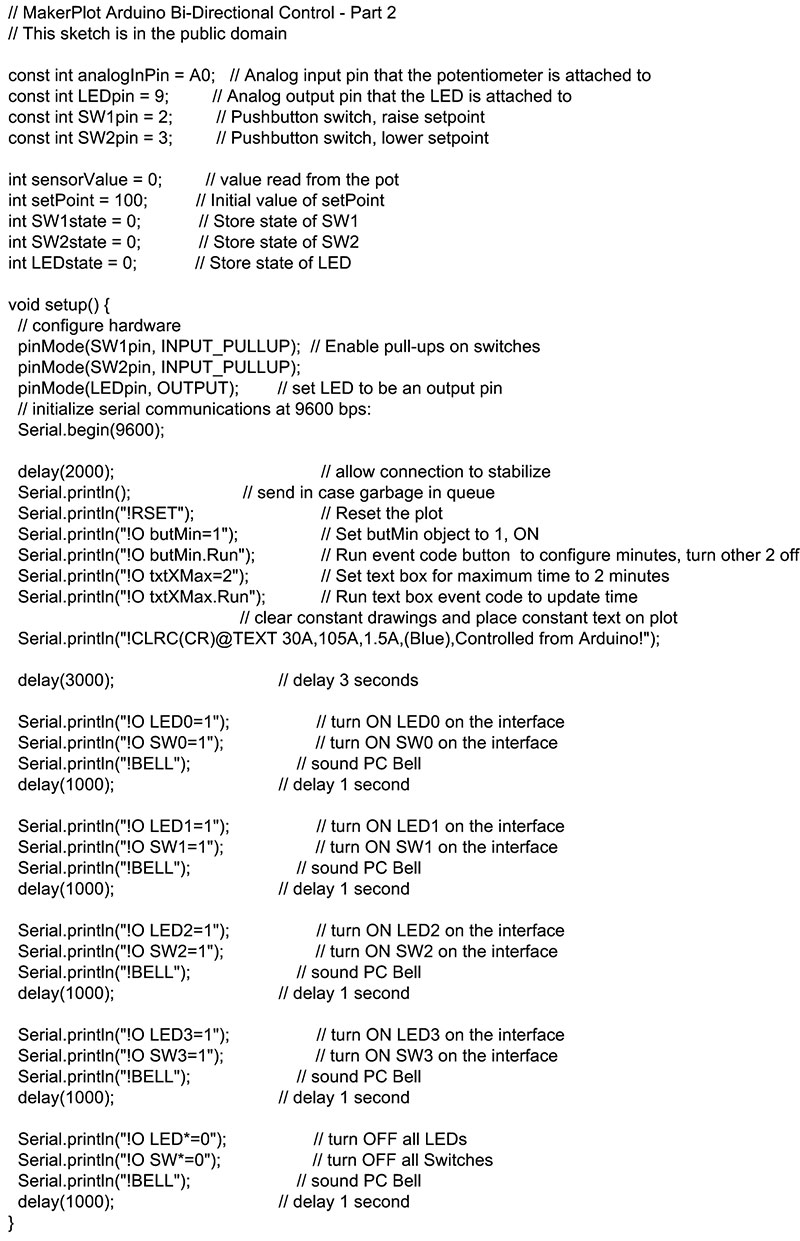
Figure 3. Part 1 of bi-directional setpoint sketch.
If you compare the sketch against the Logs(Debug) Immediate window, you’ll see the one for one correspondence between plotted and recorded data. In order to see this information, you’ll need to have the POBJ and Scroll boxes checked (red ovals). What’s interesting to note is that you’ll have a record of what was sent by your microcontroller’s code via the serial link. While this particular code works, yours may not the first time, so the Logs(Debug) Immediate window is a good way to check to see exactly what is being received by MakerPlot for code debugging purposes. Now, let’s get to the analog and digital data part.
Capturing Analog and Digital Data
Figure 4 is the listing for the loop part of the sketch that outputs analog and digital data, along with more instructions to MakerPlot.
Figure 4. Part 2 of bi-directional setpoint sketch.
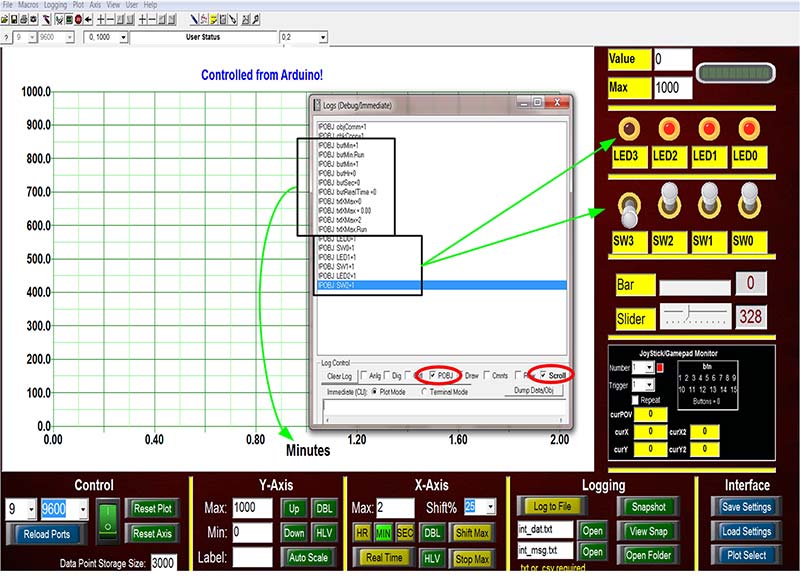
Figure 5. MakerPlot instructions.
Recall from Parts 5 and 6 that this is an interactive setpoint application and that the analog data consists of the potentiometer and setpoint values. The digital values consist of the two pushbutton switches and the above (1) or below (0) setpoint crossing level. Let’s check out what they look like in the Logs(Debug) Immediate window.
Beginning with the analog data, Figure 6 illustrates how MakerPlot receives these two values. To view analog data, the Anlg and Scroll boxes (red ovals) need to be checked.
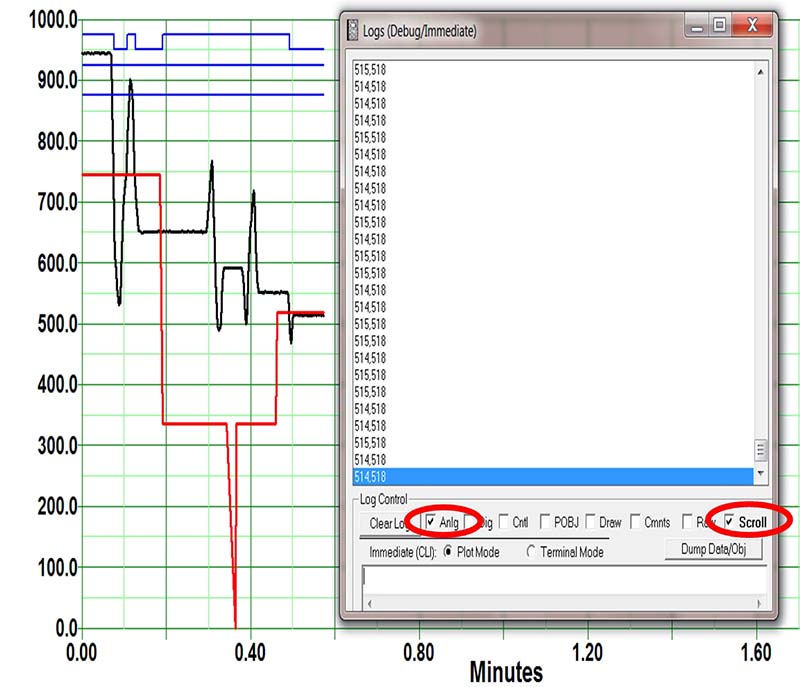
Figure 6. Analog data display.
As you can see, there are two sets of numbers separated by a comma. The first is the potentiometer value (the black plot), followed by the setpoint value (the red plot). So, as the plotted pot and setpoint values change, you’ll see these values change in the Logs(Debug) Immediate window along with them.
To display digital data, you’ll need to uncheck Anlg and check the Dig box. The result is in Figure 7 where the three digital values are displayed as 1s and 0s preceded by the percent (%) sign.
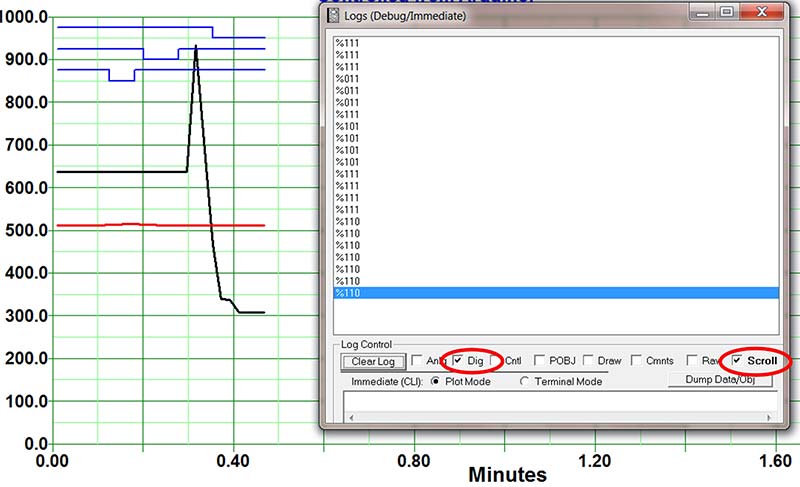
Figure 7. Digital data display.
As the SW1 and SW2 pushbuttons are pressed, the data changes. If the potentiometer level goes above or below the analog setpoint, the digital setpoint changes from 1 to 0, respectively (the right-most number). This is evident on the top three plot lines, as well. You can see both the analog and digital values together by simply checking both the Anlg and Dig boxes. Figure 8 shows how this looks.
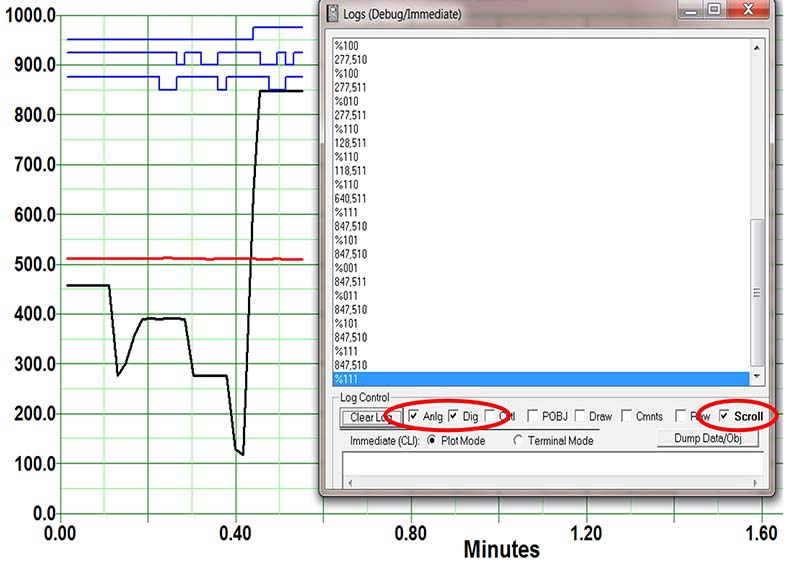
Figure 8. Mixed analog and digital data display.
The take-away from all of this is that the Logs(Debug) Immediate window provides you with a double-check on what your micro is sending to MakerPlot, in addition to the regular plotted lines.
Manually Entering Instructions and Data
Now, let’s go the other way and show you how to manually enter both instructions and data into MakerPlot using the Logs(Debug) Immediate window. This is in contrast to the instructions and data coming from the micro via the serial link; now they’re going to come into MakerPlot through the CLI window — the rectangular text box at the bottom.
To do this, you’ll need to click the green rocker switch until it turns red to break the serial connection from your micro, just to keep the micro’s data from interfering with the manually input data. Then, you’ll need to click on the small Plot icon on the toolbar (the one that looks like a computer monitor) to get plotting going. Finally, bring up the Logs(Debug) Immediate window and click the Clear Log button to start fresh.
To manually enter commands and data, simply key them into the rectangular area at the bottom of the window and push the Enter key (Figure 9).
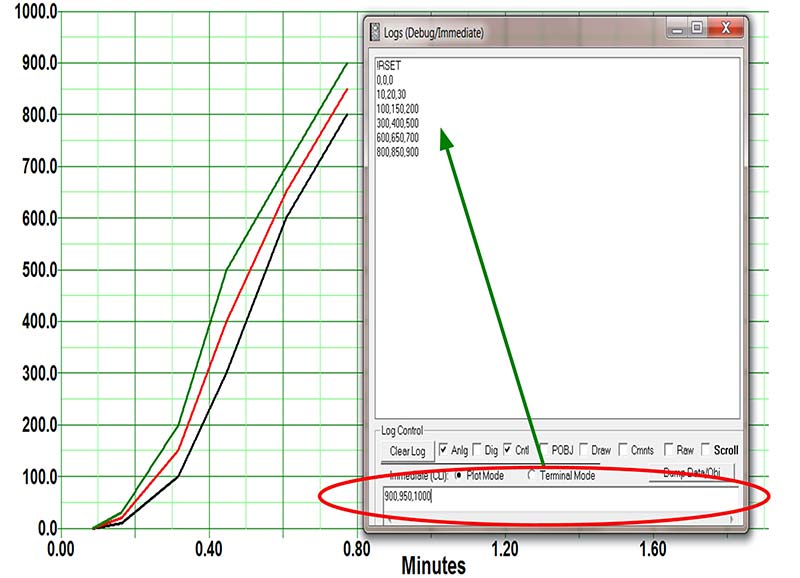
Figure 9. Manually entering instructions and analog data.
We’ve started with the !RSET instruction in order to clear the plot area and to reset the plot to time zero. We followed this with six groups of analog data, with each group having three values. You can see the I instruction and the six analog data groups in the main window, along with the matching plotted lines that are created by the analog data.
Each line has its own color to identify it, with black as channel 0; red as channel 1; and blue as channel 2. You can have up to 10 analog channels — each with their own color. Of course, you can change those plot line colors, but that’s a subject for another article.
The point about entering analog data manually or in code is that MakerPlot treats any string of numerical ASCII characters that are separated by a comma and terminated with a carriage return as analog data; no other prefixes or suffixes are necessary.
It’s a little different for digital data. With digital data, you need to prefix the 1 and 0 ASCII string with a percent (%) character followed by the data itself, then a carriage return. Figure 10 is such an example.
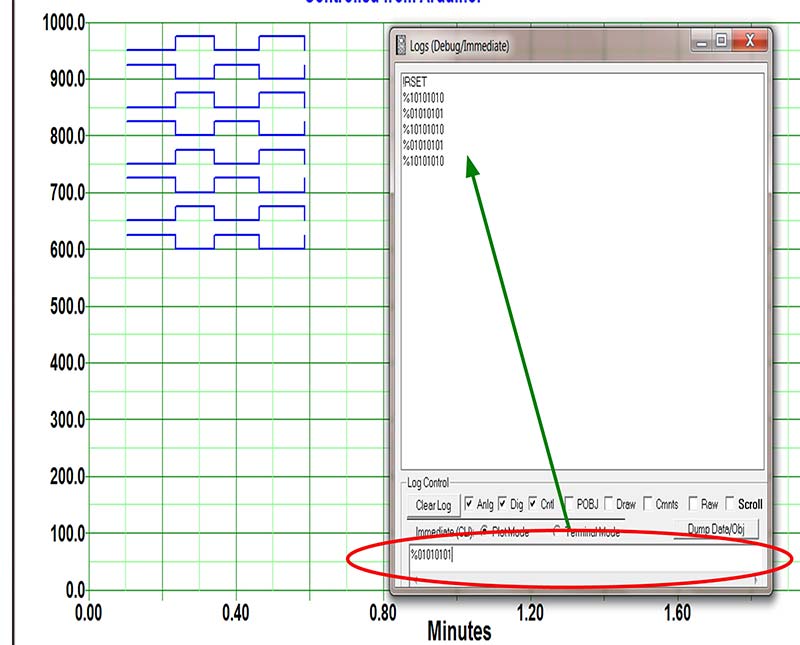
Figure 10. Manually entering instructions and digital data.
Again, we started with the !RSET instruction and keyed in five sets of digital data, although we could have gone up to 32. You can mix analog and digital data along with instructions and messages together. That’s the beauty of this simple yet powerful debugging tool.
Terminal Mode
Up until now, we’ve been in Plot mode. For this next example, we’ve switched to Terminal mode (Figure 11).
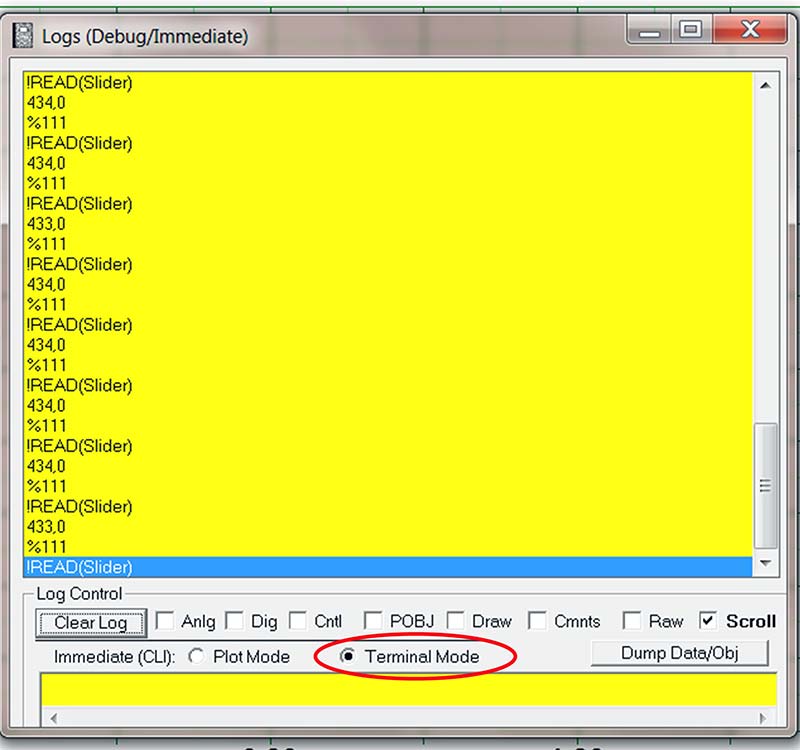
Figure 11. Terminal mode.
The display changes to yellow to alert you to the changed display mode. This is yet another way to see what’s coming in from your micro’s serial link.
Here, you can see what MakerPlot sees as the !READ(Slider) instruction is followed by the analog setpoint and pot values, then the digital values for the pushbutton switches and the setpoint crossing level.
Video
To get a better idea of how the Logs(Debug) Immediate window works, go to the MakerPlot website www.makerplot.com → More → Videos → Basic Plotting → Logs(Debug) Immediate Tab. Here, you can see what happens in the window with live data coming in; it will give you a much better handle on how it can work for you.
Conclusion
To sum up, you’ve been introduced to the Logs(Debug) Immediate window for two reasons. The primary reason was to show how you use it to view the data and instructions coming from your micro into MakerPlot, mainly to debug your code. When you use the Logs(Debug) Immediate window with the plotted data alongside of it, you can acquire a more quantified idea of what’s happening on the micro’s side in order to find a coding error. The other reason we introduced you to the Logs(Debug) Immediate window is to form a basis for the next couple of articles on customizing MakerPlot; this is where we’ll show you how to build your own Interface screen from scratch (or nearly so).
We’d like you to think of MakerPlot as the software equivalent to a hardware front panel. If you were to build a hardware panel for your micro’s application, your “kit” would include pushbuttons, switches, meters, and maybe a graphic display. All of this is time-consuming, difficult to implement, and probably expensive — not to mention cast in stone once it’s all done.
The name MakerPlot came into existence once it dawned on us that what it really does is act like a software kit where you can graphically assemble any kind of front panel you want in order to display and control your data. That’s the real power within MakerPlot; that is, you can customize it to your own needs, and that’s what we’ll get into next time.
That’s all for now, so just remember: Got Data – MakerPlot It! NV