In this series, I’ll describe my adventure into the land of alkaline batteries. In this installment, we’ll look at how to evaluate power needs, make battery choices, and predict battery service life.
Powering Your Microcontroller Projects
Microprocessor boards can be powered in a number of ways. Most boards are readily powered through the USB programming cable linking your microcontroller board to your PC during development and programming. Once your project is finished and running stand-alone, a new source of power is needed. As shown in Figure 1, line-powered schemes are easy. Many Arduino boards, for example, have a power jack onboard that an AC wall wart (7-12 VDC output) power pack can be plugged into.
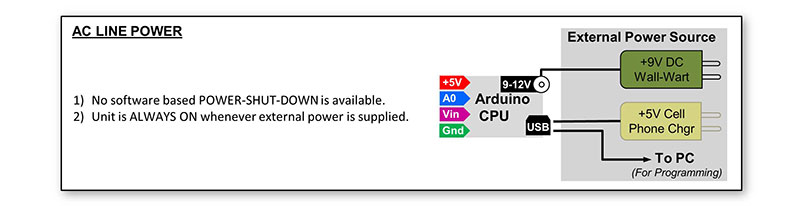
Figure 1. AC line powered options.
These boards provide onboard regulators to convert the raw unregulated 7-12 VDC from the AC wall wart into the regulated 5.0 VDC needed to run the board and the rest of your project. You can usually power any CPU project using a USB cable between the board’s programming port and a line-powered cell phone style charger. In this case, the phone charger outputs a regulated 5.0 VDC that can directly power your project.
Those CPUs that run on 5.0 VDC (and use 0-5V I/O logic levels) connect directly to the phone charger 5 VDC source, bypassing/eliminating the need for any further voltage regulation. CPUs that run at 3.3 VDC (and use 0-3.3V I/O logic levels) inevitably have onboard 5.0V to 3.3V circuits to perform the needed transformation and 3.3 VDC regulation.
How Can Your Project Become Battery Powered?
I recently completed an Arduino Mega based gizmo to test RJ45 cables and wiring. After I got my cable tester project running from a wall wart, I realized that it really “wanted” to be battery powered! A battery power source would make my device portable and more versatile. If your microcontroller has an onboard voltage regulator that can accept unregulated DC power, a common 9V alkaline battery might do the job. (My cable tester project will be featured in an upcoming article.)
Figure 2 shows how this can work for a typical Arduino board.
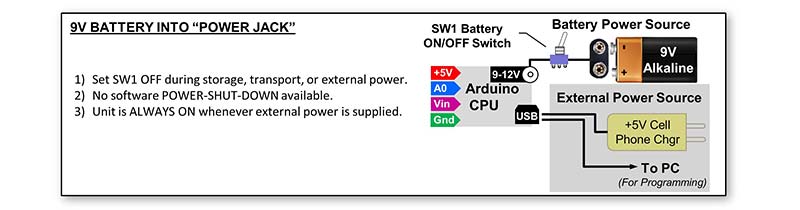
Figure 2. “Power jack” battery connection.
Instead of a single 9V battery, a bank of 1.5V AAA, AA, C, or D batteries wired in series also creates a 9V source.
Connecting a Battery to an Arduino “Vin” Pin
One can also hardwire 7-12 VDC into many Arduino boards such as the Uno, Mega, Due, and others using the available unregulated voltage input pin usually labeled “Vin.” Figure 3 shows how this to do this.
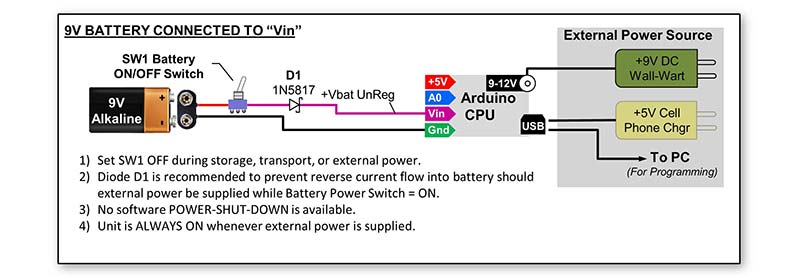
Figure 3. “Vin” battery connection.
As seen in the figures, Shottkey diode D1 is provided to prevent reverse current flow into the battery should you accidentally power your project from both the battery (Battery Power Switch = ON) and an external 9-12 VDC AC wall wart power pack at the same time.
While D1 will protect the battery from overheating and damage when ‘dual powered,’ it also unfortunately inserts a .2-.3 VDC diode voltage drop into the battery power supply circuit, even when correctly powering the project from just the battery source.
You can omit D1 and eliminate this diode drop if you can prevent ‘dual’ power connections. Covering the external power jack on the CPU is one easy way to prevent a dual power mistake.
How Much Power does Your Project Need?
Okay, so we’ve discussed some ways to connect and use batteries, but how long will they last? An important first step is to determine your power requirements.
To assess power requirements for my Mega based RJ45 cable tester project, I simply measured the current draw with my DVM (milliamp mode). By connecting the external power jack of the Mega to my bench power supply while placing my DVM (set to measure current) in series with the power supply, it became easy to measure current flow at 9 VDC as well as at other higher and lower input voltage values. This is good information to have as a battery is an unstable, unregulated power source whose output voltage declines as its energy is consumed.
I already expected the Arduino Mega in my project to draw 30-50 ma by itself, but I was surprised to find the total current measurement for my project at 9 VDC input was a hefty 100 ma! I then watched the total current draw while swinging the bench supply voltage from 7 to 12 VDC and discovered my project behaved like a constant current load, drawing about 100 ma no matter what the input voltage was set to.
While at first blush I was surprised, after thinking about it a while it made perfect sense. Since the load is drawn entirely off of the output of the regulator (+5 VDC rail), one should expect the current draw to remain essentially unchanged, even though the voltage feeding the input of the regulator is varied from 7-12 VDC.
So, was the actual power consumed by my project unchanging over the range of 7-12 VDC? Absolutely not! That is, even while appearing as a constant current load, the total power consumed (volts x amps) at say, 7 VDC input, is 700 mw (7V x 100 ma). However, the power consumed running at 12 VDC input will be 1200 mw (12V x 100 ma). So, where did all that extra power go?
Answer: It’s lost as heat radiated off the linear voltage regulator on the CPU board! Ah yes. There’s no “free lunch” and linear regulators are terribly inefficient, going from bad to worse as the input-to-output voltage differential gets larger.
I then ran a second test measuring the project current requirements when powered directly from an external regulated 5.0V power supply. This eliminated the power losses in the onboard linear voltage regulator and showed the actual power consumed by just by cable tester. To do this for your project, remove all other power sources from it (disconnect all USB cables!) and connect up your bench supply (preset to 5.0V) directly to the 5V bus of your project.
For my tester project, the measured current draw dropped from 100 ma (going through the onboard regulator), down to 60 ma or 300 mw (5.0V x 60 ma). I now had the actual power requirement using two different power supply input paths and could go on to evaluate a few different battery types.
Battery Options
First off, we need to better understand how a battery’s output voltage varies over its lifetime. While a fresh 9V battery, for example, starts out at 9 VDC, its output voltage rapidly decreases as its power is consumed. We need to know what the minimum voltage needs of our project are to figure out the useful service life of a battery.
When using the onboard regulator as found on an Arduino board, we need to deliver at least 6.5V input for its onboard regulator to successfully produce a well-regulated 5.0 VDC output needed by the board.
Therefore, if we deliver battery power as shown in Figure 2 or Figure 3, the minimum battery voltage we must deliver from our battery must be at least 6.5 VDC (or 6.8 VDC if the protection diode D1 is present). With this in mind, we now can fix our end-of-life battery voltage limit to 6.5 VDC (or 6.8 VDC).
For the moment, let’s go with 9.0 volts as our starting voltage level. We can get 9V out of a single fresh 9V battery, or a ‘bank’ of six fresh 1.5V batteries (i.e., AA, AAA, C, or D) connected in series (6 x 1.5V = 9V). To decide which way to go, we must look to the battery manufacturer’s spec sheets for each battery type to estimate the run time that we can expect using each of these alkaline battery alternatives.
Battery datasheets from many different manufacturers can be found with a simple Internet search. One of the most practical and usable datasheets that I found came from www.duracell.com.
Figure 4 shows example plots of service hours vs. battery voltage at various constant current battery loads for AAA, AA, and 9V Duracell “Coppertop” batteries.
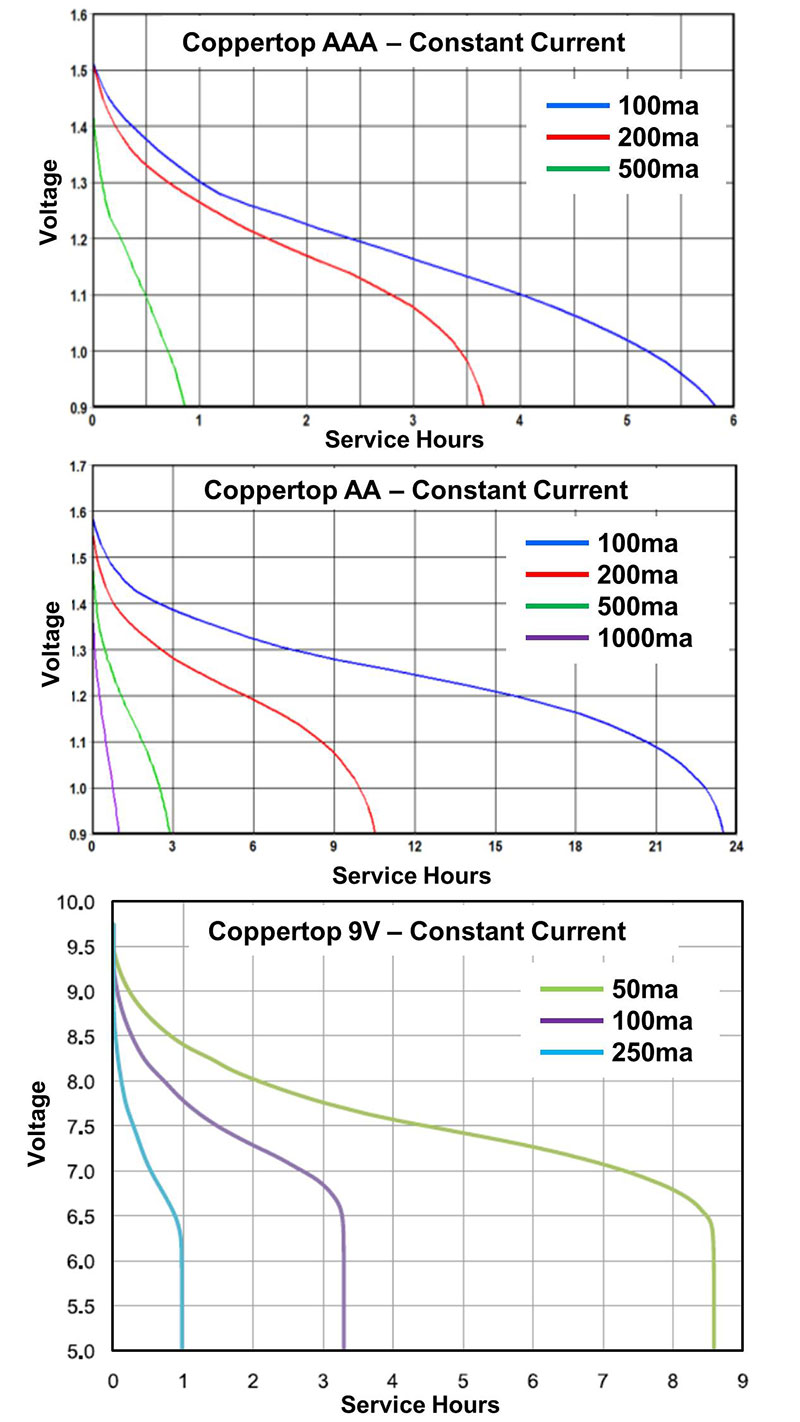
Figure 4. Published service life for Coppertop alkaline batteries.
For my project, I could look at the plot for a constant current load of 100 ma and the end-of-life voltage value of 6.5 (6.8) for a single 9V battery.
I stacked up six 1.5 VDC cells in series. This would mean that the end-of-life voltage per cell would have to be 1.1V. By tracing the 100 ma load line shown on the factory graphs from the starting voltage value down to our end-of-life voltage limit, we can extract a “service hours” estimate for each battery type.
The estimated service hours (as extracted from the factory graphs) for my tester project (100 ma load) for each battery type is shown in Table 1.
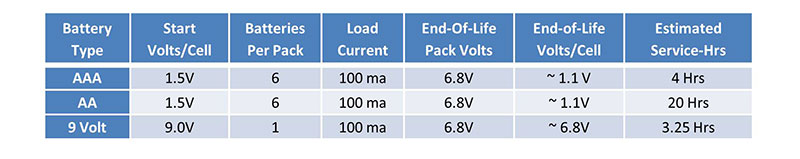
Table 1. Service hours estimate for 100 ma load.
By selecting the constant current plot line that’s closest to your actual current requirements, you too can use these charts to estimate service hours for your circuitry using different battery types and configurations. Note, however, that “your mileage will vary” if your project current draw is inconsistent or does not act in a constant current load manner.
What About mAh?
Battery capacity is sometimes rated in amp-hours (Ah) or milliamp-hours (mAh). This value is intended to express a generic load independent “amps per hour” or “milliamps per hour” value that one can use to estimate battery life. Logically, a 1000 mAh battery should deliver one amp for one hour, .5 amps for two hours, or .25 amps for four hours, etc. While this specification seems handy, in practice, I found real life mAh performance to be very load current dependent.
To show this, I made a “mAh table” by extracting data points from the published Coppertop plots of Figure 5.
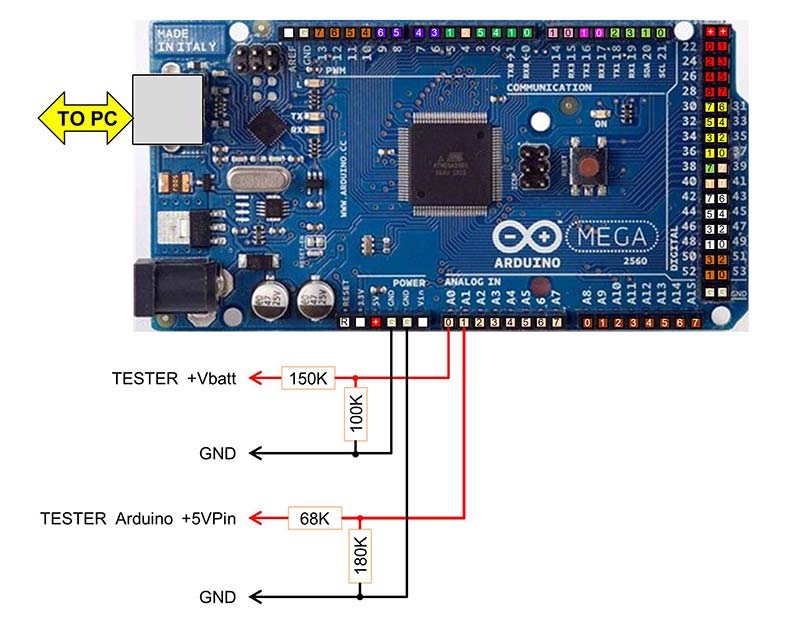
Figure 5. A quick and dirty battery life data logger.
This data can be seen in Table 2 and illustrates that the ma hours available from each battery type varies greatly from one load line to another.
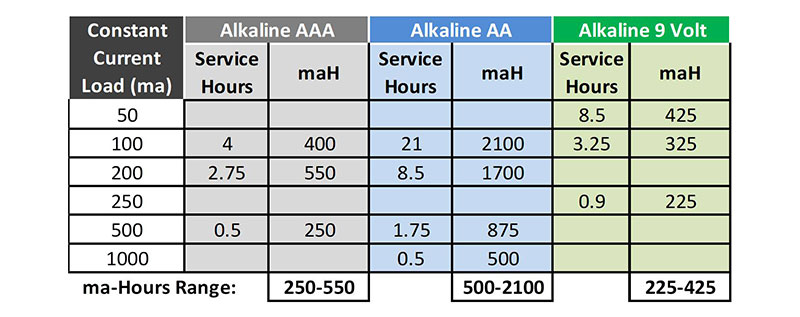
Table 2. Milliamp-hours (mAh) results vary by load.
While mAh ratings may be useful for some applications, load line effects at the levels I was interested in showed that mAh rating to be of no use in predicting service life.
A Real World Battery Life Test
I decided to run a battery life test to confirm my understanding of Duracell’s battery service life plots and see how close actual measurements would align to the graph driven life estimates. After connecting a fresh 9V battery up to my RJ45 tester project, I just needed to turn the tester on and measure battery voltage decay over time. In this way, for the cost of one battery, I could see how well a 9V battery would actually perform in real life.
Rather than sit around for hours jotting down battery voltages readings off my DVM every 30 seconds or so, I dug out a second Arduino Mega board (an Uno or Nano would have worked equally well) and quickly made a two-channel volt-measuring data logger (Figure 6).
The datalogger micro was connected to and powered by my PC through a USB cable. I then wired one data logger A/D input to the 9V battery powering the cable tester using a simple 150K/100K voltage divider. This voltage divider reduced the 0-9 VDC raw “Vbat” voltage range into the 0-4 VDC range that an Arduino analog pin A0 can accept.
Similarly, I used pin A1 as a second channel (68K/180K voltage divider) to monitor the +5V bus of my cable tester. I calibrated each channel using my DVM as a standard to come up with an “A/D Counts” to “Actual DC Volts” conversion factor for each channel and loaded these factors into my data logger program. In this way, the Arduino could directly output ‘measured DC volts’ for each channel.
The flowchart of my data logger code is shown in Figure 6.
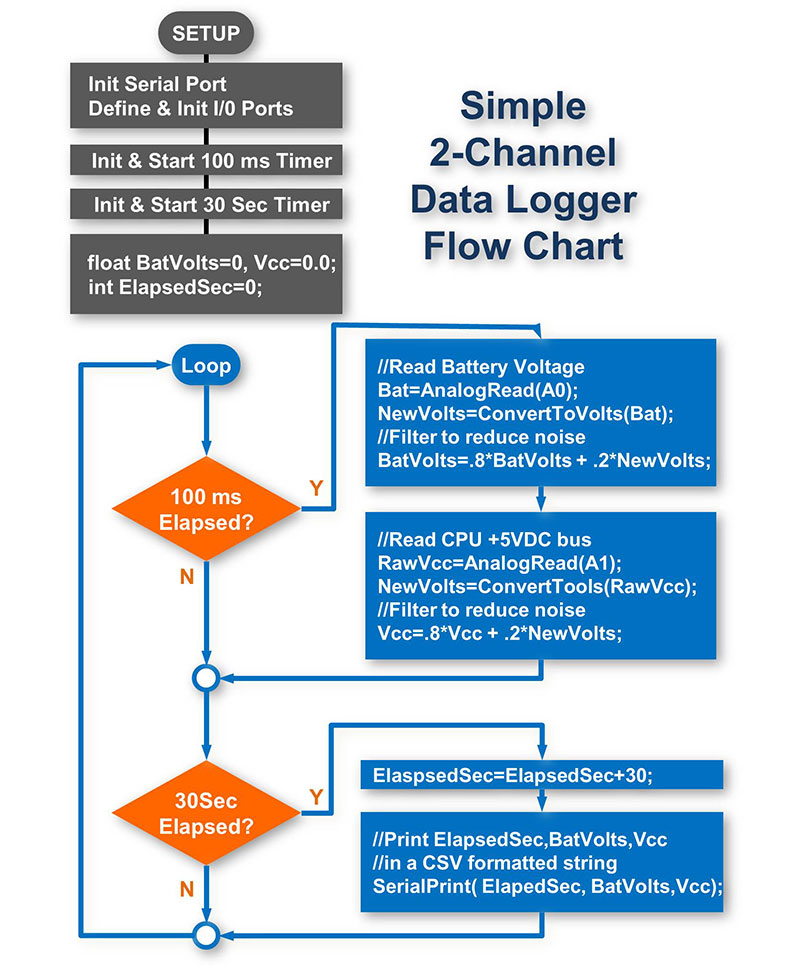
Figure 6. The data logger program.
It’s seen that as soon as the data logger starts up and enters the main “loop” (or has been restarted by pressing RESET), it immediately begins sampling the two data channels. Once every 30 seconds, it sends a set of readings out to the IDE (integrated development environment) “Serial Monitor” screen of my PC.
Leaving this setup running, I just walked away and came back about four hours later to find my tester battery had ‘died’ and I had captured many IDE monitor screens of data.
I simply scrolled the monitor screen back in time to the start of the test run, copied the whole data stream to my PC clipboard, and then pasted it into a new Excel worksheet. Since Excel understands the comma-separated variable (CSV) format of my captured data, it quickly turned my text stream into rows and columns of time vs. voltage life test data. Once in Excel, graphing the results was easy (Figure 7).
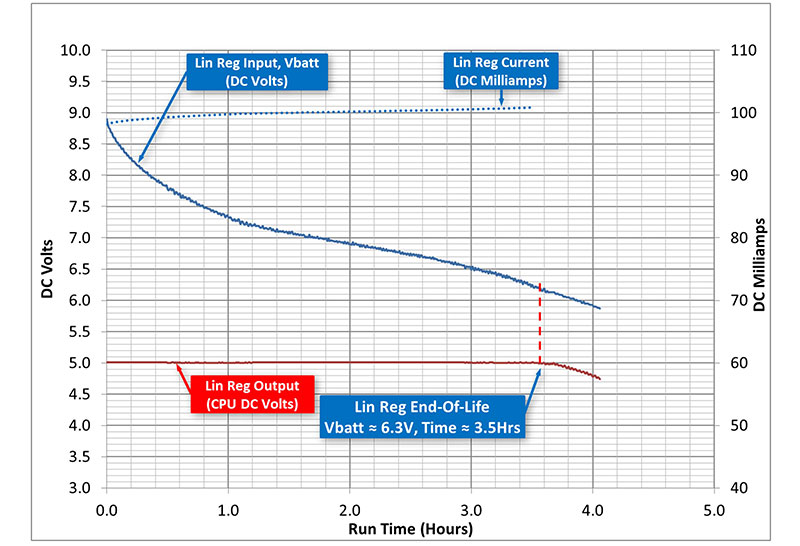
Figure 7. Battery life: Vbatt into Vin pin (onboard linear regulator).
From my life test graph, it shows that a fresh 9.0V alkaline battery powered the 100 ma load of my RG45 tester continuously for a little over 3.5 hours, closely tracking the 100 ma load line prediction found on the Duracell 9.0V battery service life datasheet. When +Vbat fell below 6.3 VDC (no diode drops in this run), the +5V bus of the tester started to sag, clearly indicating a true end-of-life condition.
So, How Much Run Time is Enough?
At first glance, 3+ hours of total run time seemed pretty meager. However, given that my tester can perform a full cable test sequence in less than 30 seconds, a three hour run life period can deliver more than 350 cable tests. Not all that bad!
While 350 tests seemed pretty good, inadvertently leaving the cable tester on and walking away for lunch will lead to a dead battery in short order! While a higher capacity six pack of AA batteries might get me through a leisurely dinner as well, it still won’t resolve a “left the tester on overnight” mistake! What else could be done?
Next Time
In Part 2, we’ll explore a way to add an automatic power-down feature and touch on some other battery-saving ideas that can help you extend the battery life runway for your next project. See you soon! NV