Advanced Process Control Technology for little cost.
Being a devoted nerd, I’ve long been fascinated by Proportional Integral Derivative (PID) process control. So, when a local farmer asked me to automate a vegetable canning process, I took it as a challenge to physically realize a PID temperature control device. Of course, many fine industrial process controllers already exist (say, from Omega), but I strived to learn their secrets and do it smaller and cheaper. The Arduino product family provides inexpensive hardware for the home builder. Plus, the Arduino integrated development environment (IDE) is easy to install and remarkably easy to use. For these reasons, I decided to build an Arduino PID temperature control unit.
The farmer’s canning application required executing a specific time vs. temperature profile to process the vegetables properly. The thermal control system is composed of the PID controller, solid-state relay (SSR), and 1,500W hotplate. Refer to Figure 1.
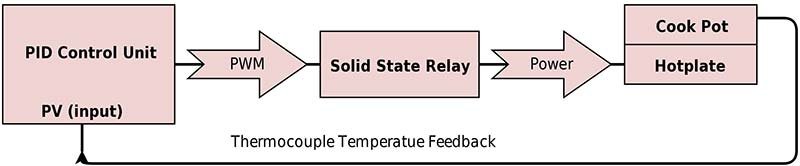
FIGURE 1.Thermal application block diagram.
The Arduino controller that I eventually made stores a number of time vs. temperature profiles (Figure 2). Once programmed on a PC (in the normal Arduino IDE way), the unit can be taken out to the process shed for stand-alone operation.
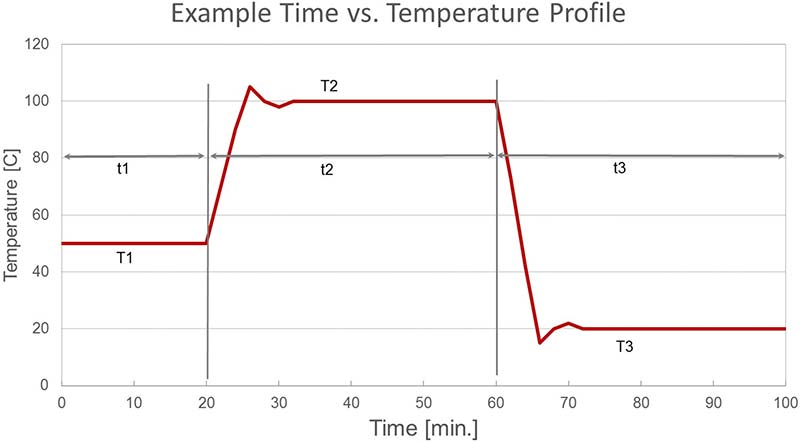
FIGURE 2. Example temperature profile.
Hardware
This PID controller device consists of three sub-units: an Arduino Uno R3; MAX6675 thermocouple temperature sensor; and1602 LCD keypad display. Assembly is simply a matter of observing the correct orientation and fitting the sub-units together. Soldering the MAX6675 module is optional for initial testing (Figure 3).
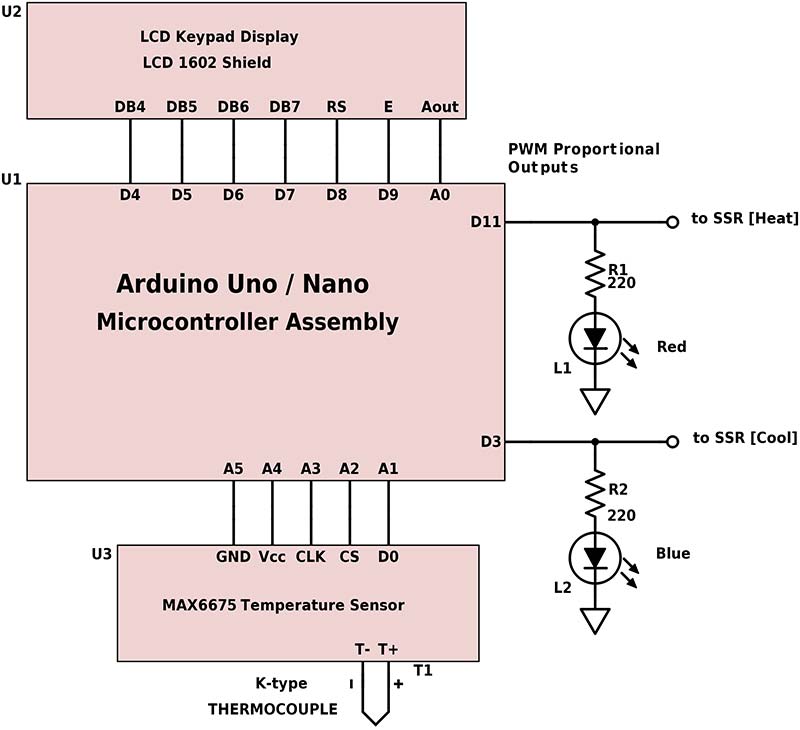
FIGURE 3. Simplified circuit diagram.
Analog pins A1-A5 were enabled for digital function to provide temperature sensor power and communication. Fortunately, this leaves digital pins 3 and 11 (both on 16-bit TIMER2) available to use for Pulse Width Modulation (PWM) outputs: pin 11 to heat (plus +); pin 3 to cool (minus -). Two optional LEDs provide a visual indication of PID variable outputs. An Arduino Nano and breadboard were used for actual SSR bench testing purposes.
1602 LCD Keypad Display Shield
This is a popular Arduino shield that integrates a 16-character by two-line LCD display with five navigation buttons and one reset button. This hardware is supported in the standard Arduino IDE library. Simply #include <LiquidCrystal.h> in your sketch.
MAX6675 Temperature Sensor Module
This temperature sensor module incorporates the MAXIM 6675ISA eight-pin integrated circuit soldered to a PCB (printed circuit board) substrate. The five-pin electrical interface consists of two power pins and three data I/O pins. Specifications are:
- 3.0-5.5V supply voltage
- K-type thermocouple only
- 0–1024°C temperature range
- 12-bit resolution (0.25°C)
- ~250K conversions per second max
- SPI compatible interface
Install the Arduino MAX6675 library for both Fahrenheit and Celsius temperature measurements. The module’s five interface pins fit neatly into the A1-A5 holes on the LCD keypad display shield.
PID_v1R Library
This sketch modifies the excellent PID_v1 library from Brett Beauregard ([email protected]). This new library is contained in the software zip file in the downloads for this article. Simply copy the PID_v1R folder to your Arduino library folder and enable in menu >Sketch>Include Library.
Software Sketch
Like fancy commercial controllers, I wanted to enter every parameter and control every function using the five navigation buttons on the LCD keypad display shield, but that is beyond this project’s scope (i.e., beyond my capability). So, the easiest way to experiment is to USB-connect the Arduino Uno and open the sketch in the Arduino IDE.
I still wanted to employ some keypad functionality to make the device portable for remote operation. Basic keypad functionality was programmed to allow the user to select pre-defined temperature profiles and begin processing.
After power-up/reset, the display prompts you to scroll up/down through a list of stored temperature profiles. Each profile is defined for up to five temperature and time points. Once you select a profile, the Arduino unit will execute the time and temperature sequence, then return to the last menu. The temperature profile data structure is:
typedef struct { // 5 steps in temperature profile
char *desc; // description 16 char max.
double Kp, Ki, Kd; // PID parameters
double T1, T2, T3, T4, T5; // T temperature
unsigned long t1, t2, t3, t4, t5; // t time [integer minutes]
} profile;
The sketch as written provides memory for six profiles. Five profiles are intended for sequenced operation and one special profile named “Default” for static continuous operation for a duration of up to 50 days (see millis() counter). Of course, the user can and must edit profile variables to create their own custom functionality and temperature control sequences.
Also notice that PID constants Kp, Ki, Kd can be tailored in each profile for use in multiple applications. Refer to Figure 4.

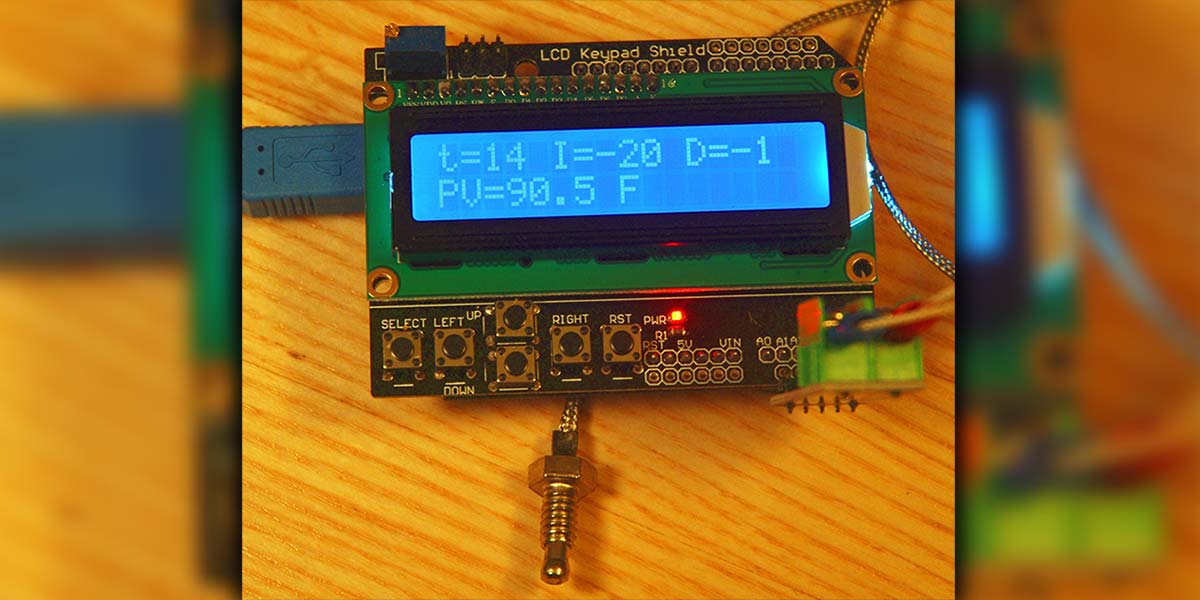
FIGURE 4. LCD display for PID in progress.
During operation, the LCD display shows a PID sequence in progress; t is total elapsed time in minutes; I and D are PID Integral and Differential terms; PV is Process Value, i.e., current temperature in degrees Fahrenheit. In the lower right, a PID error is indicated by the letter E.
Sketch features are as follows:
- A temperature alarm is programmed to terminate execution immediately if min/max temperature limits are exceeded.
- If either min/max PID output limit is reached, an error “E” is momentarily displayed on the LCD display. While not fatal, this should be a clue that some thermal variable may need adjusting.
- The Arduino serial monitor tool displays PID steps in progress.
- Commenting one line of code switches between PID simulation and live operation.
About PID
PID process control theory was developed in the early 20th century. It is well researched and commonly applied in modern industry today. PID mathematics can be complicated, but (within limits) PID can compensate for thermal resistance and thermal capacitance in systems to yield precise temperature control. PID behavior is defined by three K constants: Kp (proportional), Ki (integral), and Kd (derivative). In general, these K constants and PID output can range widely for a variety of applications.
Ideal PID temperature control assumes both a heating and cooling source (with the same linear thermal forcing gain). This can be difficult to achieve in practice due to different heat/cool technologies. There are many ways to go wrong. Even when operating correctly, wild oscillations in temperature are possible. However, with careful attention, PID control can be adapted to many applications.
Many commercial PID controllers claim to autotune the Kp, Ki, Kd coefficients to achieve optimal performance. I suspect these methods are often empirical and apply only to a narrow set of conditions. PID mathematics is very complicated. Fortunately, there are practical manual methods and online simulations to aid in setting these important PID parameters.
For this controller, the PID proportional output uses PWM on two digital output pins. PWM is easily enabled in the Arduino environment and provides accurate eight-bit modulation. Often, PWM is used to create a (time-averaged) variable DC voltage, but here the digital signal duty cycle modulates the SSR AC power cycle. One pin outputs the plus (+) and a second pin is the minus (-) PID output. PWM resolution for this microcontroller is eight bits (0-255 values) for each pin.
Practical Application
Because PWM output ranges 0-255, this also constrains the PID output function to this range (actually -255 to +255 for dual ± outputs). Therefore, PID constants Kp, Ki, Kd must be chosen carefully to never exceed these limits during operation. Using constrained K constant values may limit PID performance in terms of max temperature excursion and settling time.
Nevertheless, with proper K constant selection, full range (0-1024°C) temperature sensor operation should be possible for a wide variety of thermal loads.
Consider the special case of a heat-only application; say, perhaps a small SMT solder oven. In reality, there is no cooling function, so if the PID output < 0, the thermal system will not respond. Only the (cooling) effects of the ambient thermal environment may restore temperature control.
To match this heat-only environment, set PID_MIN = 0 in the software sketch and choose a suitable set of K constants that limit PID output to positive values only.
Time sampling of Process Value (PV) (current load temperature) at a slow rate is another source of control error. Surely everyone can imagine heating a pot on high and forgetting to check it until 20 minutes later when the pot is boiling over. The effects of temperature under sampling are shown in Figure 5. In this example, regulation is near to permanent temperature oscillation due to an under-sampling period of 0.57 sec.
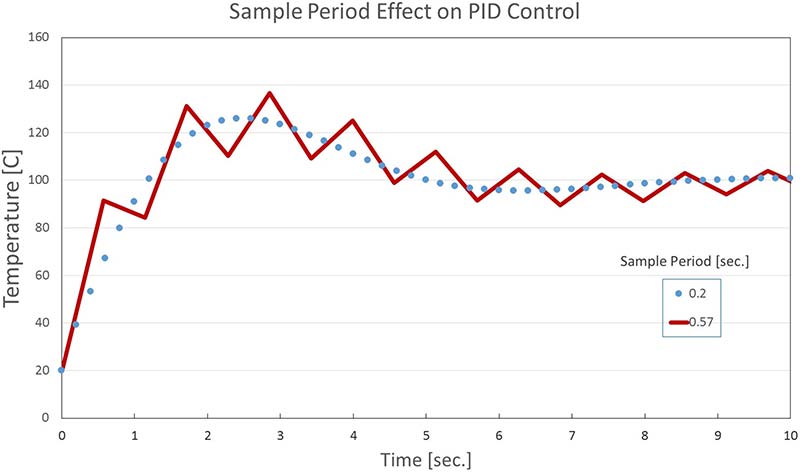
FIGURE 5. PID under-sampling error.
A simple rule of thumb[3] for the maximum sample period is to take the ramp time and divide by 10. In this example, it took roughly two seconds to heat from 20 to 120 degrees. So, the maximum sample period is 2 sec/10 = 0.2 seconds. Indeed, the blue dots show good PID control at this sampling period: 0.2 sec.
For most practical applications, under-sampling should not be a problem. Using this PWM strategy, the device is capable of a 0.267 sec sample period minimum; suitable for a three second ramp time.
SSR and PWM Problem
Solid-state relays are capable of switching on/off heavy AC loads. Common low cost SSRs are rated for up to 480 VAC at 40A. Yikes! Several SSR types exist, but all AC power SSRs use a TRIAC thyristor element.
Here, the power is not actually switched until the load current falls below a specified holding current (typically < 100 mA). The zero-crossing effect is characteristic of all AC output SSRs regardless of switching type.
Because this implementation relies on rapid PWM switching, it is best applied to resistive loads with a large power factor (greater than 0.7). The zero-crossing effect is shown in Figure 6.
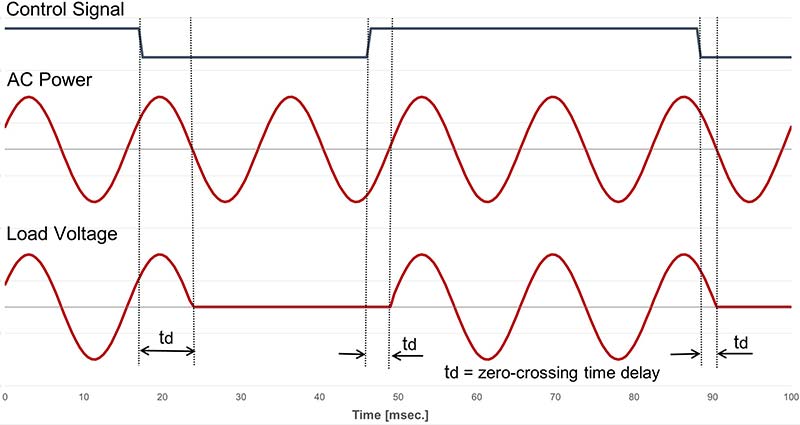
FIGURE 6. SSR zero-crossing AC power switching.
For 60 Hz AC power, the maximum delay is 1/2 cycle or 8.33 ms. Considering that our PWM duty cycle ranges from 0-255, a single bit of resolution at 8.33 ms would imply a full range PWM switching period of 256 * 8.33 ms = 2.133 sec. By selecting a PWM switching frequency, the control resolution is determined because SSR power switching only responds to higher order bits. Take a look at Figure 7.
| binary bits |
control range |
Period [ms] |
Freq. [Hz} |
| 8 |
256 |
2133.33 |
0.46875 |
| 7 |
128 |
1066.67 |
0.9375 |
| 6 |
64 |
533.33 |
1.875 |
| 5 |
32 |
266.67 |
3.75 |
| 4 |
16 |
133.33 |
7.5 |
| 3 |
8 |
66.67 |
15 |
| 2 |
4 |
33.33 |
30 |
| 1 |
2 |
16.67 |
60 |
FIGURE 7. PWM switching frequency and resolution.
Because the ATmega328P master clock operates at 16 MHz and the maximum TIMER2 divisor is 1024, the minimum PWM sampling frequency is ~30 Hz, yielding four levels of resolution control. However, if we further divide the ATmega328P master clock frequency by 8, then the PWM frequency is 3.75 Hz and five-bit (32 level) resolution is achieved.
Considering many practical applications, a sampling rate of ~4 Hz with five-bit resolution was an acceptable trade-off. Implementing both TIMER2 pre-scalar 1024 divisor and master clock divisor 8 is required to reach a PWM frequency of 16 MHz/(1024*256*8*2) = 3.83 Hz. The master clock was divided in software with the clock_prescale_set(clock_div_8); function which, of course, has a similar effect on the delay(); millis() instructions. Delay values must be divided proportionally.
The Arduino standard PID_v1 library was also edited for the same reason and a modified PID_v1R library is included in the zip archive at the article link.
Testing
To debug and validate this design, an Arduino Nano and breadboard were used with two LEDs, an SSR, and a 60W incandescent light bulb (Figure 8). It was easy to see the LEDs flash at a slow rate (PWM cycle time) and the LED brightness change (PWM duty cycle).
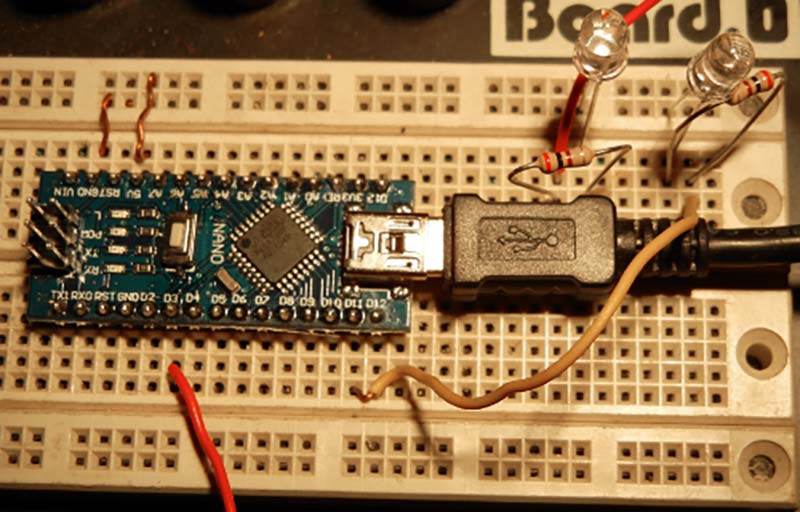
FIGURE 8. Arduino Nano test circuit.
The definitive test was switching a 120V resistive load (60W light bulb). To my joy, flashing and variable intensity was observed. This was the extent of bench testing before deployment.
Discussion
This was a satisfying project because I learned a lot about PID and made a practical PID temperature control device. The Arduino IDE and libraries made programming and testing a breeze.
A few quick points:
- Online cost of hardware is very cheap ($20) and can be assembled by almost anyone in just seconds.
- ATmega328P microcontroller performance provides for both rapid sampling (4 Hz) and five-bit PWM SSR switching. Along with a wide temperature range (0-1024°C), this unit is ready for a variety of applications.
- Keypad selection of temperature profiles enables the user to operate stand-alone at the remote process site.
- Only 30% of program memory and 60% dynamic memory are used, leaving plenty of space for user enhancements.
Some practical applications might include vegetable canning, rice cooker, slow cooker, alcohol fermentation, or an SMT solder oven. Someday, I’m going to turn the PID problem around and make a device that senses meat temperature and indicates the remaining cooking time. The Thanksgiving turkey will be cooked perfectly every time. NV
Resources
MAX6675 Datasheet:
https://cdn-shop.adafruit.com/datasheets/MAX6675.pdf
MAX6675 Arduino Library:
https://github.com/adafruit/MAX6675-library
All components (Arduino Uno R3, 1602 LCD keypad display, MAX6675 module and thermocouple, SSR) are easily purchased online.
References
- Wikipedia: https://en.wikipedia.org/wiki/PID_controller.
- “Optimum Settings for Automatic Controllers," J. B. Ziegler and N.B. Nichols, 1942: https://asmedigitalcollection.asme.org/dynamicsystems/article-abstract/115/2B/220/417448/Optimum-Settings-for-Automatic-Controllers?redirectedFrom=fulltext.
- Loop Sample Time: http://controlguru.com/sample-time-is-a-fundamental-design-and-tuning-specification.
- Solid-state relay types and application: www.crydom.com/en/tech/newsletters/solid%20statements%20-%20ssrs%20switching%20types.pdf.
Downloads
What’s in the zip?
Surce code
Read me file