As part of my internship at Amped Innovation, I conducted life cycle testing. This test simulates extended use of a solar home system by running the system’s battery pack up and down repeatedly. During this test, a battery capacity measurement calculated by an internal clock on the solar home system is printed at the end of each charge cycle. After testing the systems for a few months, we found a surprise in the data. A drastic decrease in battery capacity was observed.
With this problem unresolved, I was tasked with creating a data logger to better understand what exactly was going wrong. I decided that temperature, battery capacity, and individual cell voltages would be the most relevant data to understanding this mystery. The next decision was deciding what hardware to base the project off.
I decided to go with a Raspberry Pi 4 to enable live plotting and to give me experience with a new platform as I’d never programmed on a Linux device. For data collection, I went with a 1-Wire DS18B20 temperature probe, a UART cable to read the serial printouts, and a MCP3008 ADC (analog-to-digital converter) to read the cell voltages.
After prototyping the circuit on a breadboard (Figure 1), I created a Python script to save the data to a CSV file and draw real time plots using Matplotlib.
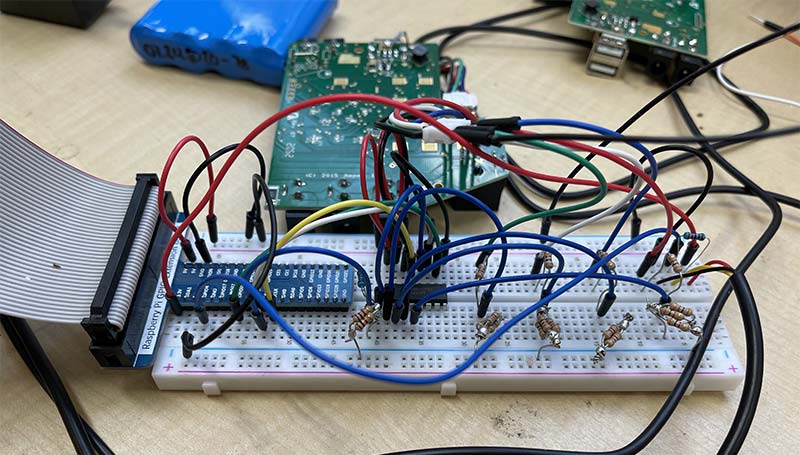
FIGURE 1. Prototype breadboarded circuit.
This live plotting is a useful feature as our life cycling tests take place over a period of months. I programmed with ease-of-use and user configurability in mind, as I knew this data logger would be utilized by people who were unfamiliar with the tool and had use cases I couldn’t anticipate.
The data logger is configured by the user in the main.py file. Here, the user specifies settings including sample rates, which data input types to log, which ADC channels to read, what ratio is being used on the ADC’s voltage dividers, serial input location, baud rate, and the file path to save the CSV at (Figure 2).
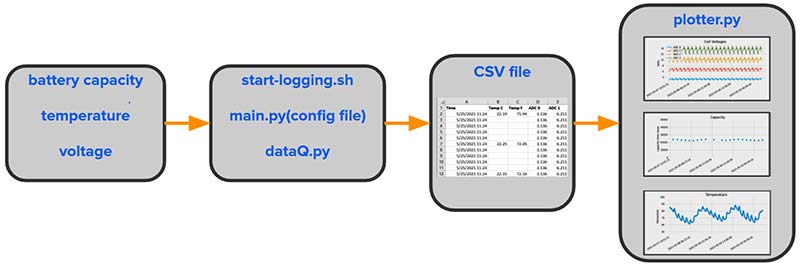
FIGURE 2. Python file structure.
While collecting data, I noticed significant noise in the voltage readings. Using an oscilloscope, I traced this issue to inconsistencies in the 5V power produced by the Raspberry Pi that was used as a reference voltage on the ADC. This was resolved by using a voltage regulator to produce the 5V reference line.
With some noise remaining in my battery pack cell voltage readings, I created an averaging algorithm. The best scheme I found was to take multiple voltage readings, trim off the outliers, and then take the mean of the remaining values. Altogether, a 70% reduction in noise on the reported voltage values was seen (Figure 3).
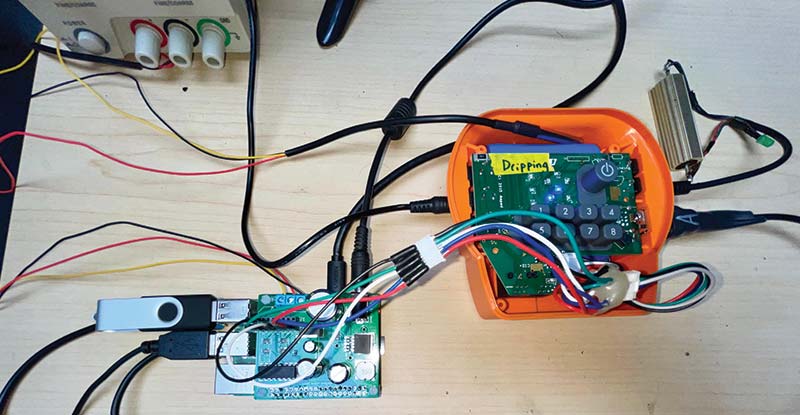
FIGURE 3. The data logger in action collecting data from a solar home system.
With a working data logger in hand, we put it to use on our life cycling systems. And voilà! We quickly discovered that our test firmware was not emulating our actual charge behavior accurately.
When topping off the battery during charging, the test firmware was peaking the battery voltage once and then allowing the pack to soak versus our normal charging behavior that peaks the battery thousands of times to balance the cells.
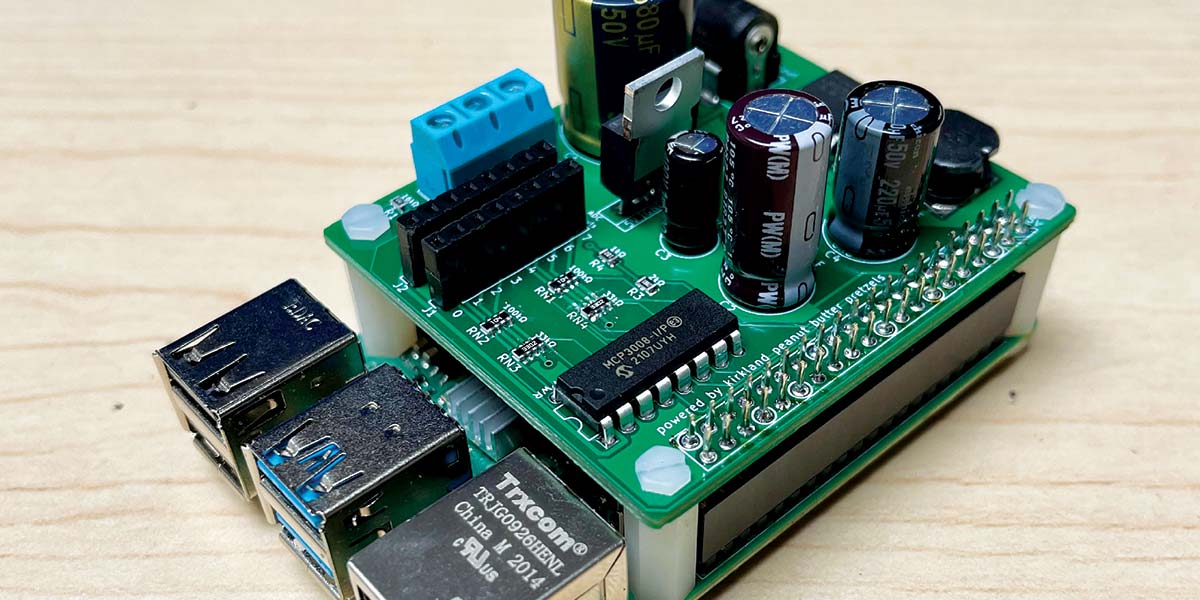
The next step I took was to turn the breadboard circuit into a Raspberry Pi HAT. The reasoning for this was to enable engineers at Amped to use the tool without having to build the circuit themselves. To do this, I took an online course on KiCad during evenings and then designed and built the board. Numerous improvements were made to the circuit design of the HAT board.
Noise in the ADC readings was reduced by using a voltage regulator and buck in tandem to power different components on the HAT (Figure 4).
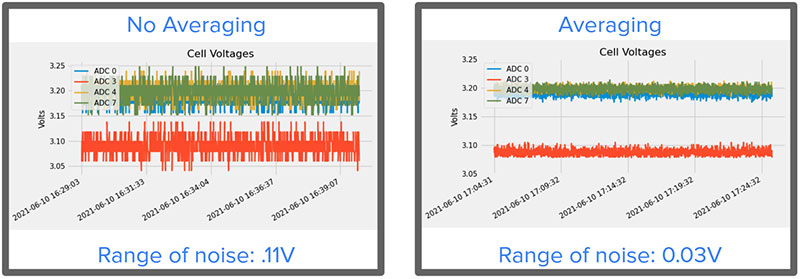
FIGURE 4. Noise reduction seen from software averaging algorithm.
Power ranging from 12V to 18V is supplied through the barrel port. The voltage is brought down to 5V by a buck and voltage regulator independently. The voltage regulator only powers the ADC’s reference voltage. The reasoning for this is a low noise signal is needed for the ADC’s reference. There’s around 30% less noise on the voltage regulator line compared to the power supplied through the buck. The buck powers everything else on the board; the power-hungry RaspPi itself through the header pins.
For the HAT, the 1-Wire temperature sensor runs 5V power instead of the 3V that the breadboard circuit used. The HAT also has a screw terminal for connecting the leads of the temperature sensor’s cable. The higher voltage and ability to connect a cable enables sampling temperatures in areas at a distance from the Raspberry Pi.
Voltage is collected using an MCP3008 ADC. This allows for eight different ADC inputs to be read and logged. There are female header pins for eight ground connections if connecting multiple grounds together is needed and allowable.
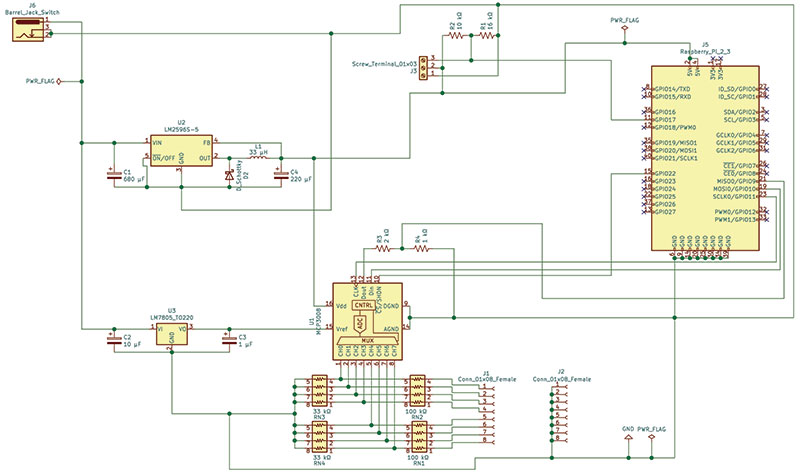
SCHEMATIC.
The HAT can take readings between 0V and 20V in its current voltage divider configuration. This is easily changed by swapping out the resistor packs of the voltage dividers on the ADC input channels.
The current voltage divider ratio is 1-to-3. The constraint is to keep the voltages seen by the ADC between ground at 0V and the reference line at 5V. In the Python script, the user specifies the ADC voltage divider ratio and a scalar value that is found through a manual calibration process.
Serial data is collected using a UART cable. The tool is programmed to look for a battery capacity figure that is computed and printed by the solar home system. This script can be modified to look for other data types (Figure 5).
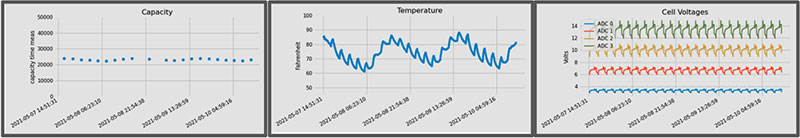
FIGURE 5. Graphs outputted from the data logger displaying battery capacity, voltage, and temperature.
The max allowable sample rate is limited by the RaspPi’s RAM.
With 4 GB RAM, a maximum sample rate of 20 Hz is recommended when live plotting is active. A maximum sample rate of 50 Hz is recommended when only logging to a CSV and not plotting in real time. Upgrading to the 8 GB RAM model will increase these sample rates.
This was a fun project to work on and a great introduction to Raspberry Pis, Linux, and PCB design/manufacturing. The Amped engineers throughout America and Africa are looking forward to having this data logger tool at their disposal.
Although my internship is now over, it would be great to continue working on this project and create a more robust and fuller featured tool.
Ideas I’m thinking about implementing are adding an LED to indicate when logging is taking place, adding additional temperature sensors, creating a custom enclosure, and programming automatic ADC calibration.
With eight ADC channels, a temperature input, and live plotting, I see this as a useful general-purpose data logging tool for others. The ability to log data over an extended period is a useful feature.
For example, I could see somebody using this to study how changes in seasonal temperature affect a device’s battery. The KiCad and Python files are available in the downloads for others to use and build on top of as well as at https://github.com/challengerjdb/RaspberryPiHat-datalogger.git. Be warned this tool has its quirks and is not perfect. NV
Parts List
| Description |
Digi-Key Part Number |
Qty |
| Eight-position Receptacle Connector .1” Through Hole |
929850 |
2 |
| 2.5 mm Barrel Jack Connector |
KLDX-0202-BC |
1 |
| Stacking Header 40-pin |
1528-1385-ND |
1 |
| ADC 10-bit 16 DIP |
MCP3008 |
1 |
| Four-resistor Array 33K ohm 1206 |
13-YC164-FR-0733KLCT-ND |
2 |
| Four-resistor Array 100K ohm 1206 |
YC164J-100KCT-ND |
2 |
| 680 µF Aluminum Radial Capacitor |
P10331-ND |
1 |
| 10 µF Aluminum Radial Capacitor |
493-2022-ND |
1 |
| 1 µF Aluminum Radial Capacitor |
P19454-ND |
1 |
| 220 µF Aluminum Radial Capacitor |
UHE1H221MPD |
1 |
| 30V 5A Schottky Diode |
CMS04(TE12LQM)CT-ND |
1 |
| Terminal Screw Block (three-pin) |
TB002-500-03BE |
1 |
| 33 uH Inductor |
SRN1060-330MCT-ND |
1 |
| 16K ohm Resistor 0805 |
P16KACT-ND |
1 |
| 10K ohm Resistor 0805 |
541-CRCW080510K0JNEBCT-ND |
1 |
| 1K ohm Resistor 0805 |
RMCF0805JT1K00CT-ND |
1 |
| 2K ohm Resistor 0805 |
RMCF0805FT2K00CT-ND |
1 |
| 5V 3A Buck |
LM2596S-5.0/NOPB |
1 |
| Linear Voltage Regulator 5V 1A |
296-47192-ND |
1 |
| Temperature Sensor on One Meter Cable |
DS18B20 |
1 |
| Raspberry Pi Custom HAT PCB |
n/a |
1 |
Downloads
What’s In The Zip?
Python Script
Data Logger Instructions
Files for RaspPi HAT
KiCad PCB Files
CP210x Universal Windows Driver v10.1.10