Use an Arduino to Measure and Show Climate Change Graphs!
I live in the Midwestern region of the US where every winter, it gets cold. Those of us in the region become focused — dare I say, obsessed — with the outdoor temperature and the near term predictions and trends.
Recently, I began to explore ways to improve and upgrade my “thermal monitoring technology” and came up with this simple, easy to build trend-plotting thermometer. This project features a large color graphics display to show the current temperature in big bold digits. Better than that, it also graphs the temperature trends over the most recent 4, 8, 16, or 24 hour period.
For me and my temperature obsessed brethren, it provides insights into overnight changes as well as mid-winter encouragement whenever we see upward trends!
This project joins an Arduino CPU (central processing unit), some temperature/humidity sensors, and a real time clock (RTC) module to a large (3.5 inch) high resolution color LCD graphics display to create a fun and useful “graphing thermometer.” The outcome of this effort is an easy-to-build device that has the following features and functions:
- Provides a weather watch device that is tightly focused on local conditions: Your backyard.
- Fully stand-alone operation: No Wi-Fi or Internet complexities.
- Simple and easy to build: Uses readily available modules and parts.
- Easily programmed and customized: Arduino Integrated Development Environment (IDE) to the rescue!
- Shows indoor and outdoor temperature and humidity on big bright digits: Large, colorful, easy-to-read display.
✓ Custom large-number font provides great display quality.
- Vividly shows weather trends: Graphs temperature changes over the previous 4, 8, 16, or 24 hour period.
- Includes a digital clock: Shows day-date-time which makes for easy-to-read time-stamped trend graphs.
- Compact: Fits into a small 3D printed case or mount into an enclosure of your own design.
- Flexible core platform and enclosure can be utilized for other projects and applications.
✓ This project can easily become a full function day-date-time graphics clock.
✓ Available SD card slot on LCD shield can be used to add new features (long term data logging or ??).
The Main Display
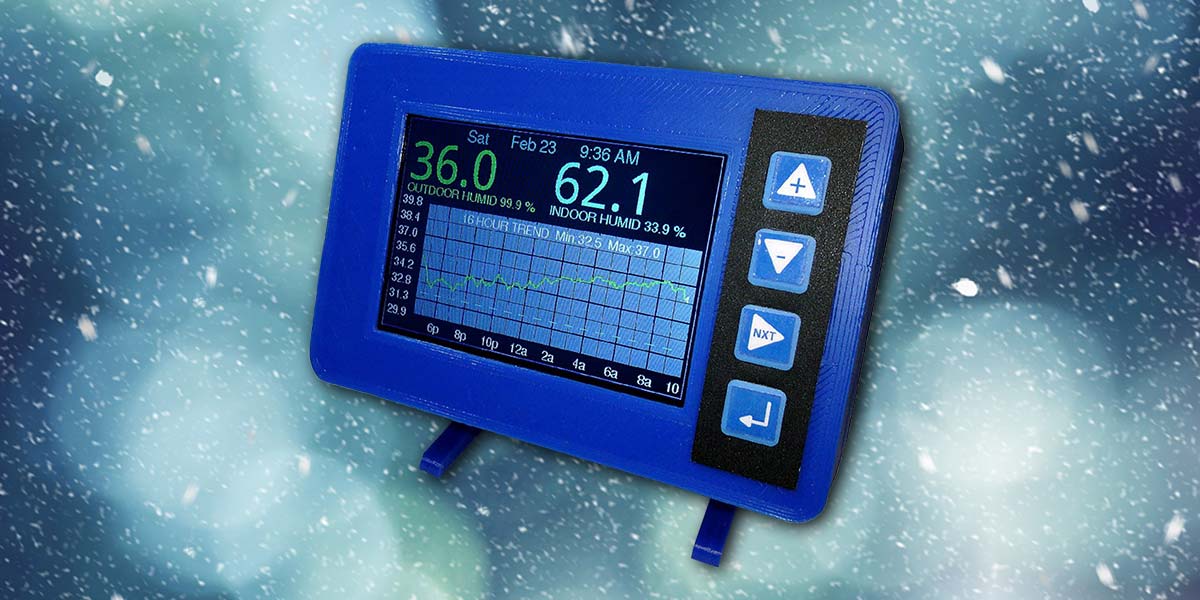
The display presented by this instrument is shown in Figure 1.
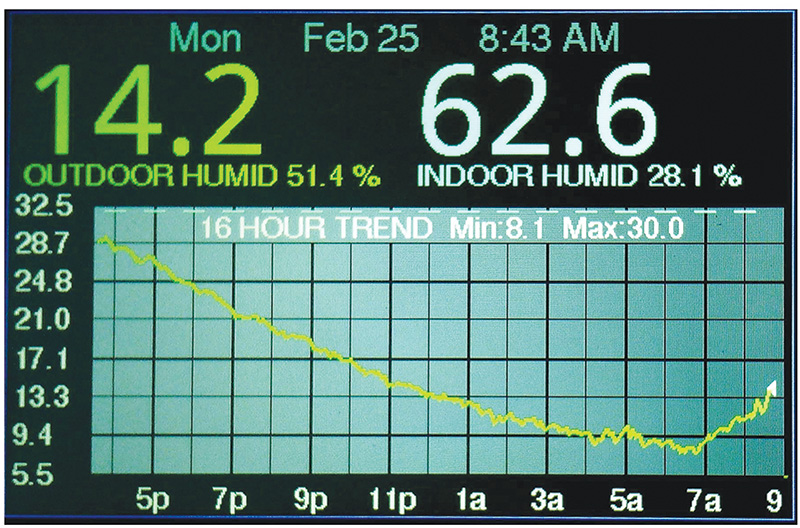
FIGURE 1. Graphics thermometer display.
Day, date, and time appear across the top banner. Next, current temperatures are shown on large digital displays, with humidity readings appearing right below these readouts.
Now comes the fun part! A graphical plot of Temperature vs. Time is displayed showing recent temperature trends.
The vertical Y axis can be configured to C° or F°, while the horizontal X axis represents time just like an oscilloscope trace. The user can press a single button to select “look-back” time periods of 4, 8, 16, or 24 hours.
As you can see, Time-of-Day hour markers label the horizontal axis.
The Hardware
The availability of large (3.5 inch) low cost 480x320 color LCD shields became the prime driver for this project. These high quality LCD display modules are now readily available in the $8-$12 range and make bright, colorful digital readouts as well as high resolution graphical plotting very affordable. Additionally, these displays plug directly onto an Arduino Uno or Mega 2560 board (Figure 2) and are fully supported by the Arduino IDE software libraries.
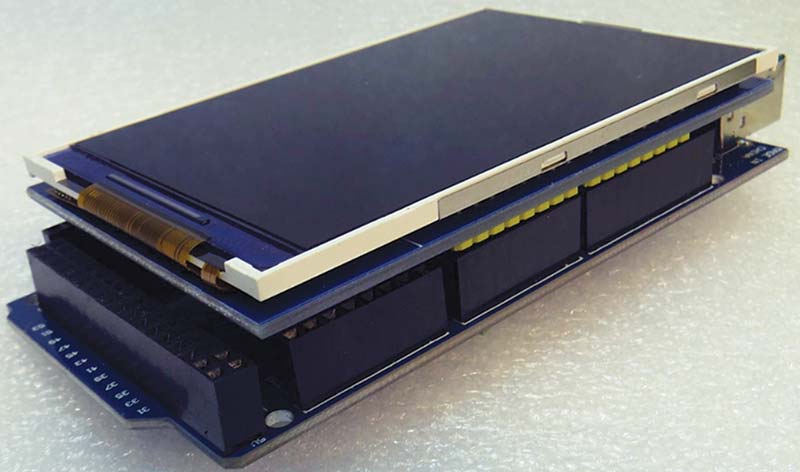
FIGURE 2. Low cost LCD mates directly to Arduino Mega.
Which CPU: Uno or Mega?
At first blush, the modest I/O requirements of this project can be easily handled by either the Arduino Uno or Mega processors. However, a few quick calculations reveal that for my implementation, the goal of storing and plotting 24 hours of temperature data will require about 3.2 KB of RAM memory.
Also, while the core program is not big, in order to render high quality characters for the big digital readouts, several sizable font data tables must be stored alongside the program itself.
For these reasons, the Uno with only 2 KB of RAM and 32K of program memory falls short of our needs. The Mega 2560 with its 8 KB of RAM and 256 KB program capacity, however, fits the bill nicely!
Sensors
I started this development using some “one-wire” 18B20 digital temperature sensors that I had on-hand. While these worked great, I found that the I2C one-wire DHT21 sensors could provide temperature and humidity data for only about $3.50 apiece.
With a couple of these guys, indoor and outdoor data is easily captured. Since these sensors require only one data line, a power wire, and a ground wire, a length of three-conductor ribbon cable is all that is needed for a simple window-sill pass through to the outdoor sensor.
The Clock and Four-Button Control Panel
After getting an early prototype working, I decided to add an RTC enhancement. For just a couple of bucks, a DS3231 RTC add-on module provides accurate, battery-backed clock-calendar information. A few pushbuttons make clock setting easy. The same button array allows the user to easily select the desired trend-plot period.
The Schematic
The complete schematic for the graphing thermometer is shown in Figure 3.

FIGURE 3. A complete schematic of the Arduino graphing thermometer.
Powered by a simple Arduino wall wart or 5V cell phone charger, the user interacts with the instrument through a simple pushbutton array.
If you’ve already got a spare Mega board, power pack, and a few routine junk box items on-hand, you’ll be spending less than $25 to add the color graphics LCD display (~$10), RTC module (~$2), sensors (~$3.50 ea), and pushbutton array (~$2).
If you don’t have access to a 3D printer or are not inclined to make your own case, a complete set of 3D printed enclosure parts may be purchased through the Nuts & Volts Junk Box store.
The Software
Tried and true support libraries are used to manage the RTC interface, DHT21 sensor interface, LCD color graphics display, and pushbutton debouncing. These must be downloaded and added into your IDE library. The Arduino source code for the graphing thermometer is found in the download material. Here are a few highlights to give you a head start on understanding the program details.
First off, as is usual for Arduino projects, the device libraries, a few configuration constants, and some key data variables are initialized in the Setup() routine.
Then, the main loop (Figure 4) begins and repetitively runs through the following task list:
- Update Time-Of-Day display once per minute.
- Read sensors and update displays once every two seconds.
- Add new value into trend memory once per minute.
- Check for operator pushbutton presses.
• Go to Set-Clock routine when PB1 (+) is pressed.
• Change trend period if PB3 (Next) is pressed.
- Update and redraw the trend graph once per minute.
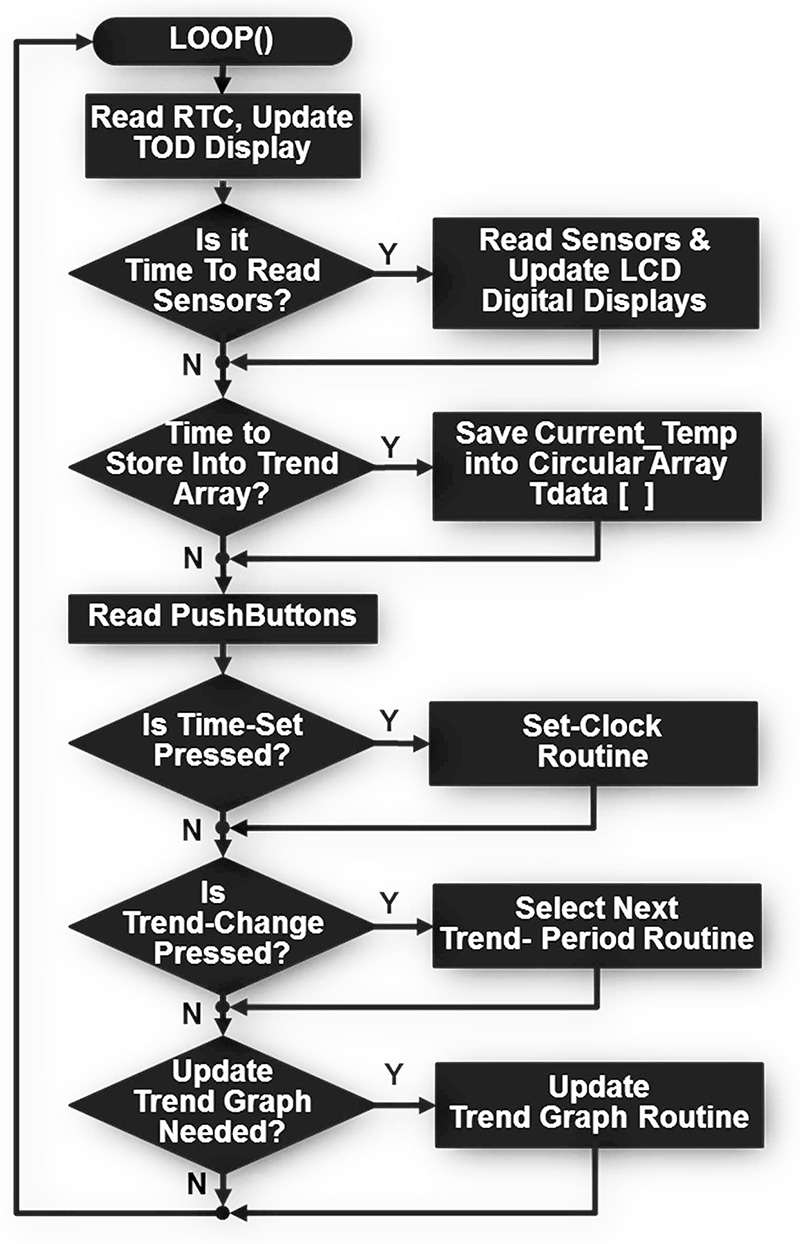
FIGURE 4. Main loop().
Storing Temperature Values into Trend Memory
Floating point temperature readings (°C) are retrieved from each DHT21 sensor every two seconds. The outdoor reading is converted into a 16-bit signed integer value in units of “tenths-of-a-degree-C” for inclusion into the trend memory integer array, Tdata[ ]. Dimensioned to hold 1530 elements, Tdata[ ] is sized to hold 25.5 hours of outdoor-temperature readings.
Once per minute, the global array index pointer, GBL_TdataNewPtr is incremented and the current outdoor temperature reading is stored into Tdata[GBL_TdataNewPtr]. In this way, pointer GBL_TdataNewPtr steps through all 1530 locations of the Tdata[ ] array, filling it up with readings until it’s holding the 1530 minutes (25.5 hours) of data.
When the end of the array is reached, GBL_TdataNewPtr is reset back to zero, thus wrapping back around in a “circular” fashion to the first array location. A few simple range-limiting “if tests” are used to keep GBL_TdataNewPtr operating properly as it reaches the array end-point boundaries. With this approach, it’s seen that every new temperature reading added into Trend-Memory automatically deletes and replaces the oldest reading in the Tdata[ ] array.
As a side note, upon program startup (i.e., unit plugged into AC power or CPU reset button pushed), every element of Tdata[ ] is initialized to a value defined as “NoData” (const int NoData = 9999;). This value is ignored when making trend plots and keeps erroneous, random power-up values from polluting the trend graph.
Creating a Trend Plot
In order to make a trend plot, we need to convert our stored temperature readings into XY point coordinates on the LCD display. Figure 5 shows that the X axis of our trend graph represents Time and the Y axis represents Temperature.
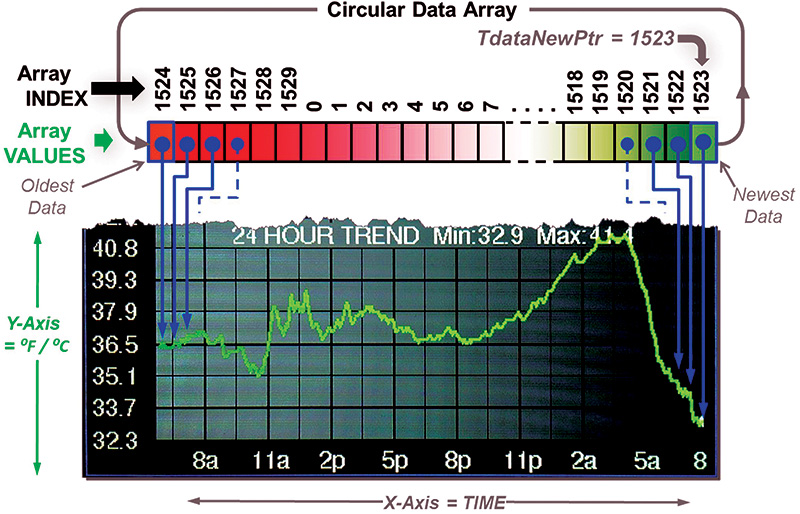
FIGURE 5. Trend data is stored in a circular data array.
To make our graph, we need to map the temperature VALUES into Y coordinates for display. Similarly, we must transform each array INDEX pointer into an appropriate X coordinate. This might be a difficult task were it not for the handy Arduino map(...) function. As shown in Figure 6, this function will convert an input value (In_Value) to an output value (Out_Value) using a linear straight-line transfer function. The passed parameters In_Low, In_Hi, Out_Low, and Out_Hi define the equation of a straight line with an appropriate slope and offset. The function then accepts the In_Value in “tenths of a degree” and returns the mapped Out_Value in Y axis pixel coordinates.
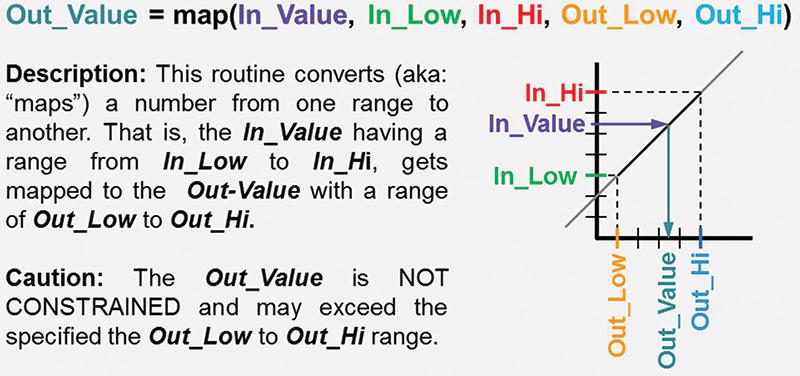
FIGURE 6. The map function converts data for graphing.
Y Axis Graph Scaling
To better visualize trends and accentuate even small temperature changes, we perform automatic “Y axis scaling” every time a new trend graph is drawn. In order to do this, the data to be plotted is quickly pre-scanned to find the MaxTemp (highest) and MinTemp (lowest) values within the plot data set.
With these limits in hand, the Y axis graph can be “centered” about the mid-point of these two limits. Then, the overall graph “gain” is adjusted so that MaxTemp values plot at or near the very top of the graph, while MinTemp values plot at or near the bottom of the graph.
To do this, the MaxTemp/MinTemp limits are used to drive the map(...) In-HI/In_Low values. By setting the Out_Low to the bottom Y coordinate of the graph plot and Out_HI to the top Y coordinate, the map(...) function is all set to deliver a fully scaled Y coordinate for each temperature value we graph.
X Axis Graph Scaling
It’s also necessary to scale and map the X axis properly. This process is slightly more complicated since the user can select trend plot periods of 4, 8, 16, or 24 hours. We are further challenged by the ‘circular nature’ of the trend memory Tdata[ ] array. To scale X, we need to have an algorithm that will ‘cherry-pick’ and extract just the 380 points that we need to plot to the screen from the Tdata[ ] “database” of 1530 readings.
This is done by hopping/skipping through the trend data array in defined steps in order to pick out just temperature readings that are within the time period we are showing in our graph. The “Skip_Step_Size” value is calculated as shown in Figure 7.
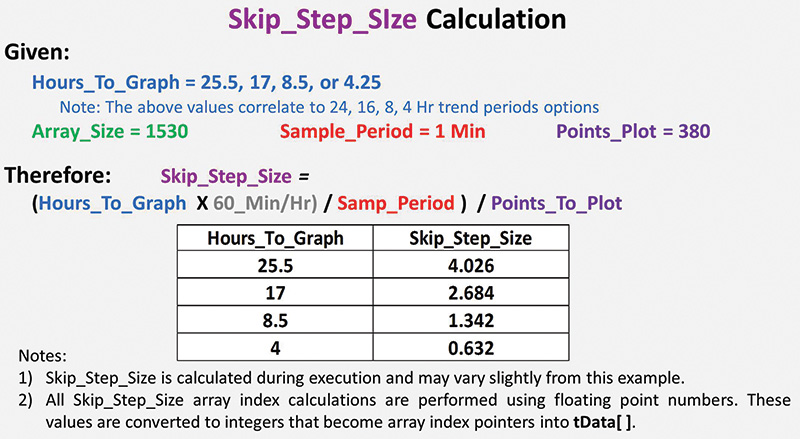
FIGURE 7. X axis scaling formula.
To trace the graph, we always begin plotting from the right side of the screen, starting with GLB_TdataNewPtr — the newest and most recent array element stored. In concept, we then march from the right screen edge towards the left screen edge, pixel by pixel, while repetitively subtracting the Skip_Step_Size value from GLB_TdataNewPtr.
In this way, we are ‘stepping back in time’ to retrieve and plot the stored temperature history values as we go. We keep doing this until we have plotted all X axis locations of our graph (about 380 points). If you pay close attention during graph updates, you’ll see that the graph does indeed paint to the screen from right to left.
The Lines Between the Points
In order to avoid a dotted-line effect, we actually draw short lines between adjacent data points to fill in any spaces that might appear during large temperature swings. Because our pixels are so small, we also take steps to draw “double-wide lines” to make the trace easier to see.
The Challenge of Plotting Big Characters
Graphic plotting routines such as fillRect(...), drawLine(...), drawPoint(...), print(...), and others are provided by the LCD graphics library and are used throughout the program to create our finished display. Unfortunately, the LCD display module itself is pretty basic and doesn’t include many on-board line drawing, text printing, or other graphics hardware acceleration features.
This means that the host CPU (our Mega) must do most of the work. Getting good-looking text onto the screen is a particularly compute-intensive task. Figure 8 shows the high-level steps required to ‘print’ a temperature reading onto the LCD screen.
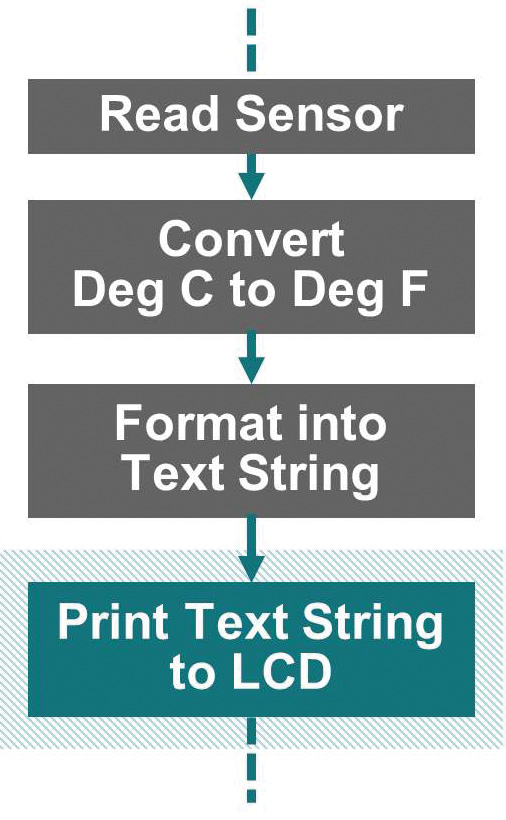
FIGURE 8. Overview of text “printing” to the LCD.
Figure 9 presents the next level of details that show that the CPU must first clear out the rectangular background region behind the new text to erase whatever was previously drawn onto the screen. Next, the Mega must retrieve the bit pattern of each character from a character pattern lookup table.
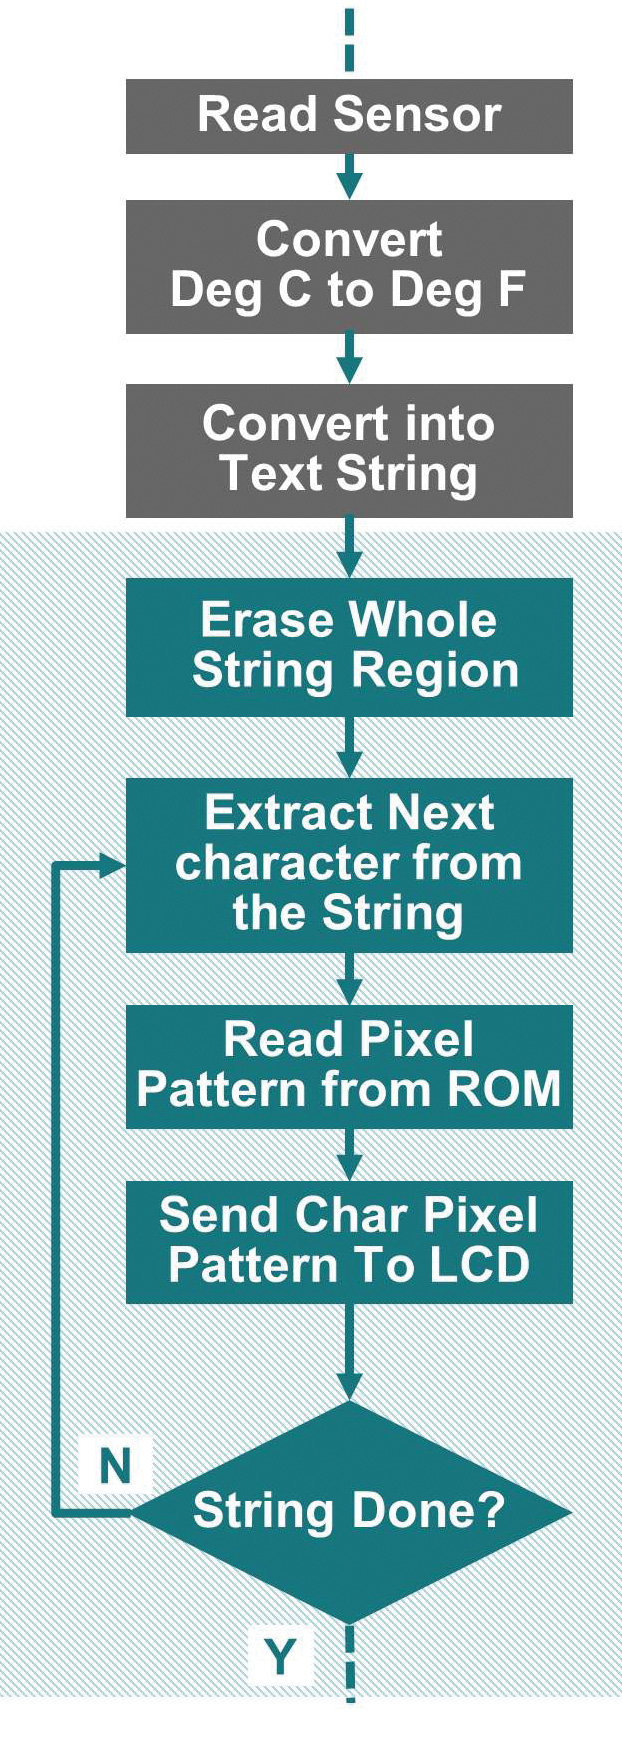
FIGURE 9. Text printing details.
Finally, the CPU must write each of the character pattern ‘foreground pixels’ to the LCD display memory. Since each of these actions take many CPU cycles to complete, the slow (by today’s standards) 16 MHz clock of the Mega is noticeably sluggish getting the job done.
Although the processes are reasonably fast for small sized characters (i.e., 10 point fonts), it’s noticeably slow forming the large digits of our main temperature readouts. Since we update these values every couple of seconds, the flashing it causes on these displays is hard to overlook!
What Can be Done to Speed Things Up?
Figure 9 shows that the most straightforward way to print a number to the screen is to simply read a new temperature value, format it for printing, and then mindlessly ‘draw’ it out in entirety to the LCD screen. Your smartphone or desktop/laptop computer is so fast doing these steps, you can’t even appreciate all that’s happening.
However, with the Mega, our big digits blink even when their values didn’t change, and we are just erasing and writing back the same characters to the screen. If we insert some logic in front of the screen writing steps to ensure we only write to the screen when we absolutely have to, we can improve performance.
For example, if a temperature value changes from 39.4 to 39.8 degrees, we really only need to update and change just one character; that is, turn the 4 into an 8.
By avoiding the needless rewrites of the “3,” “9,” and “.,” we can effectively update the display three times faster. In fact, if the temperature is stable and isn’t changing, we don’t write anything to the screen!
By preceding the screen write process with a New-character vs. a Previous-character comparison (Figure 10), we can avoid rewriting unchanged text.
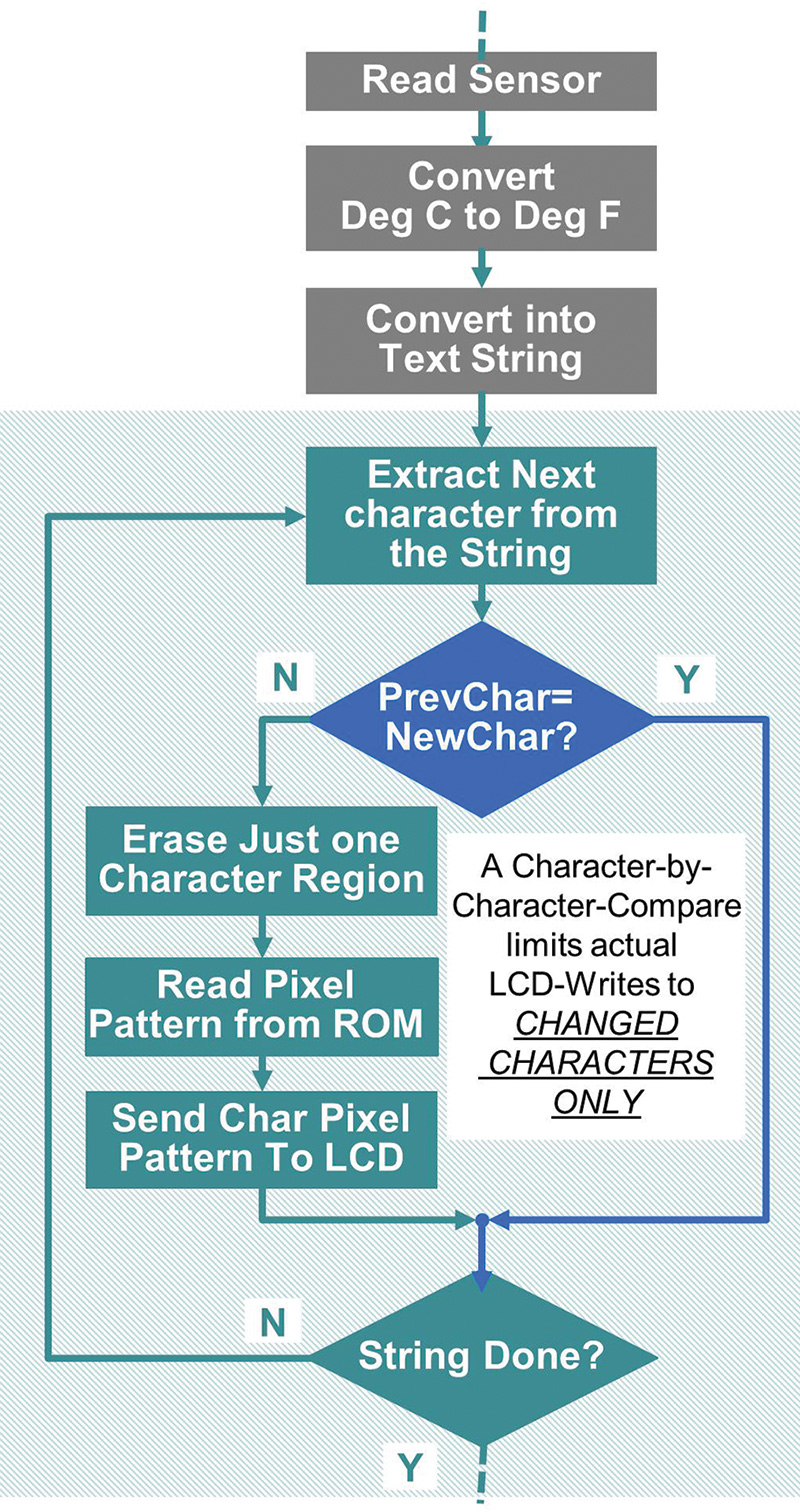
FIGURE 10. Improved “Print String to LCD” scheme.
This technique proved to work well and greatly improves the overall appearance of the instrument. It’s pretty simple to do and only requires a few bytes of RAM to ‘remember’ what we printed to the screen during the previous pass through the main loop.
Assembly and Packaging Challenges
The packaging, wiring, and enclosure design for this project proved to have its own design challenges. At first, I thought it was very handy that the LCD plugged on top of the Mega CPU. After all, this simultaneously completes about 20 interconnections while creating a solid CPU-display subassembly. However, once joined together, it became apparent that there weren’t any convenient mounting holes to anchor the screen to an enclosure opening.
Additionally, the LCD module obstructs access to the CPU pins that we need to connect to the sensors, RTC module, and the pushbuttons. Who’d of thought! Here’s what worked for me.
Enclosure Design
Since I’m always looking for projects to justify the purchase of my 3D printer, a printed enclosure was always in the back of my mind for this project. To this end, I used SolidWorks to model all the internal parts and come up with the case design shown in Figure 11. Connectors on the back side of the enclosure go to the temp/humidity sensors. Note: I chose to keep the indoor temp/humidity sensor external to the enclosure so that heat from the electronics wouldn’t affect the indoor readings.
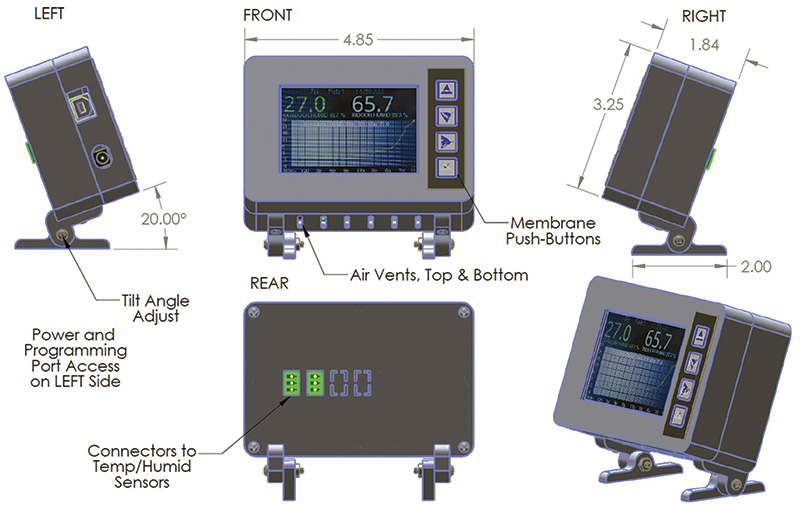
FIGURE 11. Enclosure overview.
Figure 12 shows the 3D printable parts that make up the project enclosure (five unique items for a total of seven pieces to print). An internal CPU-LCD frame provides the means to secure the LCD/CPU to the front panel.
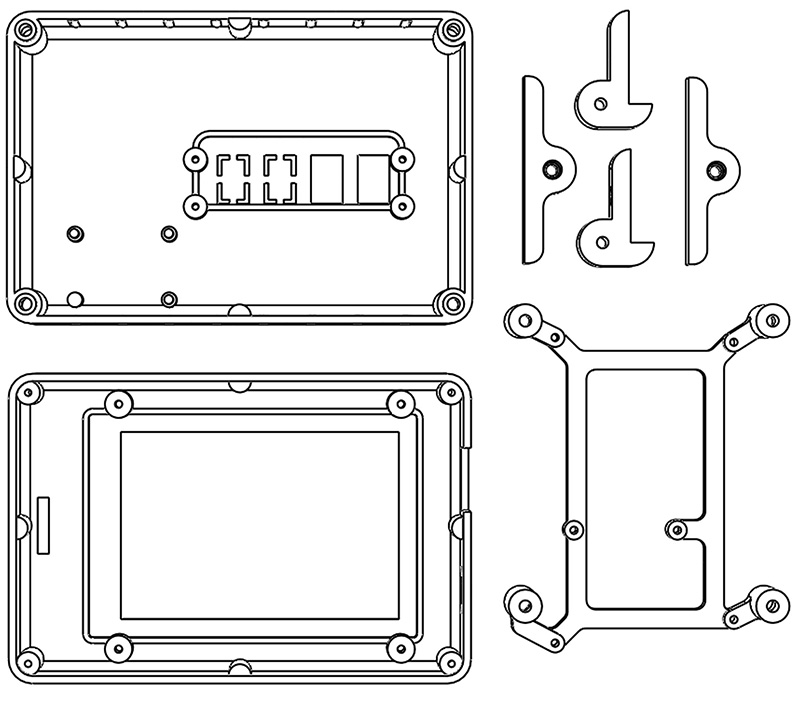
FIGURE 12. 3D printed enclosure parts (rear view).
I printed all the parts with PLA filament and achieved very good dimensional accuracy and part fit. As printed, the rear panel has cut-outs for two three-pin sensor connector ports with an additional pair of knock-out features should you wish to add more sensors.
Tapping Case Parts and Putting Things Together
Detailed assembly steps that show how the whole project comes together are found in Figure 13.
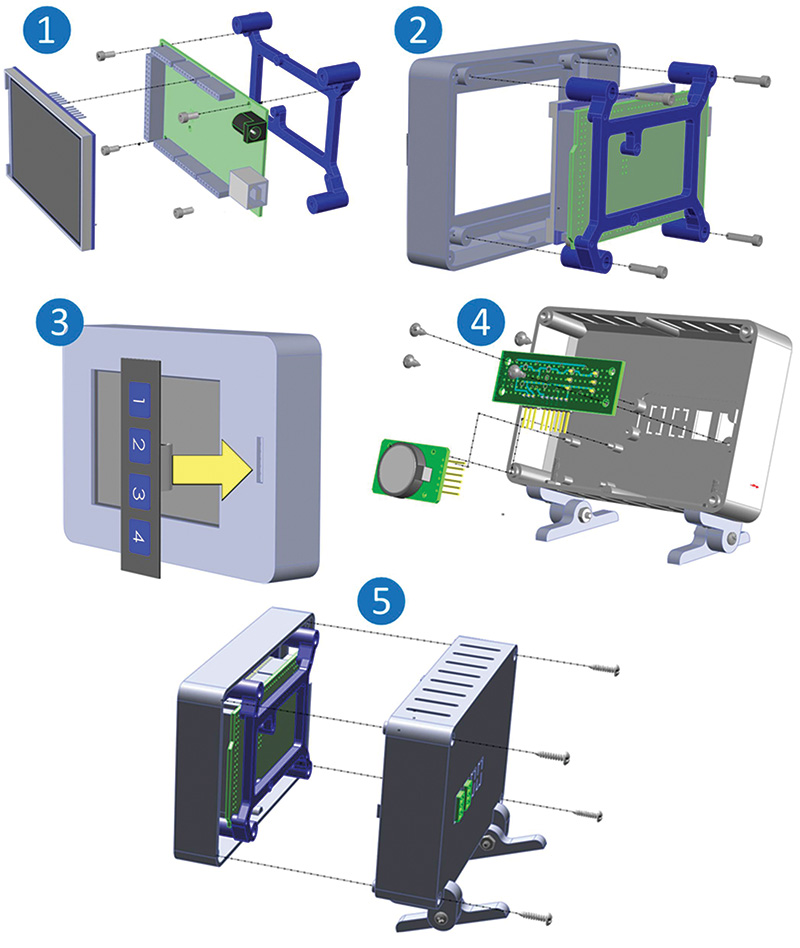
FIGURE 13. Enclosure and final assembly details.
You can see that the CPU board mounts to the CPU frame using 4-40 machine screws (Figure 13_1). After printing, the CPU-to-frame holes are easily threaded using a standard 4-40 hand tap. The CPU-LCD frame subassembly attaches to threaded “boss features” found on the back side of the front panel.
Rather than use a hand tap, I found that threads could be easily formed by carefully turning a 4-40 x .25 in machine screw into each boss. Just go slow and keep the screw straight and true.
With its self-adhesive backing, Figure 13_3 shows that the 1x4 membrane switch is easily affixed to the front panel. I color printed custom button legends onto paper label stock to create appropriate button labels. A layer of clear tape placed on top of the new legends will improve their wear resistance.
As an alternative to a membrane switch, you could use discrete pushbutton switches or even eliminate mechanical switches altogether by buying an LCD display module with the touch screen attached. Uno/Mega touch-screen LCDs with the same mechanical layout can be readily found for just a few dollars more than the no-touch model I used.
Of course, you’ll have to add a compatible touch library and rework the pushbutton control logic in the software to support this change.
The two tilt-stand legs are assembled with 4-40 screws (more tapping required!) and then are attached to the rear panel with 4-40 machine screws through the bottom enclosure vent slots. Nuts on the backside of the vents complete the attachment (Figure 13_4). Note in the figure that the tilt angle can be easily tweaked after the project is up and running.
The sensor interface PCB (prototype circuit board), is mounted to the rear panel with four No. 4 x 1/4 inch self-tapping screws (Figure 13_4). Although I have included Gerber files for a sensor connector interface PCB this board is so simple that it could be fabricated using a small piece of .1 in x .1 in grid prototype board material. The download materials for this article have complete details for the sensor interface board using either of these construction methods.
Finally, the RTC module slips onto posts projecting from the rear panel (Figure 13_4). These posts can be melted over with a soldering iron to retain the RTC module or a few layers of two-sided foam tape could be used to simply stick it to the rear panel surface.
Once all the internal wiring has been completed per the schematic (see also next section), the front panel is joined to the rear panel with four No. 4 x 1/2 inch self-tapping sheet metal screws (Figure 13_5).
Enclosure Design Files
As mentioned, a full set of 3D printer-ready STL files for all the enclosure parts is included in the download material. You’ll also find the native SolidWorks (2013) design files and dimensioned 2D drawings (PDF), as well as STP files that should allow you to transfer the design into your favorite 3D CAD program for tweaks and changes.
Wiring Challenges and Options
In order to connect the CPU to the sensors, RTC, and pushbuttons, one needs to either solder wires to the back side of the Mega (yuck!) or figure out a different way to make U-turn connections that can redirect the top-side CPU I/O ports to the back side. I came up with two different methods to deal with this challenge:
RTC Wiring: To make the SDA and SCL pin connections between the Mega and the RTC module, I cut individual pins from a strip of long length (~20 mm overall length) male SIP pins. I then carefully formed the pins into a U shape as shown in Figure 14. This enabled the use of female-to-female socket wires to link the RTC to the CPU.
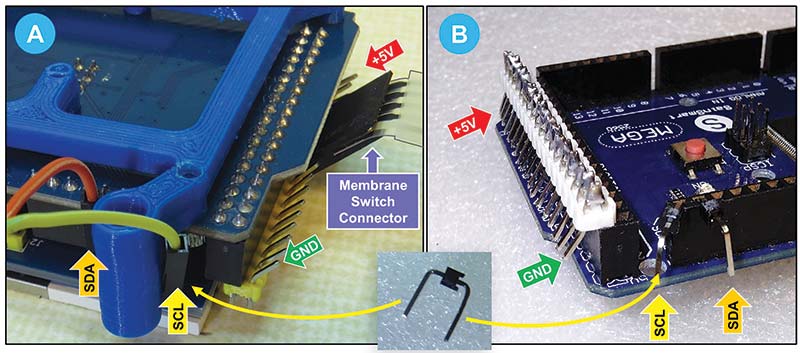
FIGURE 14. Making Mega U-turn connections. Note: LCD panel and frame are present in view A, but are not shown in view B.
Pushbuttons, Sensors, +5V, and Ground Wiring: For the remaining connections, I used a 36-pin double-row male header to make an 18-position U-turn connector. By first clamping the header into the vice, I was then able to bend the short pins close enough to one another, so I could make a solder bridge across each of the pin pairs (Figure 14B). Build Note: Don’t skip the “vice” as the plastic pin frame is easily broken while attempting to bend the individual pins.
Once you insert one row of pins into the Mega, carefully form a slight angle onto each of the outer rows of pins as shown in Figure 14A. This makes it possible to connect female socket wires from the back side of the CPU board. From this U-turn connector, we can get to +5V, ground, and all the odd-numbered I/O ports from D23 to D53. Since the 1x4 membrane switch already terminates in a .1 in pitch SIP female connector, it can plug right onto the U-turn connector (pins D37, D39, D41, D43, and D45 of Figure 14A).
I used discrete female-to-female socket wires to link to the temp/humidity sensor signal lines (Mega pins D23 and D25), and the +5V and ground wires to the sensor interface board. Just be sure to count pins carefully so as to locate and plug everything into the right pins!
As indicated back in the schematic (Figure 3), the RTC module gets its power and ground from the sensor interface board using a couple more female-to-female socket wires.
Need to Change Port Assignments?
While the SDA and SCL wire pair going to the RTC are locked pin assignments that you won’t want to change, wiring to all the other devices can be moved to any open pins that might work better for you. This can be done by simply editing the source code to match the pin assignments of your wiring scheme.
Enhancements and Other Project Ideas
Falling prices for high quality color LCD graphics displays make them viable alternatives to the plain old monochrome text displays or even the seven-segment LED digital readouts that we’ve come to rely on for our microcontroller projects.
While I’ve described a ready-to-go weather-watch device using a graphic display in a fun and useful way, the packaging and design concepts presented here can serve as a launch-point for other projects. In fact, this core design has all the elements needed to build a great looking graphics clock. With the addition of a small speaker, adding a wake-up alarm is easy.
Whether it be temperature trends, time and date, current/voltage readings, battery status, or other variables, consider giving your next project some extra pizazz by including an LCD color graphics display into the design!
Take care and happy graphing! NV
References
Arduino IDE, Arduino libraries, useful guides, and references
https://www.arduino.cc
Graphics thermometer software and hardware details
https://github.com/Ed-EE-Eng/Graphics_Thermometer
gfx Graphics Library
https://github.com/adafruit/Adafruit-GFX-Library
Documentation/guideline for using AdaFruit gfx Library
https://learn.adafruit.com/adafruit-gfx-graphics-library
RTC Library
https://github.com/adafruit/RTClib
Guideline for Installing and using MCUfriend graphics helper library
https://forum.arduino.cc/index.php?topic=366304.0
Bounce2 Pushbutton Debouncing Library
https://github.com/thomasfredericks/Bounce2
DHT Sensor Library
https://github.com/adafruit/DHT-sensor-library
Parts List
| ITEM |
QTY |
DESCRIPTION |
SOURCE |
PN/ORDERING INFO |
NOTES |
| 1 |
1 |
ARDUINO MEGA CPU |
Arduino.cc
+ Others |
ARDUINO MEGA CPU |
Alt: Search eBay for MEGA compatible |
| |
|
|
|
https://store-usa.arduino.cc/products/arduino-mega-2560-rev3?selectedStore=us |
| 2 |
1 |
ARDUINO AC POWER SUPPLY |
Various,
eBay |
UNO/MEGA POWER SUPPLY, 9 VDC 1A |
5V phone charger + cable is an option |
| |
|
|
|
eBay Search: Arduino Uno Power Supply Adapter 9 VDC |
| 3 |
1 |
3.5 IN 480x320 LCD DISPLAY |
eBay |
3.5 IN TFT LCD SCREEN MODULE 480x320 FOR ARDUINO UNO & MEGA |
Consider adding “Touch Screen” to eBay quiry |
| |
|
|
|
Search for: TFT LCD Screen Module 480x320 Arduino UNO MEGA |
| 4 |
1 |
DS3231 RTC MODULE |
Various,
eBay |
DS3231 RTC MODULE |
|
| |
|
|
|
eBay Search: DS3231 RTC Real Time Clock Module |
| 5 |
1 |
CR2032 BATTERY |
Various,
eBay |
CR2032 BATTERY |
For use with item 4 |
| |
|
|
|
eBay Search: CR2032 BATTERY |
| 6 |
1 |
PB1, PB2, PB3, PB4.
1x4 PUSHBUTTON ARRAY |
Various,
eBay |
MEMBRANE 1x4 PUSHBUTTON ARRAY |
Not req’d if item 3 has touch screen |
| |
|
|
|
eBay Search: 1x4 Matrix Array Keypad |
| 7 |
1 |
SENSOR INTFC PCB ASSEMBLY |
----- |
Consists of items a-e below |
|
| 7a |
1 |
PCB - PROTOTYPE CIRCUIT BOARD |
Various,
eBay |
DIY Prototype Circuit Breadboard PCB Universal Board 2x8 cm |
See online build layout details to match 3D case mtg holes |
| |
|
|
|
eBay Search: 2x8 cm Double Side PCB |
| 7b |
2 |
P1, P2. TERM BLOCK HDR 3-POS VERT 3.5 MM PCB MNT. NOTE: SCREW TERM MATE REQUIRED |
Digi-Key |
PCB PART: WM7752-ND @ .78 ea
MATING PART: WM7733.ND @ $1.14 ea |
|
| |
|
|
eBay |
eBay Search: 3-pin 3.5 mm Pitch PCB Plug in Terminal Block |
| 7c |
1 |
P7. 3-PIN RT ANG MALE TERM |
Digi-Key |
SAM1051-03-ND @ .25 ea |
ALTERNATE: Cut from longer strips; eBay link is for 10 Pcs x 40-pin @ $3.80 |
| |
|
|
eBay |
eBay Search: 40-pin 2.54 mm Single Row Right Angle Pin Header Strip |
| 7d |
1 |
P5. 6-PIN RT ANG MALE TERM |
Digi-Key |
AM1051-06-ND @ .46 ea |
ALTERNATE: Cut from longer strips
(See notes for item 8) |
| 7e |
2 |
R1, R2. RES 4.7K 1/4W 1% AXIAL |
Digi-Key |
4.75KXBK-ND |
Value not critical. Can use 4.7K to 10K value, 5-10% precision OK |
| |
|
|
|
eBay Search for: 4.7K .25 watt Metal Film Resistor |
| 8 |
2 |
S1, S2. DHT21 TEMP/HUMIDITY SENSOR MODULE |
Various,
eBay |
DHT21 AM2301 DIGITAL TEMPERATURE/ HUMIDITY SENSOR MODULE FOR ARDUINO |
|
| |
|
|
|
eBay Search: DHT21 AM2301 Sensor Module |
| 9 |
4 |
NO_4 x .25 IN SELF-TAP SCREW |
Various |
STEEL, NUM 4, 1/4 IN SHEET METAL SCREW |
See McMaster PN for more details |
| |
|
|
McMaster |
90077A106 (Box of 100 Pcs @ $1.45) |
|
| 10 |
4 |
NO_4 x .5 IN SELF-TAP SCREW |
Various |
STEEL, NUM 4, 1/5 IN SHEET METAL SCREW |
See McMaster PN for more details |
| |
|
|
McMaster |
90077A110 (Box of 100 Pcs @ $42.21) |
| 11 |
4 |
4-40 x .5 IN SOCK HD MACH SCREW |
Various |
STEEL, NUM 4, 1/4 IN SHEET METAL SCREW |
See McMaster PN for more details |
| |
|
|
McMaster |
92196A110 (Box of 100 Pcs @ $4.20) |
| 12 |
4 |
4-40 x .25 IN SOCK HD MACH SCREW |
Various |
STAINLESS STL SCKT HD SCRW 4-40 x 1/4 IN |
See McMaster PN for more details |
| |
|
|
McMaster |
92196A106 (Box of 100 Pcs @ $3.92) |
| 13 |
4 |
4-40 x .75 IN PHIL HD MACH SCREW |
Various |
STAINLESS STL PHIL HD SCREW 4-40 x 3/4 IN |
See McMaster PN for more details |
| |
|
|
McMaster |
92196A113 (Box of 100 Pcs @ $4.97) |
| 14 |
4 |
4-40 HEX NUT |
Various |
STAINLESS STL HEX NUT 4-40 |
See McMaster PN for more details |
| |
|
|
McMaster |
91841A005 (Box of 100 Pcs @ $3.02) |
| 15 |
1 |
INTERNAL WIRING |
Various |
MISC PINS, CONNECTORS, WIRES |
Misc odds and ends |
| 16 |
1 |
ENCLOSURE - FRONT PANEL |
3D PRINTED |
FRONT PANEL, 3D PRINTED (PLA) |
SEE ONLINE DOCS FOR DETAILS |
| 17 |
1 |
ENCLOSURE - REAR PANEL |
3D PRINTED |
REAR PANEL, 3D PRINTED (PLA) |
SEE ONLINE DOCS FOR DETAILS |
| 18 |
1 |
CPU/LCD MOUNTING FRAME |
3D PRINTED |
MOUNTING FRAME, 3D PRINTED (PLA) |
SEE ONLINE DOCS FOR DETAILS |
| 19 |
2 |
TILT BASE, CASE MOUNT |
3D PRINTED |
TILT-CASE MNT, 3D PRINTED (PLA) |
SEE ONLINE DOCS FOR DETAILS |
| 20 |
2 |
TILT BASE, FOOT |
3D PRINTED |
TILT-FOOT, 3D PRINTED (PLA) |
SEE ONLINE DOCS FOR DETAILS |
Downloads
What’s in the zip?
Gerber Files
Build and Design Notes
Solidworks Files
STL Files
Source Code