Over the past several episodes, we have been learning to use the Arduino handheld prototyper (AHP) — a device that lets us design prototypes on a breadboard with the Arduino proto shield and communicate with the I2C mini terminal. Of course, this is all tied together with a plastic base so that you can carry the entire development system around in your hand (Figure 1).
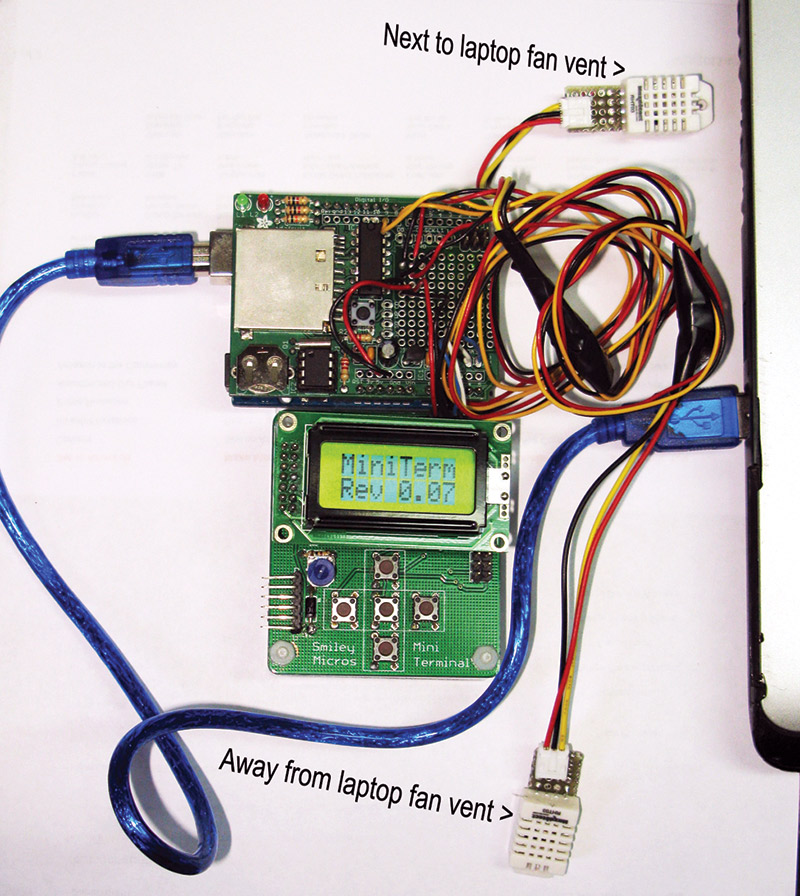
FIGURE 1. Data logger shield with DHT22 sensors.
Last time, we began learning how to record sensor data by seeing how much data we could reasonably save on an Arduino using its resident memory.
So, what if we want to log a lot of data? We really have two choices. First, we can keep the data logger tethered to a PC and use the serial port to upload the data as it comes in. This is great for applications where you don’t mind having a PC handy, but what about the ‘handheld’ part of our prototyper? How can we collect lots of data and have the AHP embedded far away from a PC?
One good solution is to use an SD card since you can store a bazillion samples and then take the SD card out of the AHP and plug it into the card slot on a PC to read the data. Or, you can leave it in the AHP and upload the data to the PC via the serial port. Either way, once the data is on the PC we can put it in a spreadsheet and generate charts.
Let’s look first at how to upload the sensor data directly to the PC via the serial port, then we’ll look at using the SD card — moving it between the AHP and PC.
Logging Data to a Spreadsheet Chart
Let’s simplify things by separating the process of getting the sensor data from the process of uploading data for use in a spreadsheet chart. Let’s generate a test set of data (four sine waves on the Arduino), upload it using PuTTY, then finally chart it with LibreOffice Calc.
Create Some Sine Wave Data in the Arduino
I’ve written a small program that generates data for four sine waves and stores this data into a two-dimensional array, then it sends this data to the PC (sd_sine_array_test.ino). The data is in CSV format. Traditionally, CSV means Comma Separated Variable. However, it is actually used as a character separated variable, where the comma character is the most commonly used character.
I assume you are already familiar with spreadsheets and can use either Excel or LibreOffice Calc (which I will use since it is free). In a spreadsheet, the data is arrayed in cells that have numbers assigned to rows and letters assigned to columns. The spreadsheet knows what a text file with the suffix .csv is and looks for two special characters: the comma to separate columns and the line feed to separate rows. I’m going to also assume you know how the sin() function works in the Arduino, and I’ll use it to generate the four data sets with each sine wave offset by 45 degrees from the other waves.
The following Arduino listing for the setup() function will generate the data for us and will send it to the PC as a .csv file:
void setup()<br />
{<br />
  Serial.begin(57600);
  float in, out;<br />
  uint8_t data[4][62];<br />
  uint8_t count = 0;<br />
  uint8_t i;<br />
 <br />
  for (in = 0; in <= 6.283; in = in + 0.1)<br />
  {<br />
    out = sin(in) * 127.5 + 127.5;<br />
    data[0][count] = out;<br />
    out = sin(in+1.570) * 127.5 + 127.5;<br />
    data[1][count] = out;<br />
    out = sin(in+3.242) * 127.5 + 127.5;<br />
    data[2][count] = out;<br />
    out = sin(in+4.712) * 127.5 + 127.5;<br />
    data[3][count++] = out;<br />
      <br />
  for(i = 0; i < count-1; i++)<br />
  {<br />
    Serial.print(data[0][i]);<br />
    Serial.print(“,”);    <br />
    Serial.print(data[1][i]);<br />
    Serial.print(“,”);     <br />
    Serial.print(data[2][i]);<br />
    Serial.print(“,”);     <br />
    Serial.println(data[3][i]);<br />
  }  <br />
  }<br />
}
void loop()<br />
{<br />
  // do nothing<br />
}
This will send the csv data out the serial port where it can be collected into a .csv file on the PC. Now that we can generate some fake data, let’s see how to upload it to a PC and then use it to draw a chart.
Using PuTTY to Upload the Data
In previous articles, I discussed how to write serial terminal programs using Visual C# or Visual Basic .NET. A data logger would certainly be a good application for these programs, but for those not already familiar with these languages, the learning process isn’t really related to the actual process of logging data from an Arduino to a PC.
So, let’s use an already written and tested terminal program to log the data from the Arduino: PuTTY.
We will then use a spreadsheet program to take that data log and draw a chart of the data that will make it much easier to see what the data is trying to tell us. You can download PuTTY from www.chiark.greenend.org.uk/~sgtatham/putty/download.html.
PuTTY is designed to be a general-purpose program that lets folks use a multi-user computer from a remote location, and thus has a LOT of features — most of which we have no use for. The trick is finding just those features that let us log our Arduino data to the PC. Let’s do that cookbook style.
Download PuTTY and put it on your desktop (Figure 2). Open PuTTY as shown in Figure 3.
FIGURE 2. PuTTY desktop icon.
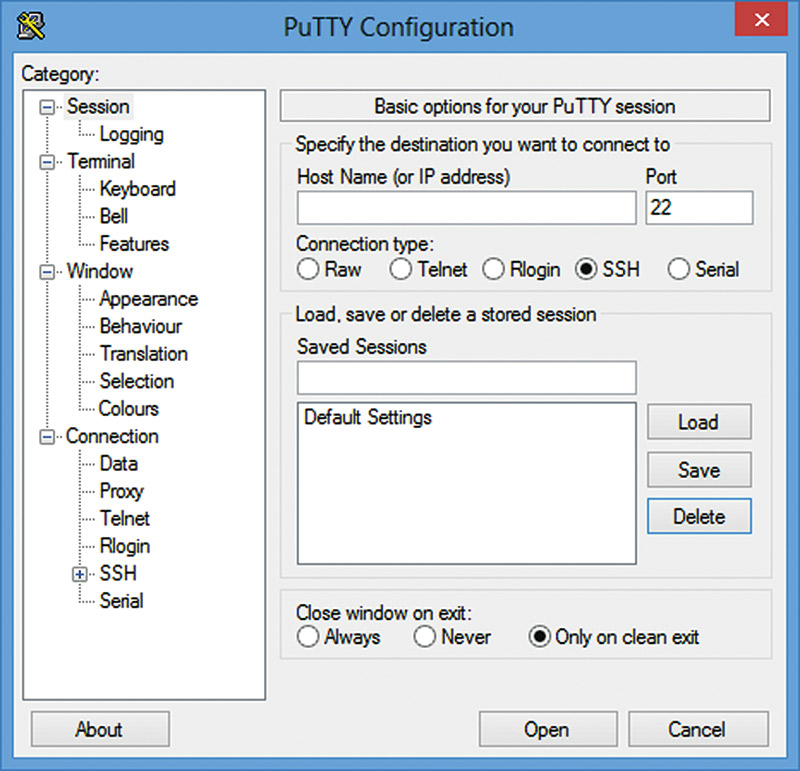
FIGURE 3. PuTTY open window.
Click on the ‘Connection type:’ radio button for serial, then enter the COM# for your Arduino. You can find this number by opening the Arduino menu Tools/Serial Port as shown in Figure 4.

FIGURE 4. Arduino serial port.
Enter this COM# in the Serial line text box and enter the baud rate in the Speed box as shown in Figure 5.
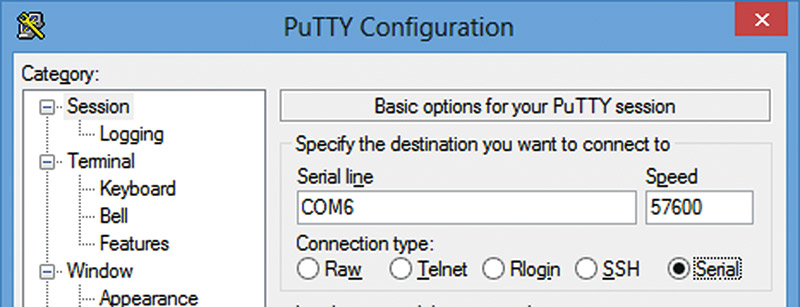
FIGURE 5. PuTTY serial line.
Next, click on the Terminal Category and in the ‘Line discipline options,’ click the ‘Force on’ radio buttons for both ‘Local echo’ and ‘Local line editing’ as shown in Figure 6.
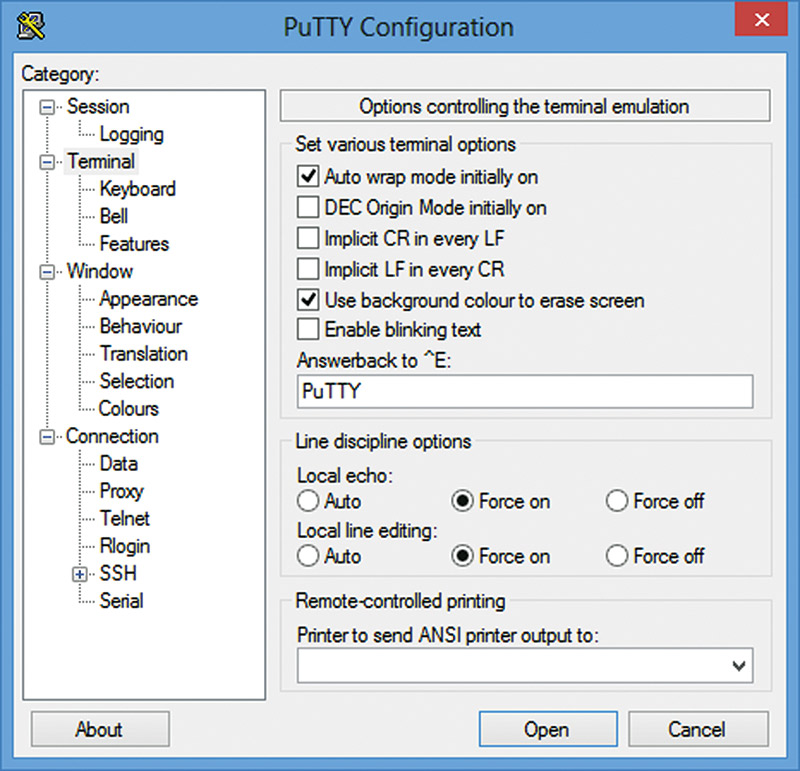
FIGURE 6. PuTTY terminal options.
Next, we want to create a file to save our logged data. Open the Session Logging window and click the ‘Printable output’ radio item. We will create a file name of sine_data.csv (more on the name in a moment) by clicking the browse button, then navigating to the directory we want to use. Enter the file name as shown in Figure 7.
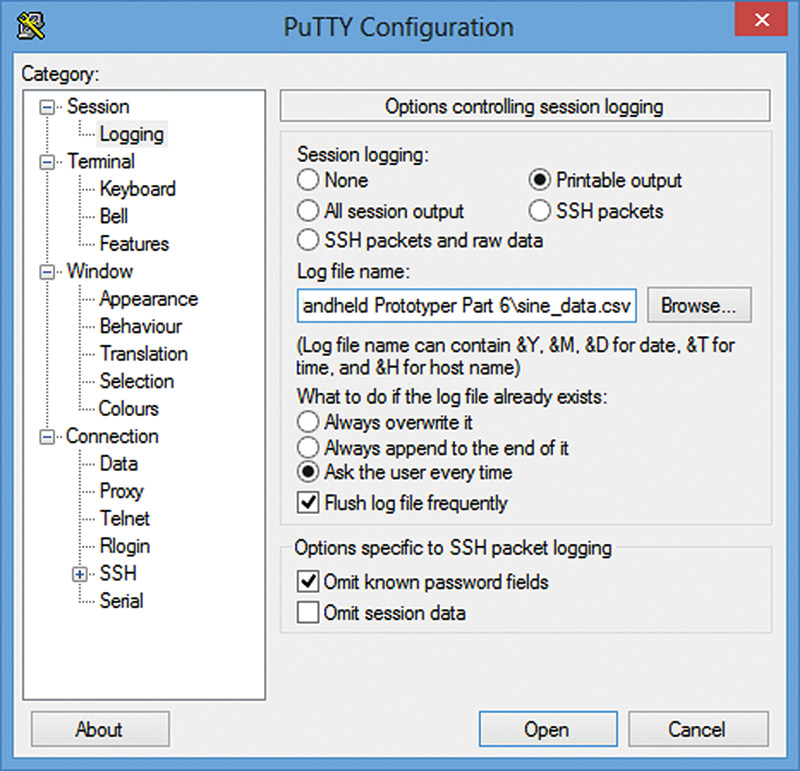
FIGURE 7. PuTTY save log file.
We can now use PuTTY, but let’s first save all the settings we just input so that we can recall them the next time we want to use this program.
Return to the Category Session and save the session settings by typing in a session name (I’ll use mySession) in the ‘Saved Sessions’ text box as shown in Figure 8 and click the Save button.
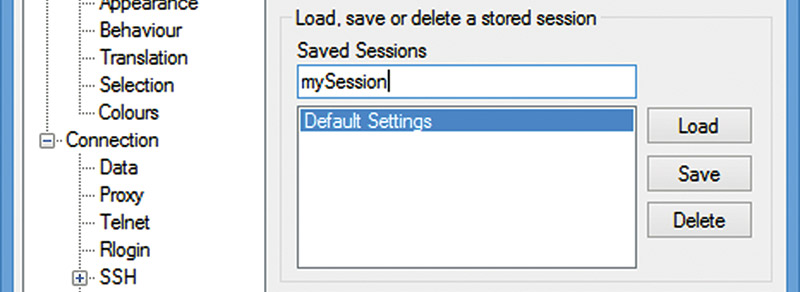
FIGURE 8. PuTTY store session.
This will store the session as shown in Figure 9.
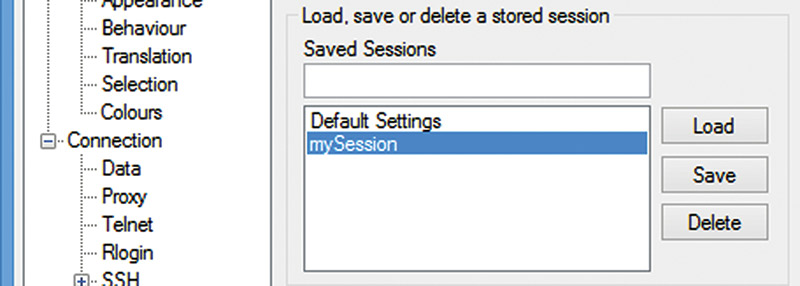
FIGURE 9. PuTTY load session.
The next time you open PuTTY, you’ll have the option of clicking on the mySession item and the ‘Load’ button to have PuTTY install your custom settings. Now, we are ready to use PuTTY to log a session from the Arduino.
Upload the Arduino Data to PuTTY
Click on the ‘Open’ window in PuTTY. If you’ve gotten the Arduino COM number and baud rate correct, you’ll see output from the Arduino sin_array_test.ino program as shown in Figure 10.
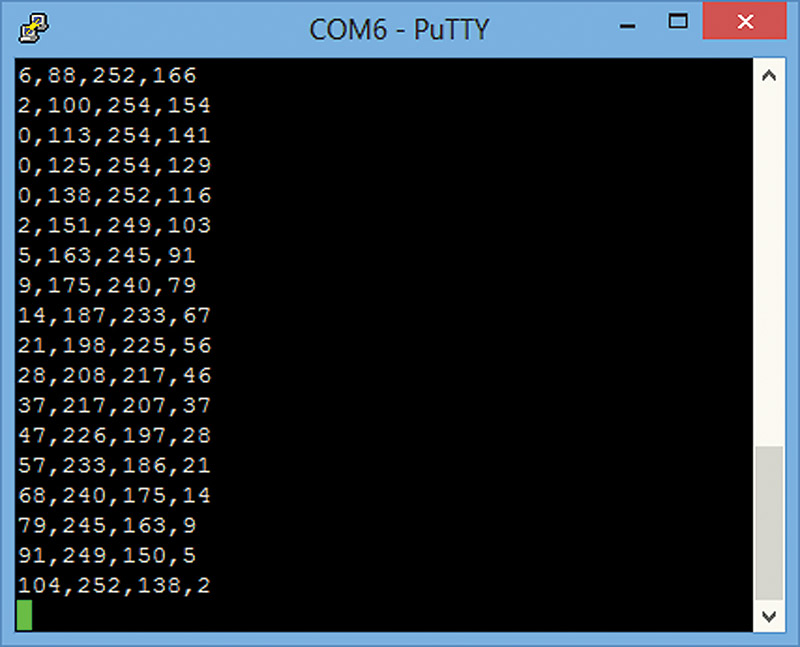
FIGURE 10. PuTTY data log.
You can see that the data is now arranged in rows and columns — much like you’d see in a spreadsheet. The data is saved to the sine_data.csv file that we will open in a spreadsheet.
Open the Data in a Spreadsheet
As I stated earlier, I will use LibreOffice Calc (get it at LibreOffice.org). Open Calc, and in the File menu select Open, then browse to the sine_data.csv file. It will ask you a question about format; just click yes and the data will load as shown in Figure 11.
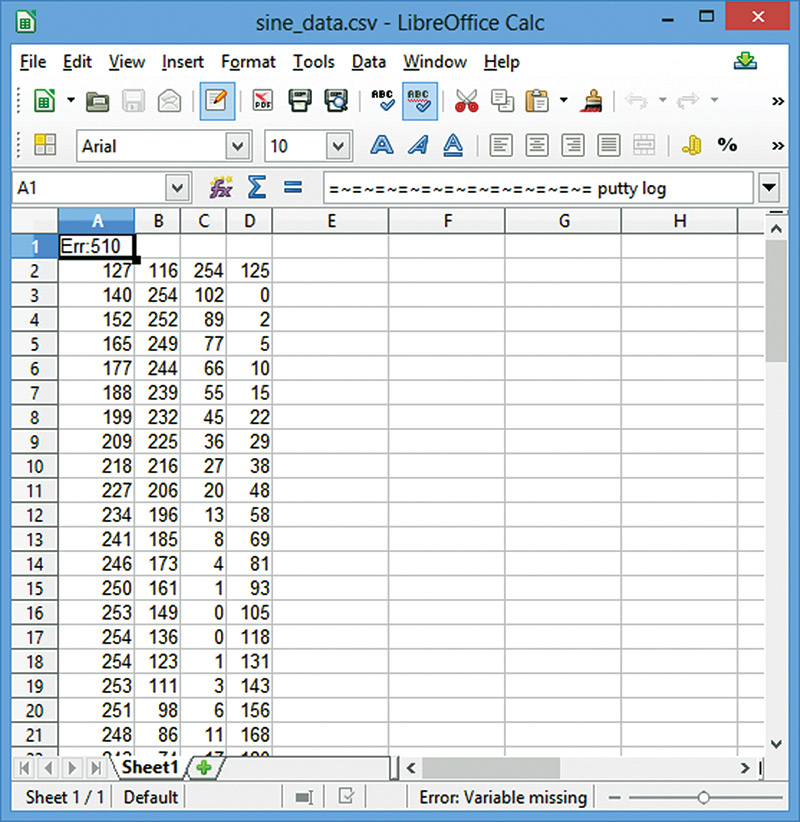
FIGURE 11. Sine wave data in LibreOffice Calc.
You’ll note that row 1 has some junk data that PuTTY put in as the first line to indicate when the data was logged — just delete that entire row. Next, open the Insert menu and click on the Chart item. The Chart wizard will open and you can select the ‘Line’ chart type: ‘lines only.’ This will give you the chart shown in Figure 12.
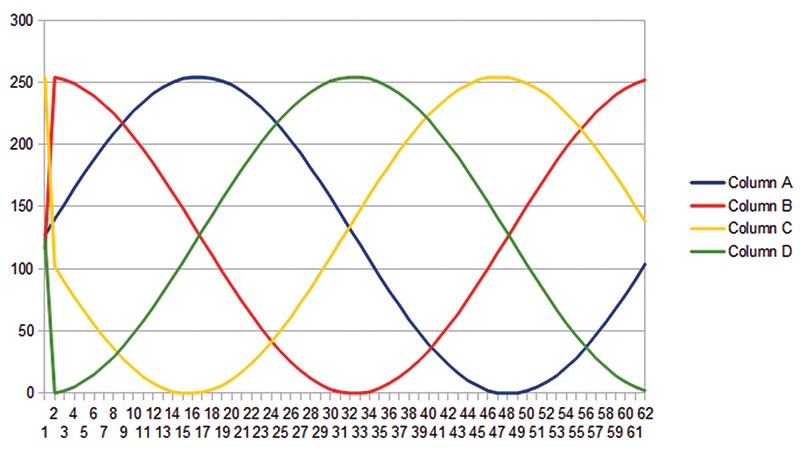
FIGURE 12. Sine waves in LibreOffice Calc chart.
Wow! Would you look at that! Was that easy or what? We have suddenly become kings of data logging and charting. Now, let’s use what we’ve learned to chart some real data from the AHP fresh air controller.
Logging Data to an SD Card
SD cards can hold some serious data. And when I say serious, I mean SERIOUS. In our last installment, we learned to collect data using only the resources available on a raw Arduino. We saw how to use some tricks to collect a whopping 3,000 or so samples of data. We figured that was enough to keep track of the fresh air controller for about three days before needing to upload data to the PC.
If you use an SD card, you can collect gigabytes of data. GIGABYTES — like as in billions and billions and billions as Carl Sagan would say as he gazed his boggled eyes at the stars. I ran a quick and probably inaccurate comparison of using the raw Arduino versus a 2 GB SD card and figure I could save fresh air controller data for about 80,000 years. (That is just crazy.)
So, why on earth did we go to all that trouble squeezing a measly 3,000-ish samples into the raw Arduino when we can get so much space on a $5 SD card? Well, part of the reason is cost. Saving the data on the raw Arduino doesn’t add any extra expenses, while adding an SD card to an Arduino can cost about $20 when you include both the card and the required circuitry.
So, only you can decide if your needs warrant that extra expense. To me, it’s almost a no-brainer. If you are seriously into data logging, you need the SD card. [Oh, and the other reason for squeezing the data into a raw Arduino is that it was a good learning exercise. Admit it, you did learn some stuff.]
An Arduino Data Logger Shield
I had an old AdaFruit Arduino data logger shield laying around (refer back to Figure 1), so that’s what I used with the AHP to develop and test the final software. AdaFruit discontinued that shield in favor of one that comes pre-made with surface-mount parts. That will do just fine, though you do miss the opportunity to inhale some solder fumes.
As you can see from the photo, I soldered the DHT22 sensors to the prototyping area with the sensors going to pins 8 and 9. Note this change from our last Workshop. I had used pins 10 and 11, but that conflicts with the signals needed for the SD card. So, I moved them.
Using an SD Card With the Arduino
Using the SD card is dead-nuts easy with the Arduino SD library. Just keep in mind that they use 3.3V for both the power and logic interface. They can use about 100 mA at times, and they can be fairly finicky about the logic signals.
Since the Arduino (in general) is 5V, you must have special voltage level-shifter circuits to translate between the two. You could roll your own connections, but there are many shields available with all the current and protection built in. For this article, I used an older data logger shield from AdaFruit.
My shield required that I solder all the through-hole parts on it, but the newer version comes ready to use. The shield has a real time clock built in, so we can get our datetime readings from it as we log our sensor data.
Like many things Arduino, we are blessed to have a library that does what we want to do with an SD card, and we are doubly blessed because the Arduino IDE (Integrated Development Environment) has several very useful examples for using the SD card.
Open the Arduino IDE and then click on the File menu button, then on Examples\SD\. You’ll see the six example files listed in Figure 13: Cardinfo, DataLogger, DumpFile, Files, listfiles, ReadWrite.
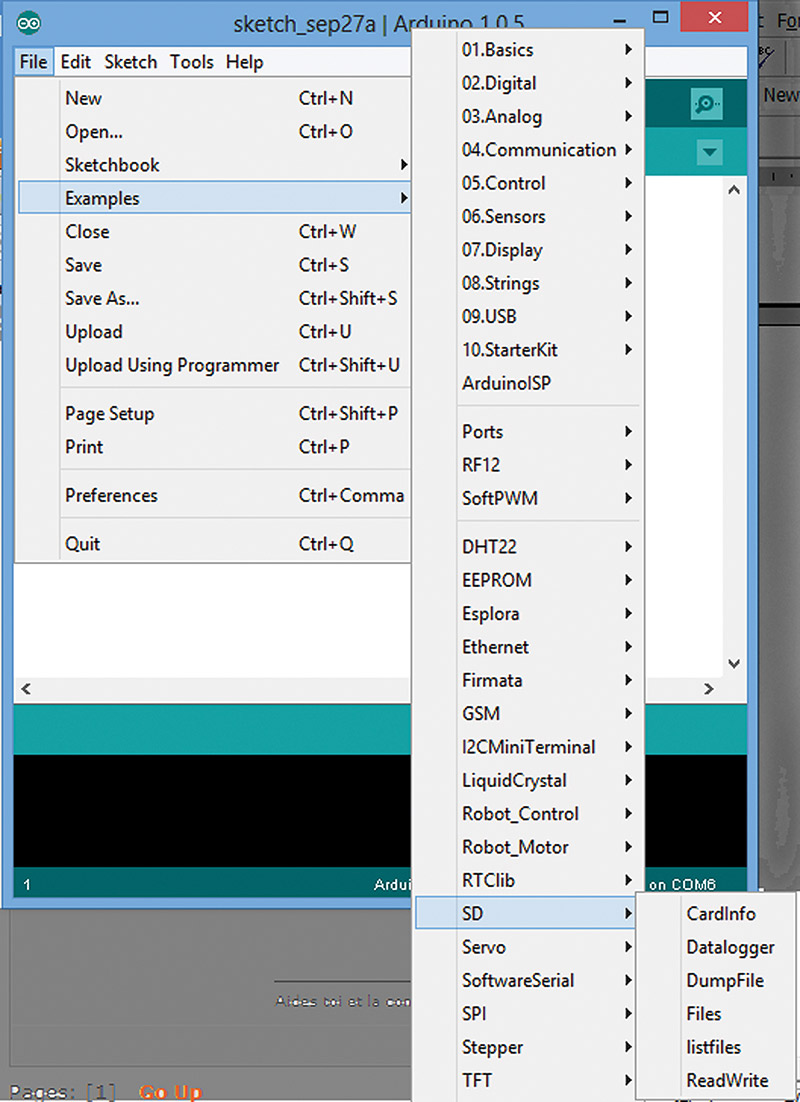
FIGURE 13. Arduino SD card examples.
These examples will provide the basis for us to build the SD card part of our data logger. You’ll want to use the Cardinfo example to make sure your SD card setup is working properly. When I first ran the program, I got the information in the Serial Monitor shown in Figure 14.
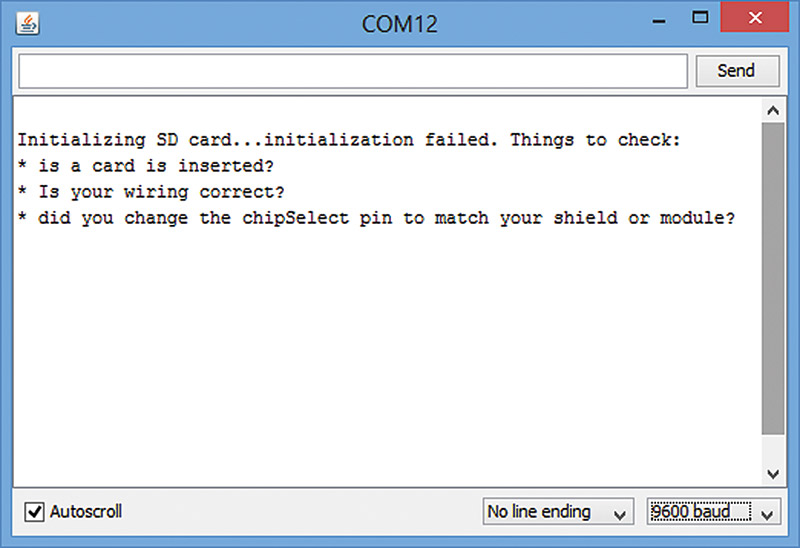
FIGURE 14. SD Example wrong chipSelect.
So, I went back and actually looked at the code and saw that the example defaults to the Ethernet shield. If you want to use it with the AdaFruit SD shield, you need to change chipSelect from 4 to 10 as follows:
//change this to match your SD shield or module;<br />
//Arduino Ethernet shield: pin 4<br />
//Adafruit SD shields and modules: pin 10<br />
//Sparkfun SD shield: pin 8<br />
const int chipSelect = 10;
Figure 15 shows the information with the correct chipSelect set for a 2 GB card.
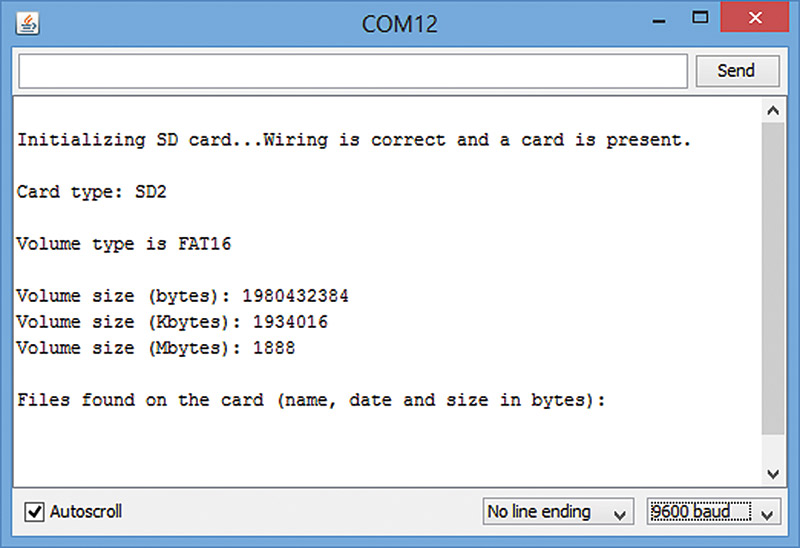
FIGURE 15. SD example right chipSelect.
Saving Temperature and Humidity Data in CSV Format
First, we need to decide how we’ll save the data so that we can chart it. We will want to have each of the four fresh air controller sensor samples — inTemp, inHum, outTemp, and outHum — associated with a datetime for each sample interval.
In the last article, we saw that we only need to record the datetime at the beginning of the sampling session, then we can extrapolate the datetime for each sample by simply adding the sampling interval. We could still do that, but since we have 2 GB of data to play with, why bother? Let’s just get lazy and record the datetime for each sample.
To further simplify things, let’s do a test run where we only sample the two DHT22 sensors so that we can show that data and leave the ‘Control’ part of the fresh air controller software for the moment. We will write a simple program (sd_sensor_test) that samples the sensors once per five seconds, then saves that data to the SD card. I’ll do this sampling next to my laptop, with one sensor hanging out in the room and the other stuck right up next to my laptop’s exhaust fan (again, refer to Figure 1). Both sensors start at the same temperature and humidity, but the one next to the exhaust sees a rapid increase in temperature and decrease in relative humidity.
We will then upload this data to the PC and chart it as we did with the sine wave data. Figure 16 shows the results.
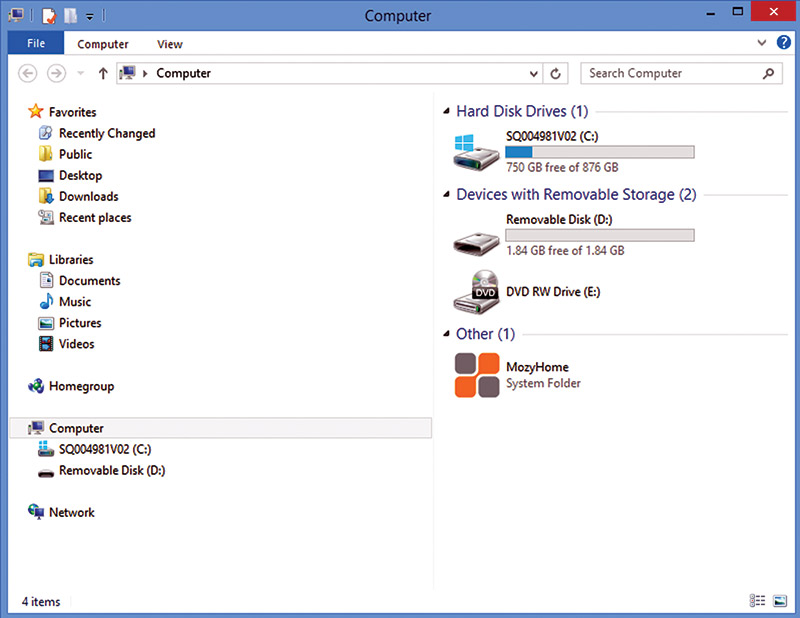
FIGURE 16. Removable disk D:.
Since I’m running a bit long on this article, I’ll make the source code (sd_sensor_test.ino) available in the downloads. This program loads the data onto the SD card and it also sends it out to the PC at each sample interval. This gives you two ways to get the data.
You could get the data using PuTTY as discussed, or you could wait until you’ve finished sampling and then remove the SD card from the AHP, plug it into the PC, and get the data off the card [we name this file datalog.csv in the Arduino source code, and the Arduino creates this file on the SD card]. When you plug the SD card into your PC, it opens the SD card as a ‘Device with removable storage’ in Windows Explorer. You can access the file just like any other file in a Windows directory as shown in Figures 16 and 17.
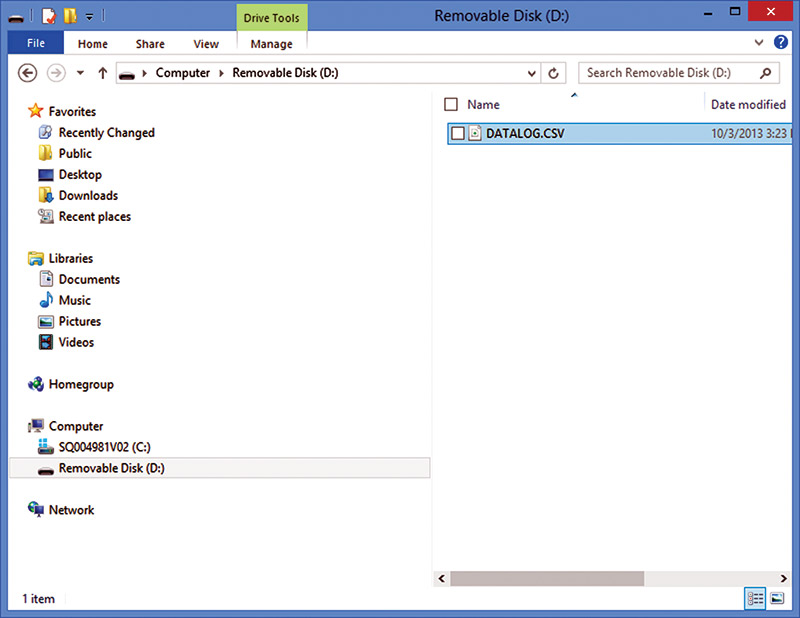
FIGURE 17. DATALOG.CSV.
In LibreOffice Calc, I set the chart to only show the data, not the datetime since I already know that the data is taken at five second intervals. The datetime data is in unixtime which (as we’ve seen) is the number of seconds since January 1, 1970, and we can take that data and display it anyway we want. This isn’t relevant at the moment, so I left it out.
Use the LibreOffice Calc File menu to browse to the datalog.csv file, then open it and display the data as you were shown earlier with the sine data as shown in Figure 18.
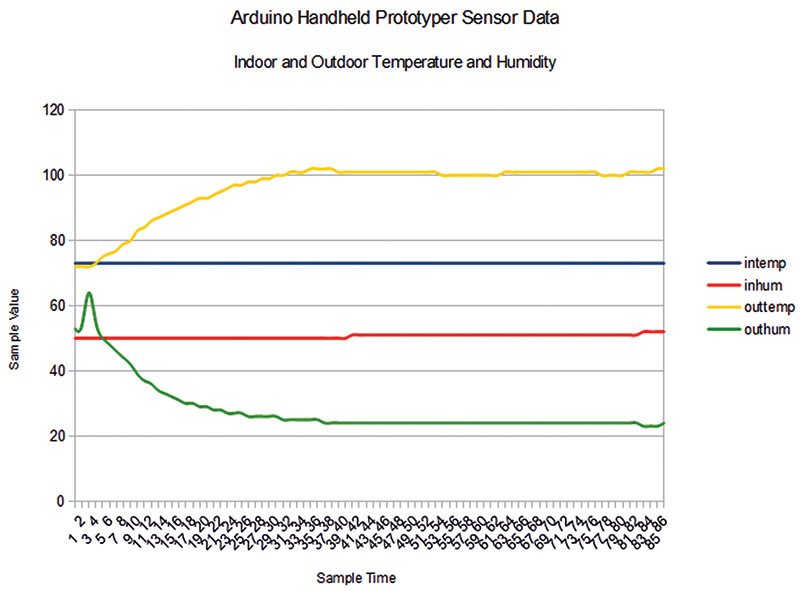
FIGURE 18. Sensor data in LibreOffice Calc.
Now What?
This is the last of my six part series on the Arduino handheld prototyper. In these articles, we’ve learned a lot about using the Arduino proto shield and the I2C mini terminal combined into the AHP. Now, you can create your own Arduino designs that can be used remotely to talk to someone using a small LCD and five-button navigation system.
You can keep track of the dates and times, and you can store a small amount of data on the Arduino or a large amount of data on an SD card.
Now, go forth and create. NV
Downloads
201312_SmileysWorkshop65.zip
What’s in the zip?
Source code