In this DIY Biotech article, we’ll build an Arduino-based spectrophotometer to explore how the optical density of bacteria suspended in a liquid can be used to measure the rate and stage of bacteria growth.
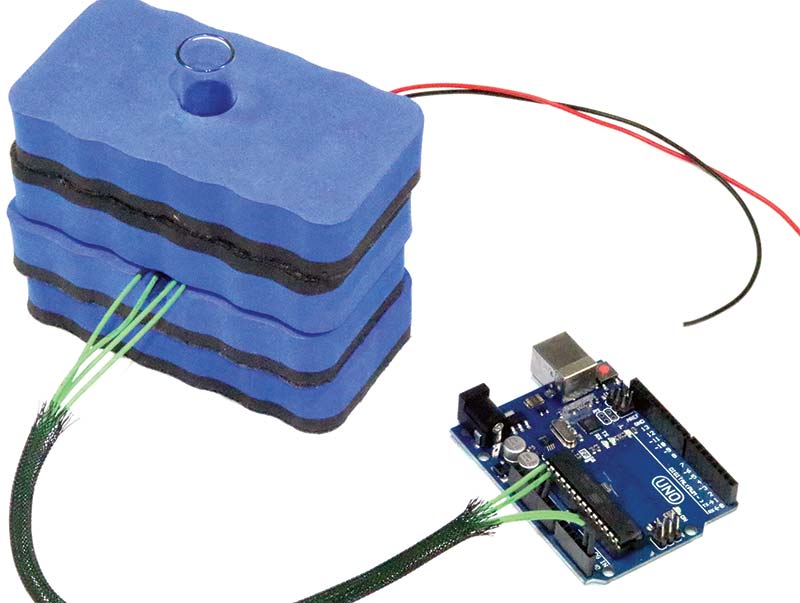
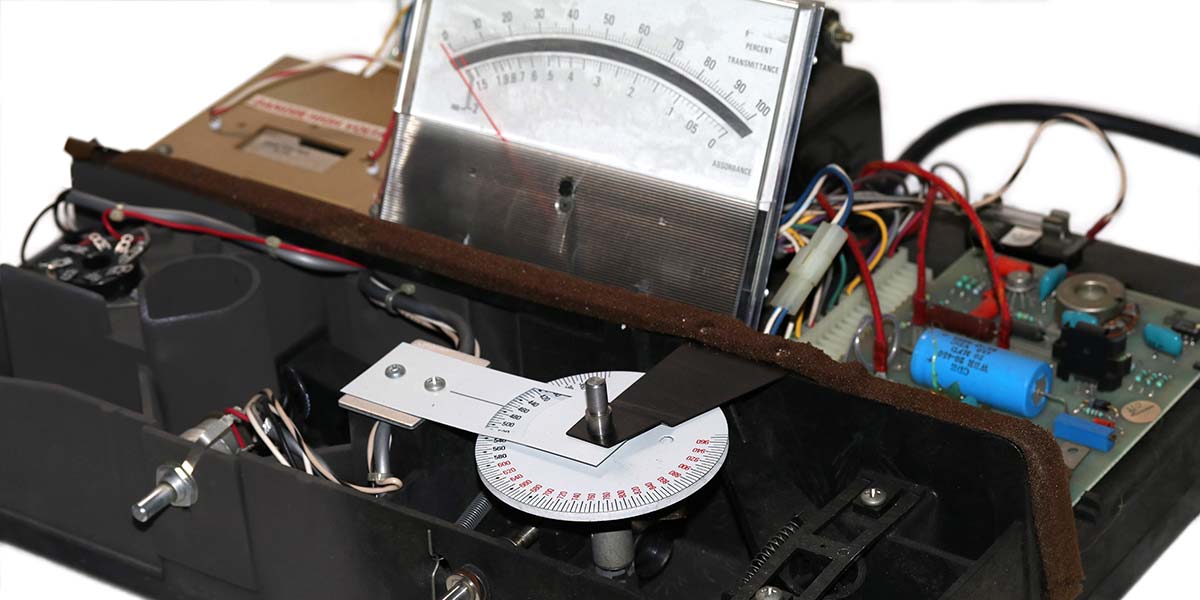
PHOTO 1. DIY spectrophotometer.
INTRODUCTION
The cultivation of bacteria such as E Coli is a significant part of DIY Biotech. Bacterial DNA can be modified, for example, to produce insulin and other lifesaving drugs, and to display certain characteristics such as glowing in the dark. Modifying the bacterial DNA usually requires working with organisms that are rapidly dividing because this is when cell wall integrity is compromised.
If you know how to identify this stage of rapid bacterial growth, then you’ll have better success in your DNA manipulation experiments. Similarly, some experiments require a minimum concentration of bacteria in order to produce meaningful results.
Enter the spectrophotometer, which measures wavelength-specific optical opacity of a fluid. By shining a light of a particular wavelength — most commonly 600 nm or orange — through a suspension of bacteria in a nutrient broth and measuring the absorbance of that light at regular intervals, the concentration (and therefore number) of bacteria as well as their rate and stage of growth can be measured. The following section introduces the science behind the spectrophotometer.
THE SCIENCE
Key STEM Concepts
The change in optical density at 600 nm (OD600) for a growing bacterial suspension follows a characteristic curve.
- The four phases of bacterial growth, in order, are the: 1) lag phase; 2) logarithmic or log phase; 3) stationary phase; and 4) decline phase.
- The Beer-Lambert law essentially states that absorbance of light by a fluid is a function of: 1) the concentration of the absorptive substance(s) in the fluid; and 2) the length of the path the light must make through the fluid.
- The relative change in the turbidity or optical density at 600 nm of a suspension of bacteria can be used to determine the relative rate and stage of bacterial growth.
- Given a known optical path length, the absolute optical density at 600 nm of a suspension of bacteria can be used to measure the concentration and number of bacteria in a suspension.
Bacterial Growth
Figure 1 shows the typical bacterial population growth curve. Note that the X axis is time and the Y axis is the logarithm of the concentration of bacteria in the container.
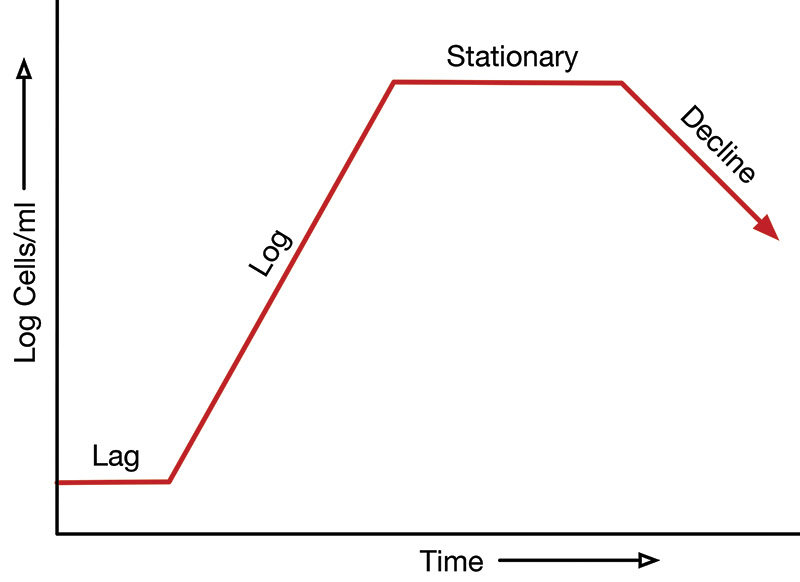
FIGURE 1. Typical bacterial population growth curve.
When viable bacteria are suspended in a nutrient bath, there is a lag time wherein the bacteria grow in size but not in number. This is followed by a period of rapid logarithmic growth in the number of bacteria, referred to as the log phase. Each parent bacterium divides into two identical daughter bacterium (through a process called binary fission), each of which grow and divide into two additional daughter bacterium, and so on.
This log phase of rapid growth in the number of bacterium eventually comes to a halt when the nutrients in the bath have been exhausted. This stationary phase is marked by a constant population of bacteria. Eventually, bacteria begin dying and the number of bacteria falls.
As shown in Figure 1, the number of bacterium in this decline phase approaches but may not fall to the level of the initial lag level because of survival mechanisms.
Given a set of conditions in terms of nutrients, temperature, oxygen, and carbon dioxide in the atmosphere, the log phase of a particular population of bacteria might last from, say, six hours to 12 hours after the bacteria are introduced to a nutrient bath. However, a rough estimate may not be good enough for a specific study or genetic manipulation procedure. For example, if six hours after introducing bacteria to a nutrient bath the bacteria population used for a DNA experiment is still in the lag phase, the experiment will likely fail.
Figure 2 shows another use for determining bacterial population growth curves: that of identifying optimal environmental conditions including temperature, nutrient concentration, and oxygen/carbon dioxide concentration for maximum growth rate. Conditions associated with growth curve Log A are superior to those associated with curve Log B which, in turn, are superior to those associated with curve Log C. A greater slope corresponds to a greater rate of growth.
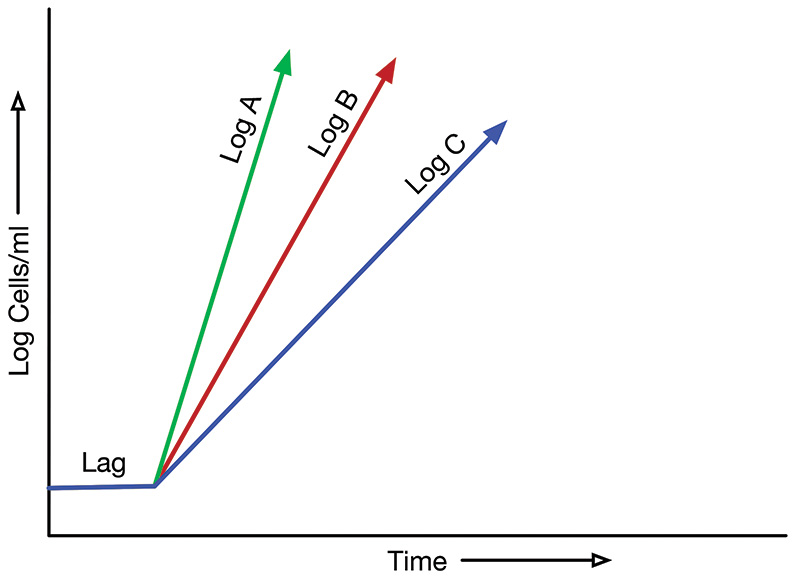
FIGURE 2. Different log phase growth curves resulting from different environmental conditions.
Many of the strains of E Coli available for DIY Biotech are designed for maximum growth at the normal core body temperature of 37°C. However, I’ve used E Coli to manufacture the glow-in-the-dark compounds found in jellyfish, and these bacteria exhibit the maximum rate of growth at cooler temperatures.
Similarly, E Coli are aerobic bacteria that thrive in an oxygen-rich environment. Increasing the ambient oxygen level could be expected to shift the log phase from, for example, Log B to Log A in Figure 2.
Light Absorbance/Transmittance
It should be obvious that a beam of light traveling through a fluid will undergo some degree of attenuation, as a function of the interaction of light with the fluid and any particles (e.g., bacteria) suspended in the fluid. All else held equal, the more particulate matter suspended in the fluid and the more the particulate matter interacts with the light, the greater the attenuation.
Similarly, the light traversing a one inch diameter tube of fluid should be attenuated less than a beam traversing, say, three feet of the same fluid. It also stands to reason that pure water with no particulate matter should provide the least optical attenuation.
This common-sense view of light absorption by a fluid is quantified in the Beer-Lambert Law. The mathematics isn’t important for our discussion, but the law essentially states that absorbance of light by a fluid is a function of:
- The concentration of the absorptive particle(s) in the fluid.
- The length of the path the light must make through the fluid. In our case, the absorptive particles are bacteria and the beam must travel the diameter of a test tube — about 1”.
An added twist is that bacteria exhibit a peak in light absorption around 600 nm (or orange). That is, if you were to sweep the spectrum of colors through a sample of E Coli or other common bacteria, you would find a peak in absorbance (or a dip in transmission) at 600 nm. This is in contrast with, for example, the chlorophyll found in green plants, which has a peak absorbance around 400 nm or violet.
We can take advantage of this peak in bacteria absorbance at 600 nm by using a light source of the same wavelength. This increases the signal/noise ratio of our measurements compared to using, say, white light, because absorbance due to other particles suspended in the fluid have relatively little effect on absorbance at 600 nm. By the way, OD600 measurements not only apply to bacteria, but they are commonly used to quantify the concentration of yeast in a suspension (think beer brewing) and to establish a growth curve of a yeast culture.
PHOTOSPECTROMETER DESIGN
Commercial Standard
If you search for “photospectrometer” on eBay, you’ll likely see dozens of listings for the Bausch & Lomb Spectronic 20. It’s the most popular photospectrometer ever sold. Photo 2 shows my eBay purchase ($150), complete with minor smudges accumulated over 40+ years of use.
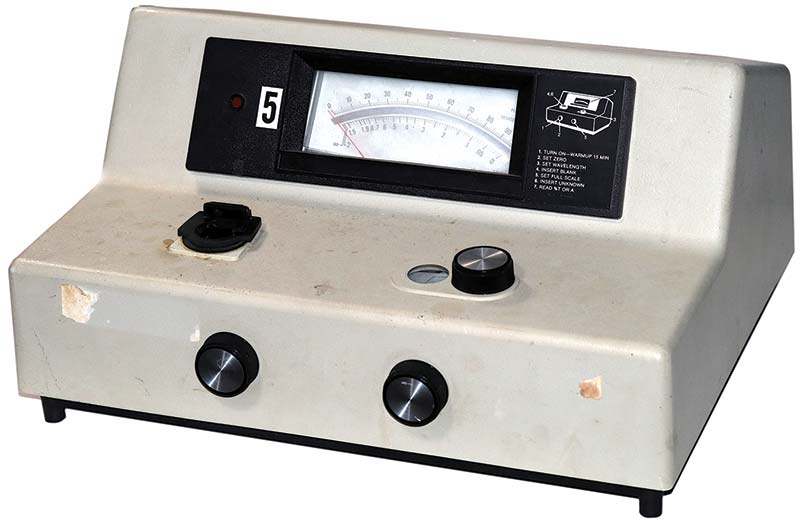
PHOTO 2. The ubiquitous Bausch & Lomb Spectronic 20 spectrophotometer, produced from the mid ’50s through the mid ’80s.
The left knob on the front panel is for power and to zero the 5-1/2” absorbance/percent transmittance meter. The right control on the front panel is to set the analog meter to 100%. On the top of the unit are the sample holder on the left, and the wavelength selector on the right.
Photo 3 shows the photospectrometer with the cover removed. The wavelength selector disc marked from 340 nm-960 nm is in the bottom center of the photo. The underside of the tube socket for the photomultiplier tube can be seen on the far left. Under the wavelength selector disc are the Tungsten lamp, an objective lens, and a diffraction grating.
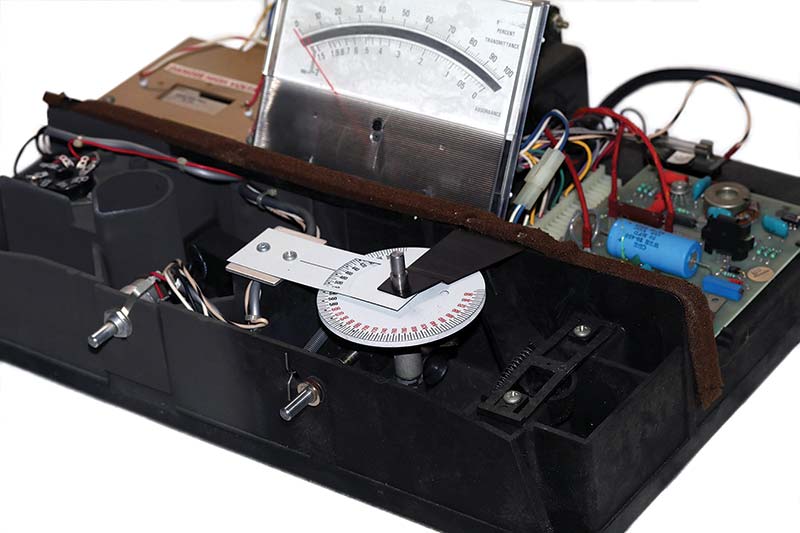
PHOTO 3. Internal view of my Spectronic 20 spectrophotometer.
Rotating the diffraction grating relative to the yellow-white Tungsten light source produces a light from 340 nm-960 nm with a spectral bandpass of 20 nm. This colored light is directed through the test tube containing the bacteria in suspension and to a photomultiplier tube. The circuitry to the right of the meter amplifies the signal to drive the meter.
There are, of course, clones of the Spectronic 20 manufactured in China. The better domestic units are a little more compact and feature a digital display. Expect to pay several hundred dollars for a fully functional refurbished unit. Much of the cost and complexity is related to support for a range of wavelengths, from near IR to near UV. For most of my work — and I suspect for most DIY Biotech experimenters — OD600 measurements are sufficient; 600 nm or orange light can be obtained from a simple LED circuit.
LED Light Source
Instead of starting out with a white light source such as a halogen or Tungsten bulb and then using a filter or diffraction grating to select for 600 nm, it’s much simpler to use a 600 nm LED. High-intensity 600 nm LEDs — which are usually made with aluminum indium gallium phosphide (AIndGaP) — are affordable, readily available, and easy to use. Photo 4 shows several 1W LEDs and a sheet of heatsinks, as well as an LED mounted on a heatsink with thermal adhesive.
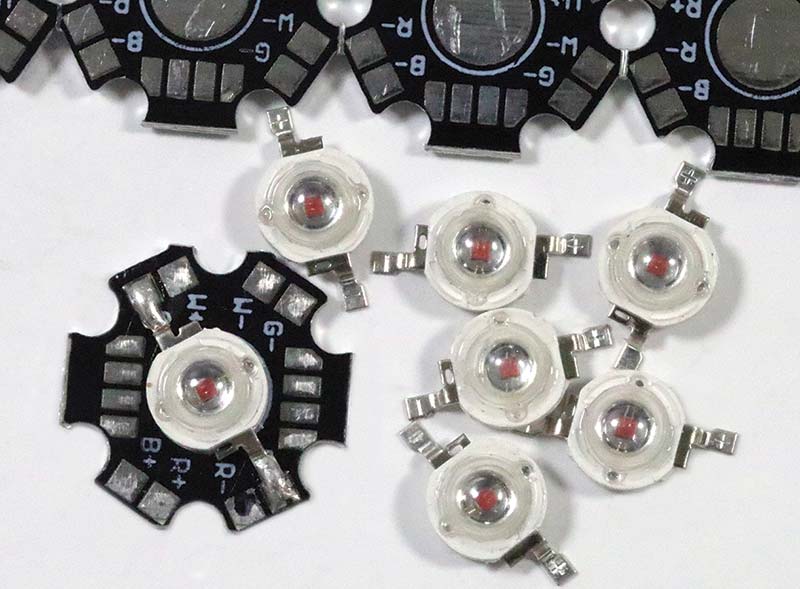
PHOTO 4. Note the 600 nm 1W LEDs and heatsinks.
An LED heatsink isn’t strictly required for this application because it’s possible to strobe the LED for a second to take a reading. That said, I like a margin of safety and the heatsink pads make wiring simple. Furthermore, the solder pads on the heatsinks make the LED units easier to handle.
I sourced the components for this project through Amazon, at a modest premium over what’s available on eBay and specialty sites such as Adafruit.com. A bag of 10 Chanzon 1W 600 nm LEDs is available for $5.70. Similarly, a bag of 25 Chanzon LED heatsinks is available for $7. I used Arctic Silver Arctic Alumina Thermal Cooling adhesive, available from Amazon for $22/5 gm. There are less expensive sources for the LED and heatsinks, but shipping costs add up quickly when you deal with multiple vendors.
Power Supply
The Chanzon LEDs used in this project require 300-350 mA at 2.0-2.4V. This is easy enough to supply from a constant current bench supply. However, if you want a self-contained spectrophotometer, there are several options, such as a Chanzon constant current 300 mA LED driver, also available from Amazon for $7. The only downside of this driver is that it runs on 110V AC, and I like to work with lower voltage DC supplies.
Photodetector
With a little tweaking, any number of photodetectors and photodetector circuits can be used to create a 600 nm photospectrometer. For example, one of my early prototypes is based on the TEMT6000 phototransistor and voltage divider breakout board (available from Amazon for $7). Hookup and the related Arduino code for this analog light sensor is about as simple as it gets.
I found the TEMP6000 limited in dynamic range, however. I sometimes had trouble differentiating the control (no bacteria) from the sample containing bacteria.
My current photospectrometer is based on a powerful and flexible photodetector: the Adafruit TSL2591. This high dynamic range digital lux sensor which has separate sensors for visible and infrared light and user-definable gain from unity to 428X, is available for $10 from Amazon (see Photo 5). Recall that lux is a measure of light intensity and that 1 lux equals 1 lumen/m2.
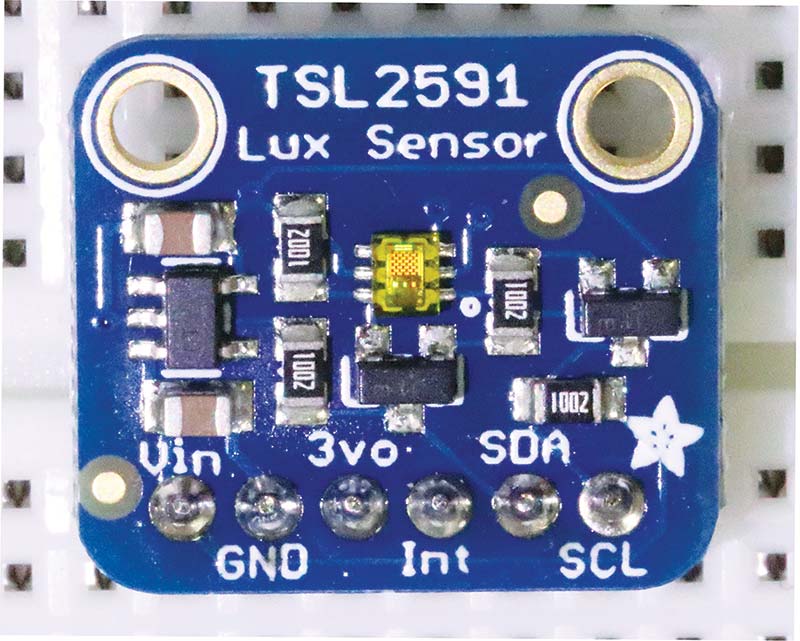
PHOTO 5. The Adafruit TSL2591.
Exhaustive documentation and example Arduino code and associated libraries are available for free download from Adafruit. As you’ll see later, the example code is all you need to create a fully functional photospectrometer.
Microcontroller
Given the libraries and example code available on the Adafruit website, it’s only reasonable to use the Arduino Uno to control the TSL2591 photodetector. The TSL2591 is an I2C device with a non-alterable address of 0x29. Even if you’ve never utilized an I2C device before, you’ll find the TSL2591 a joy to work with. The Adafruit library takes care of all the low-level details.
THE BUILD
Detector
I chose to use a simple direct wired design to minimize build time. There are only four 6” jumper wires between the female sockets on the Arduino Uno and the male pins on the TSL2591 as shown in Photo 6.
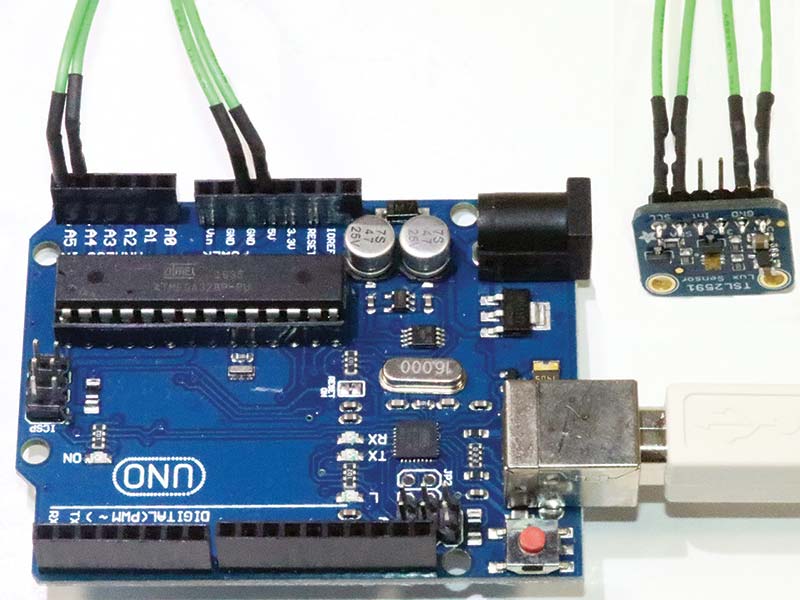
PHOTO 6. The TSL2591 Arduino connections.
It’s possible to use a traditional breadboard circuit in the form of a miniature breadboard, so that the TSL2591 can be mounted vertically. The sensor and light source should be perpendicular to the long axis of the cuvette or test tube containing the suspension of bacteria. Table 1 shows the connections between the TSL2591 and the Uno. Using only four male-female jumper cables, build time for the detector is on the order of five minutes.
| Arduino |
TSL2591 |
| 5V |
Vin |
| GND |
GND |
| A5 |
SCL |
| A4 |
SDA |
| USB Port |
Mac/PC USB |
TABLE 1. Arduino Uno Connections.
Light Source
The 600 nm light source is a 1W LED connected to my bench supply in constant current mode. The build involves soldering 12 inch lengths of 22 gauge copper wire leads to the LED as shown in Photo 7. Alternatives to a bench supply include the Chanzon LED driver discussed earlier, or any number of LED drivers available online. For example, Adafruit sells a variety of LED drivers compatible with high power LEDs starting at about $7.50.
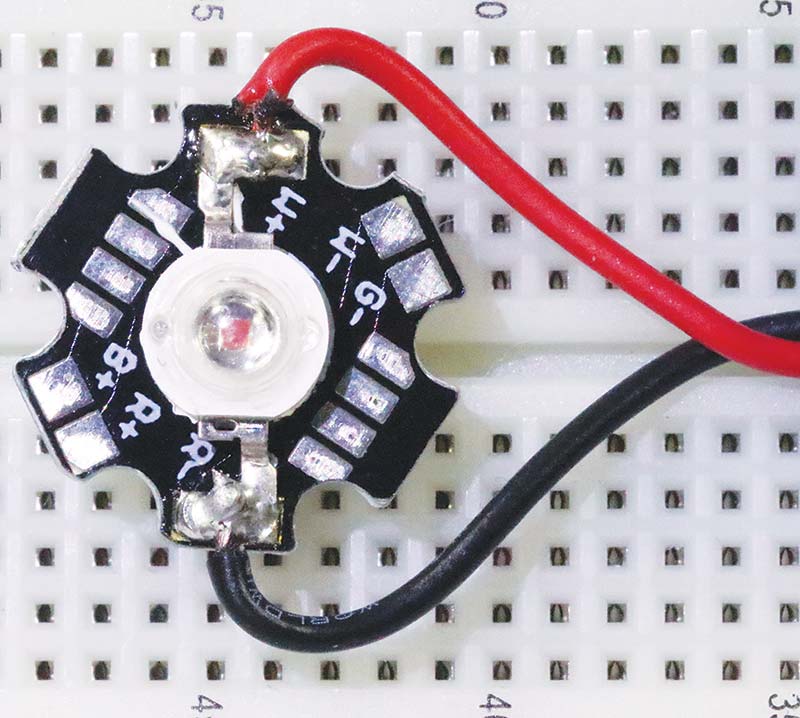
PHOTO 7. A 1W 600 nm LED wired and ready to go.
Test Tube/Cuvette Holder
Creating a light-tight holder for a square cuvette or regular round test tube is the most labor-intensive component of this build — unless you have access to a 3D printer. Although I do own a printer, most readers don’t, so I looked for a commonly-available alternative.
Another five-minute solution (shown back in Photo 1 and Photo 8), is to stack ordinary and inexpensive white board erasers in a way that blocks extraneous light and supports the LED and receiver circuits.
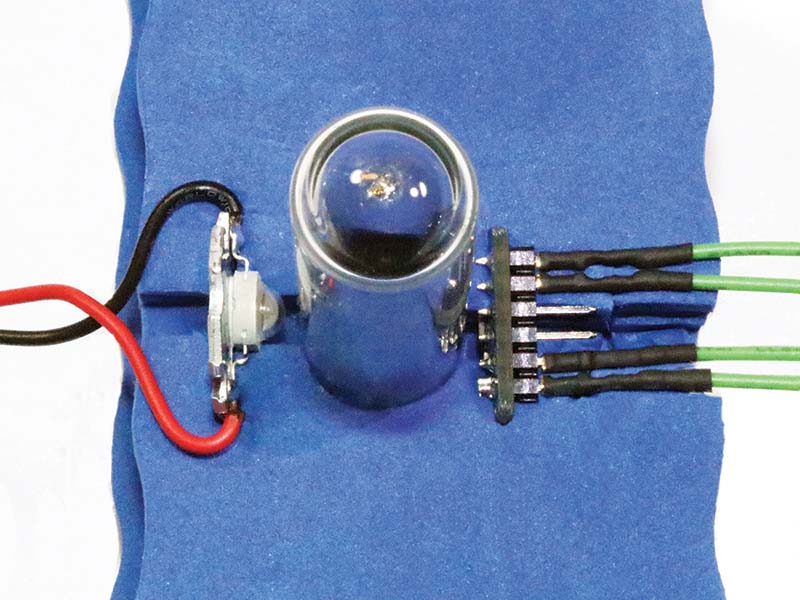
PHOTO 8. LED, sensor, and test tube (center) embedded in a foam whiteboard eraser.
Use a hobby knife to cut out a round or square hole in each of four foam erasers, depending on whether you’re using cylindrical glass test tubes or cuvettes. After inserting the light source and detector in the slots on either side of the hole for the test tube (refer to Photo 8), the four erasers are stacked onto each other and either glued together or held in place with tape. Note that the tube in Photo 8 serves to hold the stack of erasers in place during construction.
Obvious variations on the build include a stand-alone instrument that includes an LCD display, battery supply, aluminum or plastic project box, and 3D printed cuvette or test tube holder.
There’s nothing special about the use of erasers. A pair of 4” 2x4 pieces could be used in place of the foam. The downside of a plastic, aluminum, or wood framework for this project is the need to work with a drill press or at least a hand drill to make the necessary modifications.
SOURCE CODE
The source code for this project is a slight modification of the sample code that’s available from the Adafruit site. (The entire source code is only six lines, shown here.) The most difficult step is installing the Adafruit_TSL2591 library as well as the Adafruit_Sensor library from the Adafruit repository. Go to https://github.com/adafruit/Adafruit_TSL2591_Library.
From the Examples menu, select Adafruit_TSL2591 and run the code. When you open the serial monitor window, you should see the instantaneous lux value scroll down the window, tagged with the time. All you have to do with the example code is decide on the gain and integration time by uncommenting the appropriate timing and gain declarations. For example, the statement:
tsl.setGain(TSL2591_GAIN_MED);
sets the gain to medium, or about 25x. Low gain has a gain of 1x, and high gain has a value of 428x. Similarly, the statement:
tsl.setTiming(TSL2591_INTEGRATIONTIME_100MS)
sets the integration time to 100 ms. This is appropriate for bacterial suspensions that are almost clear. Increasing the integration time to, say 600 ms, is appropriate for highly turbid suspensions (i.e., low-light conditions). The only other parameter to consider is what to measure: infrared, visible light, or a combination of the two. Because 600 nm is clearly in the visible spectrum, we can ignore the infrared sensor. The main loop in the program becomes:
void simpleRead(void)
{
uint16_t x = tsl.getLuminosity(TSL2591_VISIBLE);
Serial.print(F(“Luminosity: “));
Serial.println(x, DEC);
}
That’s it, thanks to the fantastic example program! The program will run continuously and return the real time values of luminosity every 500 ms or so. Of course, for our needs, one measure per sample will do.
Note that the luminosity value obtained from measuring a test tube of pure broth must be subtracted from the value obtained from measuring a test tube of the same size and composition that contain the bacteria suspensions. In this way, the test tube, broth, and other sources of common error do not contribute to the growth curve or other analysis.
DEMONSTRATION
To demonstrate the capabilities of your OD600 photospectrometer, let’s create a growth curve for E Coli. First, create a liter of standard Luria Bertani (LB) broth. This involves dissolving 25.0 grams of LB powder (see Photo 9) into 1,000 ml of distilled water, and then heating the broth to 121°C for 15 minutes to kill any bacteria.
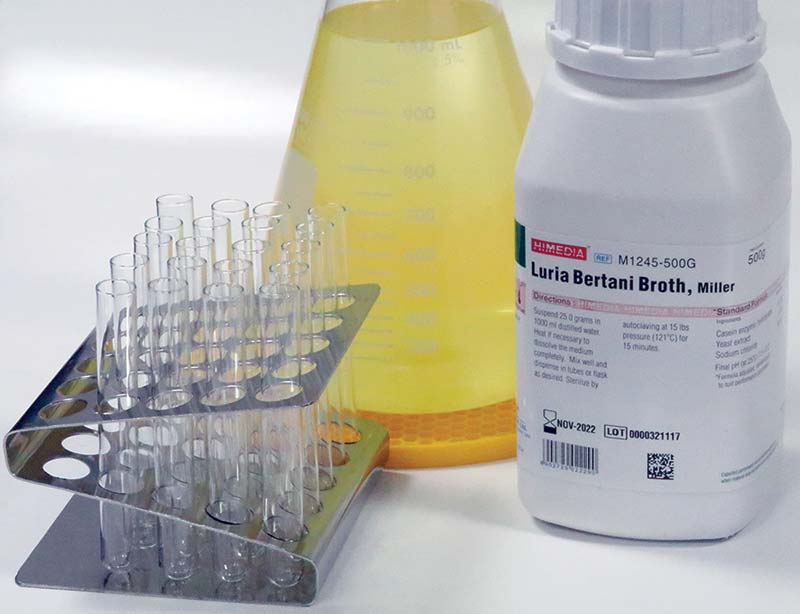
PHOTO 9. Luria Bertani (LB) powder, a set of glass test tubes, and a liter Erlenmeyer flask filled with LB broth.
Next, cool the broth to 37°C and inoculate the broth with E Coli. Before placing the flask in an incubator set to 37°C, stir the suspension so that the E Coli are evenly distributed in the broth and take a few cc’s and place it in a clean test tube. Insert the tube into the photospectrometer and watch the lux values scroll up the screen. Continue taking samples every hour and recording the lux value. Make certain you use clean — not necessarily sterile — test tubes and that you stir the suspension before taking a sample for measurement. A plot of the measurements should resemble the classic bacteria growth chart described earlier.
Once you’ve obtained a growth chart, make another batch of broth and vary the incubation temperature; say, setting your incubator to 35°C instead of 37°C, and repeating the measurement sequence. You should see a change in the slope of the log phase — the magnitude and direction of the change dependent on the strain of E Coli.
DISCUSSION
An inexpensive DIY photospectrometer dedicated to OD600 measurements is both easy to build and useful in the DIY Biotech lab. A quick Internet search on OD600 will reveal tables that you can use to calibrate your photospectrometer to the absolute concentration of bacteria per ml.
If you’re interested in exploring photospectrometers in more depth, then consider constructing a unit using an RGB LED. You won’t need to modify the receiver hardware or software, but you may want to leverage the power of the Uno to accurately control the mix of red, green, and blue output.
Of course, if you’re new to DIY Biotech and have never heard of Luria Bertani broth, then consider an intro text to Biotech, such as the Illustrated Guide to Home Biology Experiments, by Thompson and Thompson. Another resource is the Carolina Supply website (https://www.carolina.com), which has an extensive library of online tutorials.
If you’re affiliated with a school, then you should consider Carolina Supply for E Coli, LB Broth, and other supplies. If you’re an independent DIY Biotech experimenter, then Carolina — among other suppliers — will not sell you active biologicals. Instead, consider Amino.bio and The-Odin.com. NV