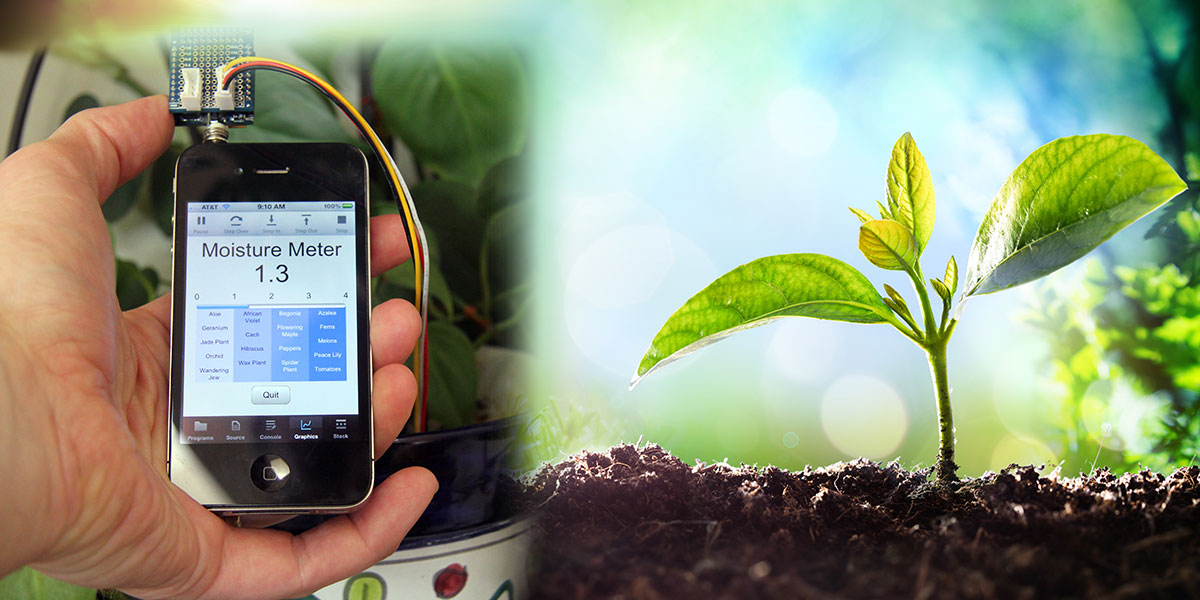
I was always a little jealous when Spock pulled out his tricorder on Star Trek and began measuring practically every physical value you could imagine. It’s staggering how far technology has come, though. I carry a tricorder around in my pocket all the time now! Mine measures acceleration, rotation, and magnetic fields, giving both the strength and direction of each. It’s not quite as sophisticated as Spock’s, but it’s also not so large and clunky. In this article, we’ll look at a way to convert an iPhone or iPad into a quadcorder, hanging a HiJack AD converter off of the end, then using techBASIC™ to read it. As a sample project, we’re going to build a moisture meter from off-the-shelf parts.
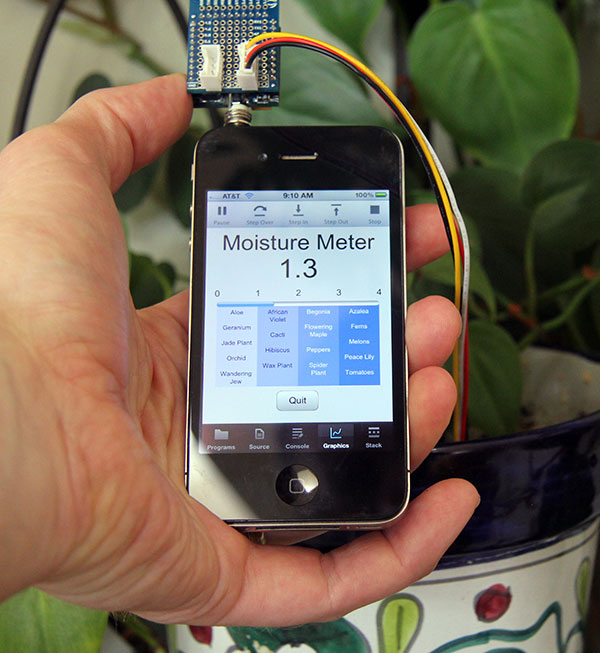
FIGURE 1. Our moisture sensor.
Most people who read a magazine like Nuts & Volts know a fair amount about electrical engineering, mechanical engineering, and programming, but few of us are really expert at all of them. That’s what I find so enticing about the combination we’ll work with here to build our moisture sensor. All of the components — even the software — are off-the-shelf. That lets us concentrate on the part of the project we’re best at or — for those of us perverse enough to think this way — the part we’re worst at, so we can improve. The whole project can be tossed together in a matter of minutes. Later, we’ll deal with my area of expertise, and develop a much cooler implementation of the software so our quadcorder’s moisture meter is easier to use.
Parts List
The first component is an iPhone or iPad. Depending on the model, this can give us an accelerometer, magnetometer, and gyroscope.
Next, we add the HiJack AD converter. This little device is just one inch square and 3/8 inches thick. It plugs into the headphone jack, drawing power from the audio output to provide 7.4 mW without the need of an external power supply. It reads a voltage drop, translating zero volts to a value of zero, and 2.75 volts to a value of 255, with a linear response between those values. A clever electrical engineer can connect pretty much any sensor to the iPhone using HiJack.
I bought the HiJack development kit which comes with the HiJack module, two prototype boards, a USB connector for updating firmware, and several wiring harnesses.
I used a Grove moisture sensor which attaches directly to the HiJack harness. Be sure and check out the other Grove components on the Seeed Studio site, though. You may be surprised at the number of components that are available, and most plug directly into HiJack.
The last component is software to tie it all together. techBASIC is an implementation of Basic for the iPad and iPhone that is designed for collecting, analyzing, and displaying information. It comes with sample programs to read and display information from the accelerometer, gyroscope, and magnetometer, giving you your basic tricorder. The Byte Works’ website (www.byteworks.us) has an introduction to HiJack; at the end is the source code for a program that will read the HiJack sensor and display the results more or less like an oscilloscope.
Assembling the Moisture Sensor
Figure 2 shows exploded and assembled views of the hardware. All of the parts except the moisture sensor come with the HiJack development kit. It really is as simple as it looks — just plug the components together as shown, then insert the headphone jack into an iPhone.
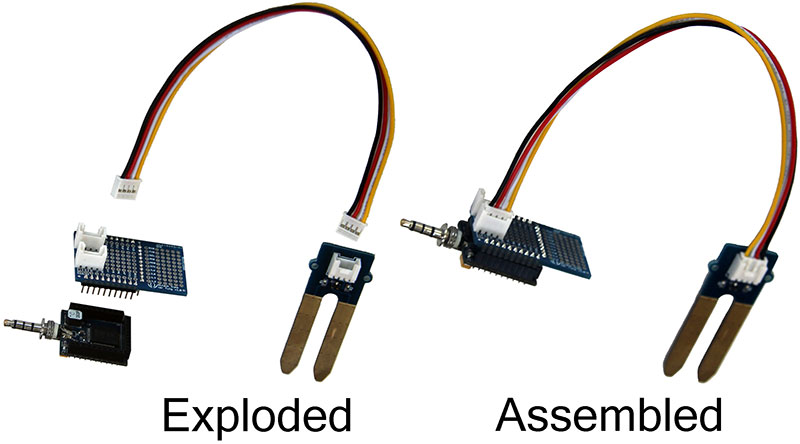
FIGURE 2. Exploded and assembled views of the hardware.
To use HiJack, you’ll need to have some software installed. After downloading techBASIC from the app store, the next step is to install the HiJack software. Go to the HiJack blog on the Byte Works website, scroll to the bottom, and click the download button.
You’ll get a file called HiJack.bas. Follow these steps to move HiJack.bas to your iPhone or iPad:
- Run iTunes and plug in your iPhone or iPad like you are going to sync it.
- Select the iPhone or iPad from the list of devices in the left column.
- Select Apps along the top button bar.
- Scroll down until you see the File Sharing section.
- Scroll down in the Apps section until you see techBASIC. Click on techBASIC.
- Drag the HiJack.bas file to the techBASIC Documents section.
With everything connected, run techBASIC and tap on the HiJack program from the Programs list to run the HiJack app. Now run around the house, sticking the prongs of the moisture sensors in various plants, and you will see responses like the one in Figure 3.
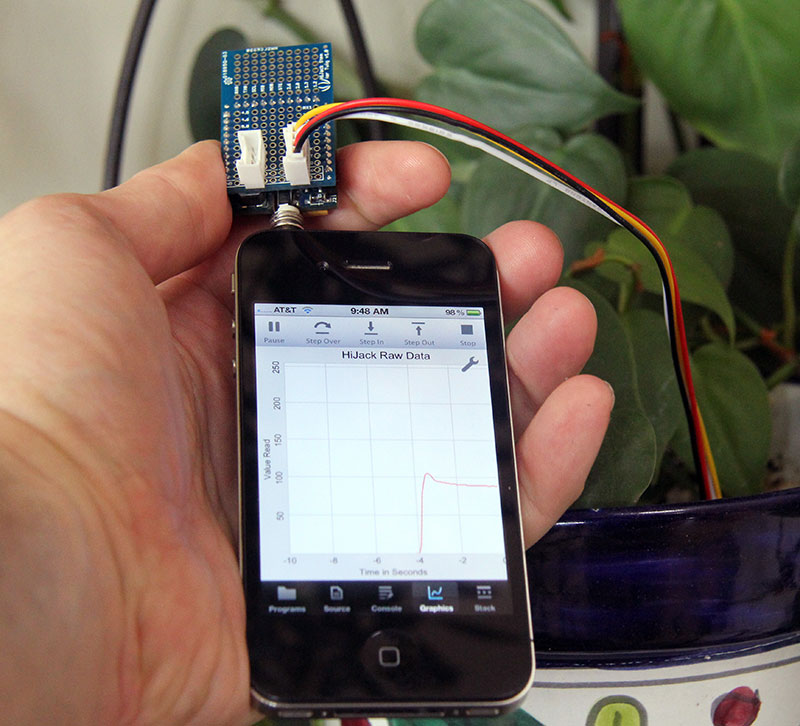
FIGURE 3. HiJack software and hardware with the Grove moisture sensor.
Calibration
Calibration is an important part of creating any measurement instrument. To calibrate my moisture sensor, I compared it to a commercial plant moisture sensor which lists the moisture in a simplified range of one to four. Using potting soil and water, I compared the commercial moisture sensor and the HiJack moisture sensor. Figure 4 shows the data.
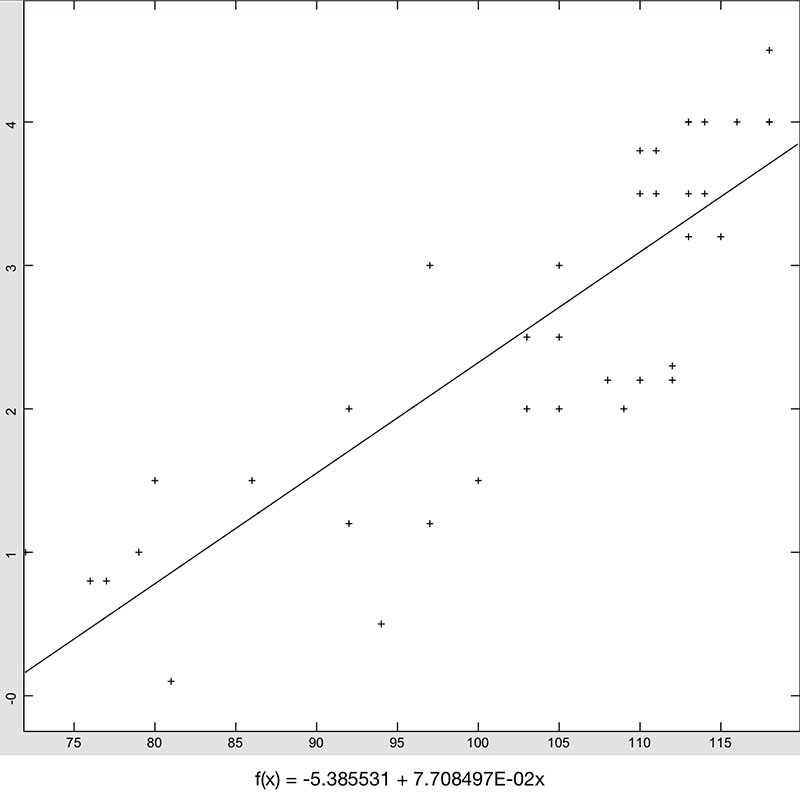
FIGURE 4. HiJack vs.a moisture sensor.
Linear regression using the program in Listing 1 yields this conversion from HiJack readings to the moisture sensor readings:
m = -5.385531 + 0.07708447h
LISTING 1
! Perform linear regression on a CSV file. Each<br />
! line of the file should contain an X and Y<br />
! value separated by a comma.<br />
!<br />
! Determine the number of values.<br />
name$ = "moisture.csv"<br />
OPEN name$ FOR INPUT AS #1<br />
n = 0<br />
WHILE NOT EOF(1)<br />
  INPUT #1, x, y<br />
  n = n + 1<br />
WEND<br />
CLOSE #1
! Dimension an array for the values.<br />
DIM v(n, 2)
! Read the values.<br />
OPEN name$ FOR INPUT AS #1<br />
FOR i = 1 TO n<br />
   INPUT #1, v(i, 1), v(i, 2)<br />
NEXT<br />
CLOSE #1
! Find the sums of X, X^2, Y and XY. Also<br />
! find the min and max X values for later<br />
! use when drawing the fitted line.<br />
sx = 0<br />
sx2 = 0<br />
sy = 0<br />
sxy = 0<br />
minX = 1E30<br />
maxX = -1E30<br />
FOR i = 1 TO n<br />
  sx = sx + v(i, 1)<br />
  sx2 = sx2 + v(i, 1)*v(i, 1)<br />
  sy = sy + v(i, 2)<br />
  sxy = sxy + v(i, 1)*v(i, 2)<br />
  IF v(i, 1) < minX THEN minX = v(i, 1)<br />
  IF v(i, 1) > maxX THEN maxX = v(i, 1)<br />
NEXT
! Form the regression matrices.<br />
A = [[sy,  sx],<br />
     [sxy, sx2]]<br />
B = [[n,  sy],<br />
     [sx, sxy]]<br />
C = [[n,  sx],<br />
     [sx, sx2]]
! Calculate the slope and intercept.<br />
c0 = DET(A)/DET(C)<br />
c1 = DET(B)/DET(C)
! Create an array showing the fit.<br />
DIM fit(0 TO 10, 2)<br />
FOR i = 0 TO 10<br />
  fit(i, 1) = minX + i*(maxX - minX)/10<br />
  fit(i, 2) = c0 + c1*fit(i, 1)<br />
NEXT
! Create the plot. Add the individual points<br />
! and the fitted line.<br />
DIM myPlot AS Plot, scatterPlot AS PlotPoint,<br />
   fitPlot AS PlotPoint<br />
myPlot = Graphics.newPlot<br />
scatterPlot = myPlot.newPlot(v)<br />
scatterPlot.setStyle(0)<br />
scatterPlot.setPointStyle(2)<br />
fitPlot = myPlot.newPlot(fit)<br />
myPlot.setRect(0, 0, Graphics.width,<br />
   Graphics.height - 41)
! Add a label showing the equation of the fit.<br />
DIM equation AS Label<br />
equation = Graphics.newLabel(0, Graphics.height<br />
   - 31, Graphics.width)<br />
equation.setAlignment(2)<br />
e$ = "f(x) = " & STR(c0) & " + " & STR(c1) &<br />
   "x"<br />
equation.setText(e$)
! Show the graphics screen.<br />
System.showGraphics
Better Software
While the general HiJack software works, it doesn’t have much pizazz. We’ll create a custom program to read the moisture sensor and present it in a much more pleasing way.
Let’s look at the design for a moment before looking at how the program is written. The design serves as a roadmap for discussing the code.
The top of the screen is occupied by a large label reminding us what this program does. Below that is the digital moisture value in another label. We’ll use a progress bar as an analog moisture meter; this is shown in Figure 5 right below the five labels used to show the scale. There are four TextView objects below the progress bar. Color is used to show the relative moisture, starting with light blue for dry soil and moving to darker blue for wet soil. A few common plants are listed in each group; when the soil’s moisture is at or below the level shown, it’s time to water the plant. Finally, there is a Quit button at the bottom of the screen to stop the program.
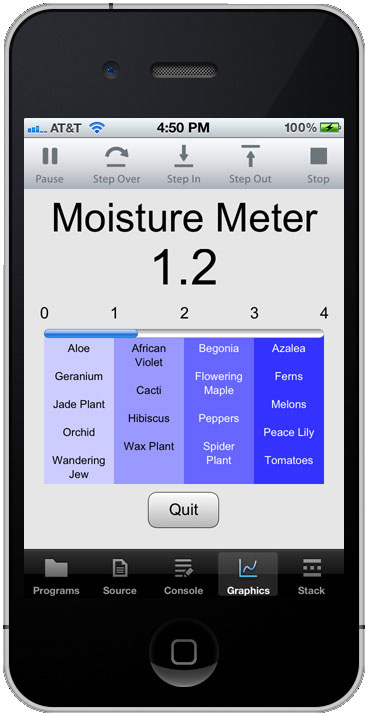
FIGURE 5. Moisture sensor GUI.
The complete program is in Listing 2, which is available at the end in the downloads, since it’s too large to print. Instead, let’s walk through it chunk by chunk.
! HiJack Moisture Meter
! Get the size of the graphics<br />
! screen<br />
width = Graphics.width<br />
height = Graphics.height
We’ll use the size of the graphics screen to calculate appropriate values for the position and size of controls.
To save some typing, the program starts by placing these values in local variables.
! Paint the background light gray<br />
bg = 0.9<br />
Graphics.setColor(bg, bg, bg)<br />
Graphics.fillRect(0, 0, width, height)
The default screen is white, and that just won’t do. techBASIC has a built-in class called Graphics that is used to draw on the graphics screen. setColor and fillRect paint the entire screen a light gray.
! Create a Quit button<br />
DIM quit AS Button<br />
quit = Graphics.newButton(width/2 - 36,<br />
   height - 57)<br />
quit.setTitle(“Quit”)<br />
quit.setBackgroundColor(1, 1, 1)<br />
quit.setGradientColor(0.7, 0.7, 0.7)
Our program will be an event-driven program, so it will run until it is stopped. These lines create a Quit button centered near the bottom of the screen. Rather than the default white button, we’re using a gradient to create a shadowed button.
To make the Quit button function, we’ll need to add a subroutine that handles button clicks. Here’s the one in our program, found near the bottom of the complete listing. It checks to make sure it was the Quit button that was tapped, then stops the program.
! Handle a tap on a button<br />
!<br />
! Parameters:<br />
!   ctrl - The button tapped<br />
!   time - When the button was<br />
!      tapped
SUB touchUpInside(ctrl AS Button, time AS<br />
   DOUBLE)<br />
IF ctrl = quit THEN<br />
  STOP<br />
END IF<br />
END SUB
This is enough code to produce a working program. When you run it, you should see a Quit button on a gray background, and tapping the Quit button should exit the program.
! Put the name of the program at<br />
! the top of the screen<br />
DIM mmLabel AS Label<br />
mmLabel = newLabel(0, 10, width, 40, 40,<br />
   “Moisture Meter”)<br />
mmLabel.setBackgroundColor(bg, bg, bg)
This code creates a label. We’ll be creating a lot of labels with various positions, sizes, and text, so this code is actually calling a subroutine in our program to do some of the repetitive work, followed by setting the background color for the label so it matches our screen background. Here’s the subroutine that is called to create the label; it appears a bit later in the complete program listing.
! Create a label<br />
!<br />
! Parameters:<br />
!   x - Horizontal location<br />
!   y - Vertical location<br />
!   width - Label width<br />
!   height - Label height<br />
!   fontSize - Point size for the<br />
!      font<br />
!   text$ - Label text<br />
!<br />
! Returns: The label
FUNCTION newLabel (x, y, width, height,<br />
   fontSize, text$) AS Label<br />
DIM nl AS Label<br />
nl = Graphics.newLabel(x, y, width, height)<br />
nl.setText(text$)<br />
nl.setBackgroundColor(1, 1, 1, 0)<br />
nl.setAlignment(2)<br />
nl.setFont(“Sans_Serif”, fontSize, 0)<br />
newLabel = nl<br />
END FUNCTION
This subroutine creates a variable called nl — short for new label — to hold the label, then calls Graphics.newLabel to create the actual label. nl.setText sets the text for the label.
nl.setBackgroundColor sets the background color using the normal three red, green, and blue components which range from 0 to 1, but in this case, it also sets the alpha level. The alpha level controls how opaque the color is. By setting the background alpha level to 0, we’re setting it to be completely transparent so anything under the label shows through. This means we don’t have to set the background color for each label to the background screen color. Wait. Isn’t that exactly what we did after creating the mmLabel a moment ago? Well, yes — but that was a special case. It turns out techBASIC puts a control on the graphics screen to give you some options for dealing with plots. We cover up this control by setting the background for the title label to an opaque color.
The next two lines center the text and set the font size. Finally, we set the return value and return the new label to the caller.
! Create a large label to show<br />
! the moisture level<br />
DIM value AS Label<br />
value = newLabel(0, 60, width, 40, 50, “0”)
The same newLabel subroutine is used here to create a large label that will display the digital readout for the moisture meter. We’ll see the subroutine that actually sets the value later. For now, we start with a reading of 0.
! Add 5 small labels to show the<br />
! moisture scale along the top of<br />
! the moisture bar<br />
DIM nums(5) AS Label<br />
plantLabelWidth = (width - 40)/4<br />
FOR i = 0 TO 4<br />
  x = i*plantLabelWidth<br />
  nums(i + 1) = newLabel(x, 115, 40, 20, 16,<br />
     STR(i))<br />
NEXT
Our newLabel subroutine is getting quite a workout! Here, we use it again to create five labels (0 to 4) that show the scale for the analog readout. The various calculations evenly space the five labels across an area of the screen that extends from 20 pixels from the left edge to 20 pixels from the right edge. This is the size we’ll use in a moment for the progress bar we’ll use as an analog meter.
! Create the strings that will<br />
! name the plants in each<br />
! moisture group<br />
DIM plants(4) AS TextView, plants$(4)<br />
addPlant(“Aloe”, plants$(1))<br />
addPlant(“Geranium”, plants$(1))<br />
addPlant(“Jade Plant”, plants$(1))<br />
addPlant(“Orchid”, plants$(1))<br />
addPlant(“Wandering Jew”, plants$(1))<br />
addPlant(“African Violet”, plants$(2))<br />
addPlant(“Cacti”, plants$(2))<br />
addPlant(“Hibiscus”, plants$(2))<br />
addPlant(“Wax Plant”, plants$(2))<br />
addPlant(“Begonia”, plants$(3))<br />
addPlant(“Flowering Maple”, plants$(3))<br />
addPlant(“Peppers”, plants$(3))<br />
addPlant(“Spider Plant”, plants$(3))<br />
addPlant(“Azalea”, plants$(4))<br />
addPlant(“Ferns”, plants$(4))<br />
addPlant(“Melons”, plants$(4))<br />
addPlant(“Peace Lily”, plants$(4))<br />
addPlant(“Tomatoes”, plants$(4))
We’re going to add four text views now; each of which will have a background color that indicates the relative moisture level and a list of common plants that should be watered when the soil is at or below the indicated level. The text views will slightly overlap the progress bar, so we want to create them first so the progress bar is drawn on top. This makes them look like an integral part of the analog meter, rather than an afterthought sitting below it. This first chunk of code sets up the text that will appear in each text view. It calls the addPlant subroutine that appears later in the listing.
! Add a plant name to a string<br />
! containing plant names<br />
!<br />
! Parameters:<br />
!   newPlant$ - New plant name<br />
!   plant$ - Current plant names
SUB addPlant (newPlant$, BYREF plant$)<br />
IF LEN(plant$) <> 0 THEN<br />
  plant$ = plant$ & CHR(10) & CHR(10)<br />
END IF<br />
plant$ = plant$ & newPlant$<br />
END SUB
This subroutine checks to see if the list of plants is empty. If not, it adds two new line characters to the string, then adds the new plant name.
! Add colored labels below the<br />
! moisture bar showing the plants<br />
! in each group<br />
plantLabelHeight = 150<br />
FOR i = 1 TO 4<br />
  x = 20 + (i - 1)*plantLabelWidth<br />
  color = 1 - i/5<br />
  plants(i) = newTextView(x, 145,<br />
     plantLabelWidth, plantLabelHeight, 11,<br />
     color, plants$(i))<br />
NEXT
Next, we create the four text views. There’s a bit of algebra to make them fit evenly across the screen and to set the color, but most of the work is done in the newTextView subroutine. The color we’re setting is actually the white level for the background of the text view, so it’s brighter for the low moisture text views. We’ll see how this is used as we work through the newTextView subroutine, again collected here from later in the complete program listing.
! Create a text view to show a<br />
! list of plants<br />
!<br />
! Parameters:<br />
!   x - Horizontal location<br />
!   y - Vertical location<br />
!   width - TextView width<br />
!   height - TextView height<br />
!   fontSize - Point size for the<br />
!      font<br />
!   color - White level for<br />
!      background; the color will<br />
!      be blue, lightened by this<br />
!      amount<br />
!   text$ - TextView text<br />
!<br />
! Returns: The text view
FUNCTION newTextView (x, y, width, height,<br />
   fontSize, color, text$) AS TextView<br />
DIM ntv AS TextView<br />
ntv = Graphics.newTextView(x, y, width,<br />
   height)<br />
ntv.setText(text$)<br />
ntv.setEditable(0)<br />
ntv.setBackgroundColor(color, color, 1, 1)<br />
IF color < 0.5 THEN<br />
  ntv.setColor(1, 1, 1)<br />
END IF<br />
ntv.setAlignment(2)<br />
ntv.setFont(“Sans_Serif”, fontSize, 0)<br />
newTextView = ntv<br />
END FUNCTION
Most of the newTextView subroutine should look familiar, since it’s very similar to the newLabel subroutine we looked at earlier. Other than returning a text view instead of a label, there are really only two differences. The first is ntv.setEditable, which tells the control that the user can’t edit the text. The other difference is the way the color is set. In this case, we set the red and green components of the background color to the value passed as the color parameter, then set the blue component to bright blue. If the color parameter has a high value — as it does for the control that appears to the left — the red and green components are fairly bright, too, giving a whitish-blue color. For controls towards the right where the moisture is higher, we dim the red and green color to make the control a deeper blue.
! Create the moisture bar<br />
DIM moisture AS Progress<br />
moisture = Graphics.newProgress(20, 140,<br />
   width - 40)
The last control is the progress bar used as an analog moisture meter.
! Set HiJack to sample 10 times<br />
! per second<br />
HiJack.setRate(10)
The HiJack hardware has a variable sample rate. We can leave it at the default of about 42 Hz, but higher sampling rates use more power. Lowering it to 10 Hz saves power and — let’s face it — even 10 samples per second is overkill for a moisture meter.
! Show the graphics screen<br />
System.showGraphics
Finally, we tell techBASIC we want to see the graphics screen rather than the default, which is the text console screen. So far, we’ve done everything except actually read the HiJack sensor and display the results. We want to do that on a regular basis for as long as the program runs. The nullEvent subroutine is called repeatedly when the program is not doing something else, so it’s the perfect place to read the HiJack device.
! Read and process HiJack values<br />
!<br />
! Parameters:<br />
!    time - Event time
SUB nullEvent (time AS DOUBLE)<br />
v = HiJack.receive<br />
m = -5.385531 + 0.07708497*v(1)<br />
IF m < 0 THEN m = 0<br />
IF m > 4 THEN m = 4<br />
moisture.setValue(m/4)<br />
value.setText(STR(INT(m*10)/10))<br />
END SUB
Each time this subroutine is called, it starts by calling HiJack.receive. This fetches a two-element array from the HiJack sensor. The first element is the 0-255 value returned by the AD converter, while the second is a time stamp indicating when the data is collected.
The next line converts the HiJack value to a moisture reading from 0-4, using the fit we got from calibrating the moisture sensor earlier. The following two lines pin the value to the desired range, discarding values that are above or below the supported range.
Finally, we set the analog moisture meter (dividing by 4 because progress bars expect a value between 0 and 1) and the digital readout (using the INT function to strip off all but one decimal point from the result).
Now, get out there and check your soil! NV
Resources
Here are some links to resources and locations where the parts can be purchased.
HiJack Development Kit
$79.00 US
www.seeedstudio.com
Grove Moisture Sensor
$4.99 US
www.seeedstudio.com
techBASIC
$14.99 US
www.byteworks.us/Byte_Works/techBASIC.html
Apple App Store
http://itunes.apple.com/us/app/techbasic/id470781862?ls=1&mt=8
HiJack Source Code for techBASIC
www.byteworks.us/Byte_Works/Blog/Entries/2011/12/7_HiJack_Hello_world!_Project.html
Downloads
iPhone-Moisture-Sensor.zip
What’s in the zip?
Source Code Listings