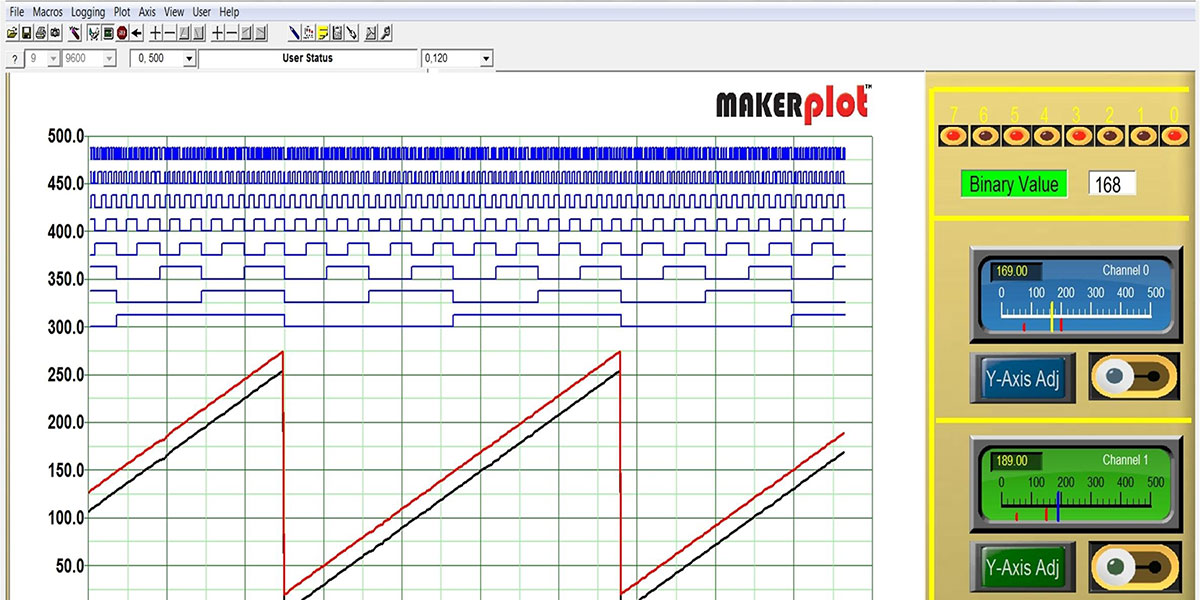
This MakerPlot article is about Event Codes. Event Codes are the instructions that make every switch, button, and textbox control an Interface to do what you want it to do. Event Codes get executed whenever you click on a control (an external event) or when an internal event happens to cause an action by the control — like an alarm going off when an analog value is above or below the set levels. Event Codes consist of one or more MakerPlot instructions, and every control that reacts to internal or external stimulus has to have some form of Event Code.
In our last article, we showed you how to build a custom Interface called My_Interface.spm using meters, switches, buttons, and textboxes that consist of “graphics only” controls at this point. Without Event Codes, these controls can’t do anything. For example, if you click on a button, nothing will happen. This article will fill in the blanks with Event Codes for each of the controls so they will actually work and — more importantly — to instruct you how to do it when you create your own Interfaces. If you already have MakerPlot installed, you can follow along. If you haven’t already done so, you can download a free 30 day trial copy of MakerPlot from www.makerplot.com. If you like what you see and what it does, you can order it from the NV Webstore at a discounted price. Let’s get going.
Event Code Basics
MakerPlot Event Codes are the instructions for programming the controls that populate any Interface. The best way to learn any programming language (IMHO) is to see what others have done with it. Following our own advice, we want to begin our Event Code lesson by showing you some fundamental uses of it to make meters, switches, and buttons do things.
To begin, load the My_Interface.spm and right-click on the Reset Plot button to bring up the Object Editor.
Figure 1 displays the Event Code for this button. As you can see, it’s simply one instruction (!RSET), and comments are prefaced by a single quote as in ‘Reset Plot above the instruction. When the Reset Plot button is clicked, the !RSET instruction is executed which clears the plot area and sets the plot to time zero.
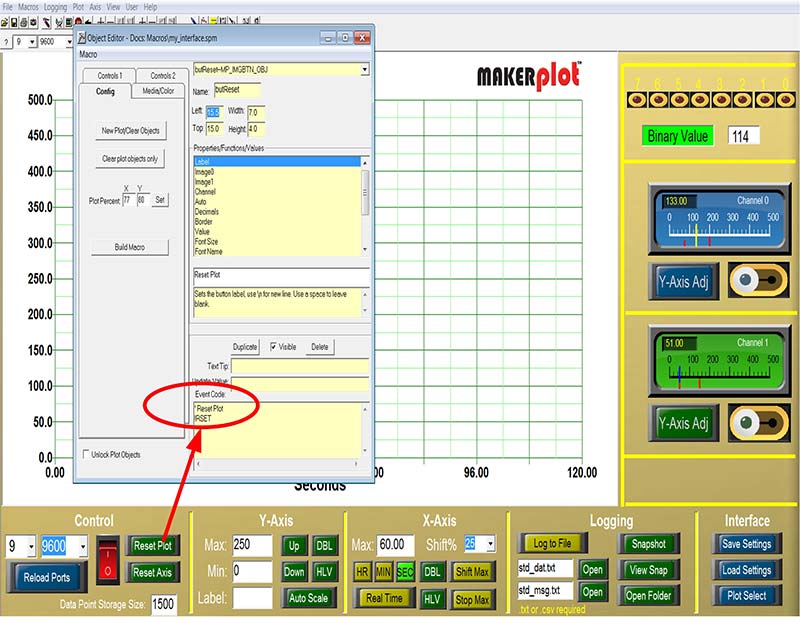
Figure 1. Reset Plot button Event Code.
What’s most important to realize is that you have to enter Event Codes into each control; they don’t appear by themselves. Another important point is the exclamation point (!) prefix to each instruction. This tells MakerPlot that what follows is one of its instructions. Figure 2 is another example of a single instruction Event Code (!SFTU). This one is for the Y Axis “shift plot” up button. When it’s clicked, the plot line values are shifted up by a defined amount. These are examples of single instruction Event Codes, but for many controls this is not enough.
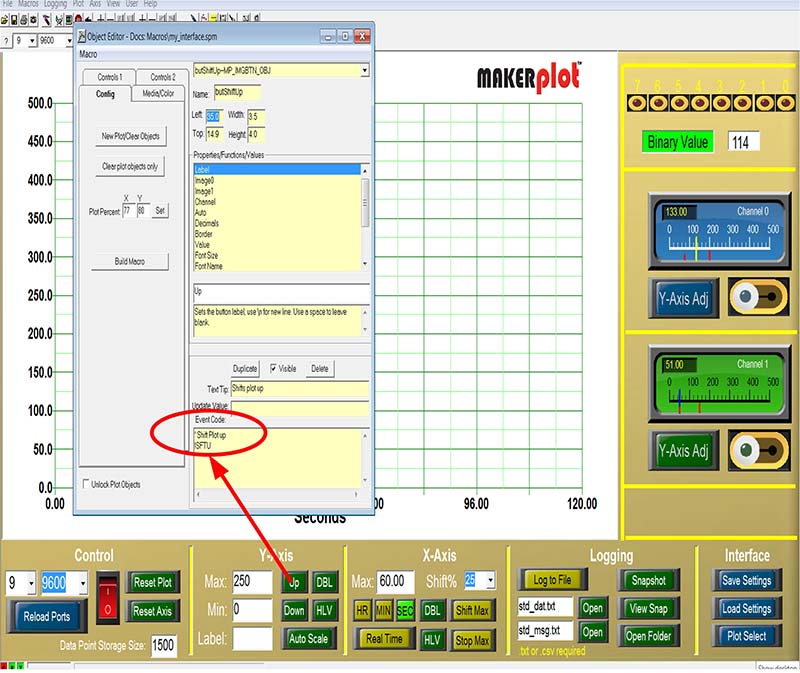
Figure 2. Y Axis Up button Event Code.
Event Code Variables
As an example of a more complex Event Code, refer to Figure 3 where we’ve right-clicked on the Y Axis Max Textbox and brought up the Object Editor listing for it.
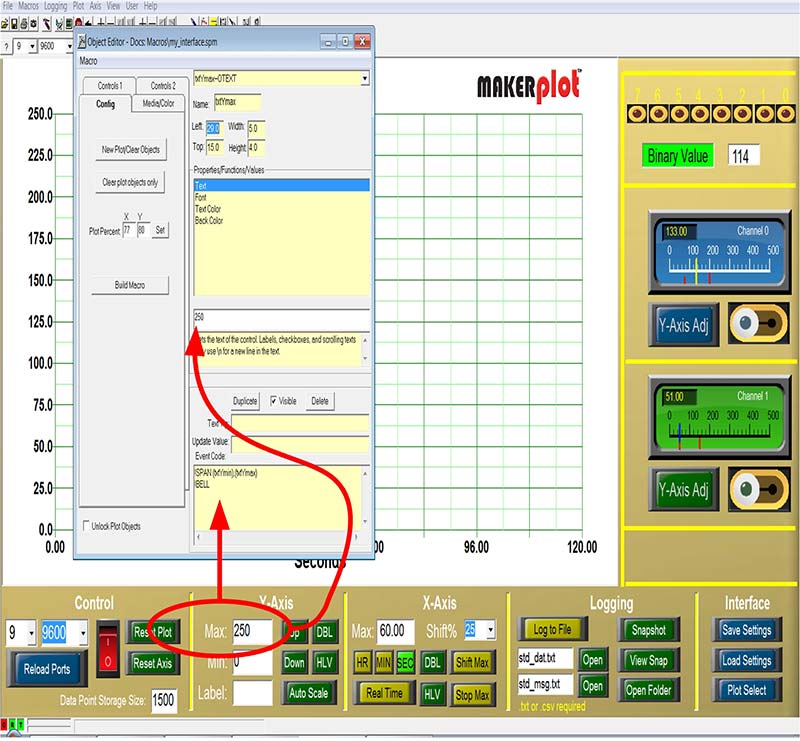
Figure 3. Y Axis Max value Event Code.
Instead of just stand-alone instructions, this Event Code has variables associated with it, as well:
!SPAN (txYmin), (txYmax)
!BELL
Here, txYmin represents the value currently in the Min textbox (0), and txYmax is equal to 250 (max). You can see the 250 value in the Object Editor; this is the same 250 value in the Max text box in the Y axis menu. With this particular Interface, the user can manually adjust these values by keying them into the Min and Max text boxes and pushing the Enter key; in doing that, basically this is what happens:
txYmin = Min textbox value
txymax = Max textbox value
Every time a new value is keyed into either the Min or Max text boxes, the Event Code for each one is executed and the Y axis is adjusted accordingly. Another button that uses these same variables is the Reset Axis button in the Control menu group (Figure 4).
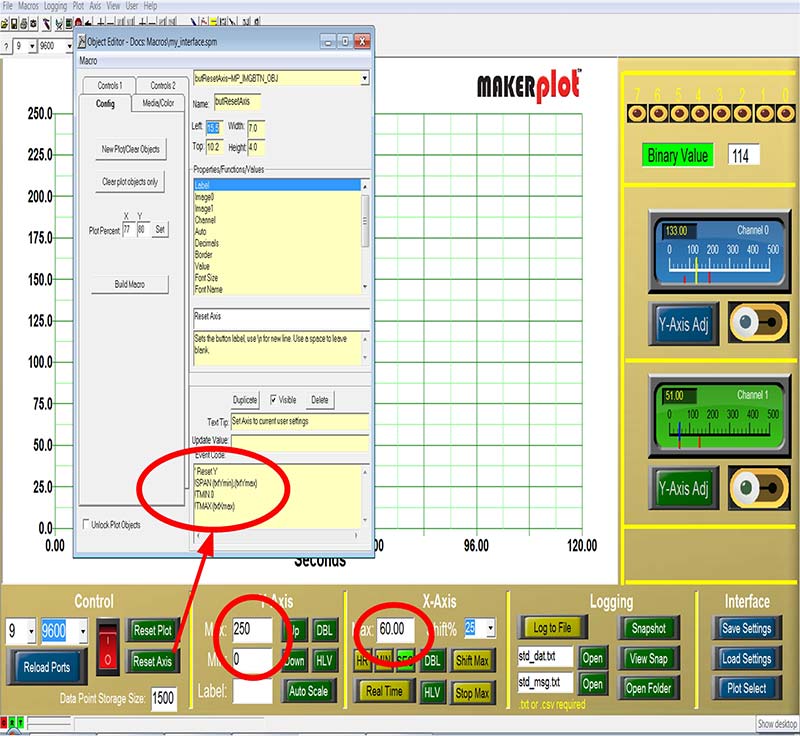
Figure 4. Reset Axis Event Code.
Its Event Code looks like this:
‘ Reset Y
!SPAN (txtYmin),(txtYmax)
!TMIN 0
!TMAX (txtXmax)
Notice that two other variables for the X axis (time) are also introduced. !TMIN 0 sets the starting time of the plot to zero seconds and !TMAX sets the maximum time to txtXmax — which happens to be 60 — as that’s what’s currently entered in the Max textbox. So, when the Reset Axis button is clicked, the X and Y axes are set to these variables.
Linking Event Code in One Control to Affect Another Control
Now, let’s get to the controls that are on our custom Interface — My_Interface.spm — to show you how they work. Right-clicking on the top meter’s Y Axis Adj button brings up the following Event Code:
!POBJ gau_53.max = (AMAX)
!POBJ gau_53.min = (AMIN)
Let’s break this down. Refer to Figure 5 for illustration.
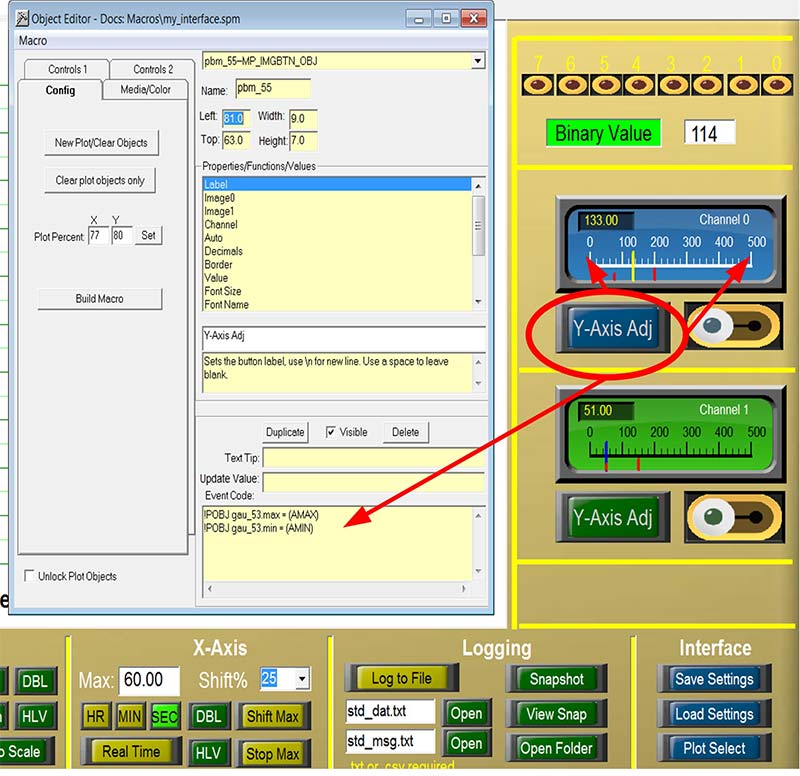
Figure 5. Y Axis Adj Event Code.
- !POBJ is the MakerPlot “plot object” instruction.
- gau_53 is the name of the top meter.
- gau_53.max is the meter’s maximum range scale setting.
- gau_53.min is the meter’s minimum range scale setting.
- AMAX is the current Y scale maximum set in the Y axis Max textbox.
- AMIN is the current Y scale minimum set in the Y axis Min textbox.
So, when the Y Axis Adj button is clicked, this Event Code sets the meter range to the AMIN and AMAX values, which are 0 and 500 in this example. Just as important, what we’re doing is linking one control (the Y Axis Adj) to affect another control (the top meter).
Now, let’s look at how the alarm slider switch controls the meter’s audio alarm condition. Figure 6 illustrates the Event Code and the related actions.
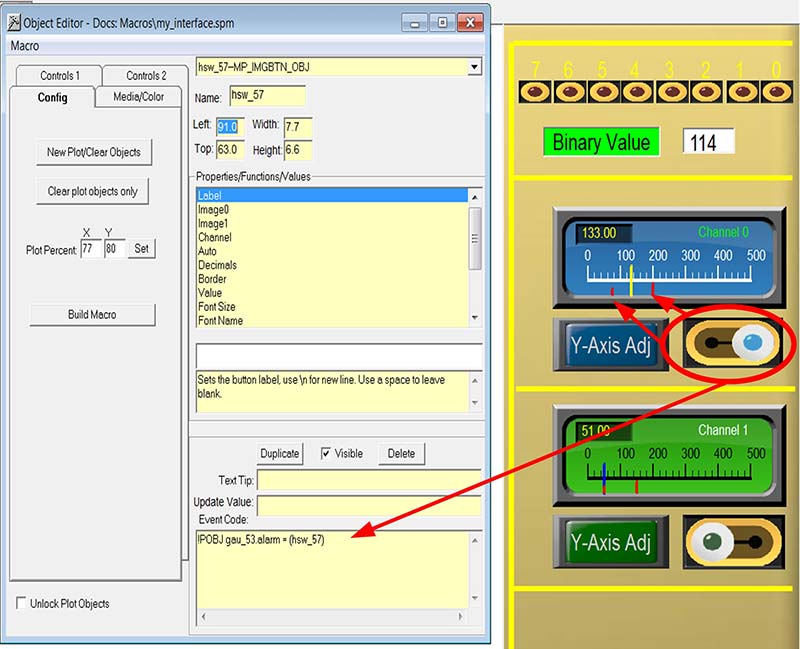
Figure 6. Meter alarm control Event Code.
This one is simpler in that it only has one instruction:
!POBJ gau_53.alarm = (hsw_57)
- !POBJ is the MakerPlot plot object instruction.
- gau_53 is the name of the top meter.
- gau_53.alarm is the name of the top meter’s alarm state (ON or OFF, 1 or 0) which is set equal to the value of hsw_57 as defined by the parenthesis ( ).
- hsw_57 is the horizontal switch in question that has an ON or OFF state.
These are just a few Event Code examples as each control is different. However, it’s all logical once you get the hang of how MakerPlot creates and parses the Event Codes. You can find the Event Code reference on page 81 of the MakerPlot Guide. There are many more examples in the MakerPlot Guide which is also a menu item under More. Finally, there is a MakerPlot Video Tutorial in the Maker series entitled Event Codes, so check this out as well at www.makerplot.com → More → Videos → Maker → Event Codes.
Object Properties Dropdown Menus
If you right-click on nearly any control object, it will bring up a menu for that control as in Figure 7.

Figure 7. LED 7 dropdown menu.
This is for LED 7. Nearly every property for this control is listed in the dropdown menu, and state 0 is highlighted as an example.
Every LED control has two states: OFF is represented by state 0, and ON is represented by state 1. Each state has choices for image and color. We originally chose red LEDs to represent the digital data, but the color and LED image itself (there are several choices) can be altered by means of the dropdown menu. For example, you could choose a green color for the OFF state and a blue color for the ON state to replace the red colors. You can even choose a different LED style entirely. The point is it’s easy to make changes to the controls using the right-click dropdown menu for it.
Once again, each control has its own set of properties (as illustrated in Figure 8) for the horizontal meter just below the string of LEDs.
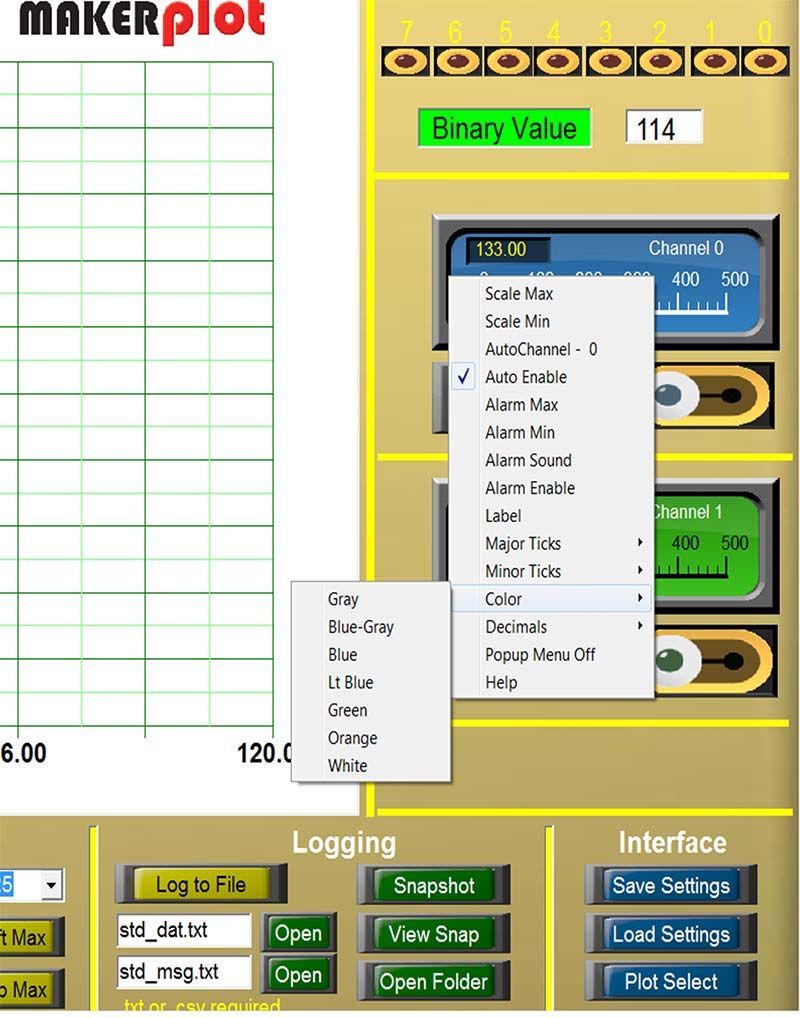
Figure 8. Meter dropdown menu.
Here, we’ve highlighted the color choices for the meter background. Clicking on the color choice will change the meter background as in Figure 9 where the blue background was changed to orange. It’s that simple!
Figure 9. Meter color change to orange.
Back to the Object Editor
While the dropdown menus are great for adjusting most control properties, the more complete way is to use the Object Editor. As before, to bring up the Object Editor right-click on the top Y Axis Adj button (for this example); all the properties are displayed as in Figure 10.

Figure 10. Object Editor for Y Axis Adj.
The Object Editor displays everything about the control including elements that the dropdown menus don’t address, like the Text Tip. Before we entered the Text Tip (the arrow is pointing at it in Figure 10), there was none. Now, if you mouse over the Y-Axis Adj button, the Text Tip will appear. Notice that the Event Code that was described earlier is also shown.
The Object Editor is quite an important MakerPlot tool for naming, positioning, sizing, and configuring each control object. It’s so extensive, in fact, that space does not permit going into it more deeply. There are two videos about the Object Editor under More → Videos → Maker on the website that explain most of its functions. There’s also the 200+ page guide.
The Macro Builder
The job of building controls falls to the Object Editor, and it creates the individual instructions and Events Codes for each object. In MakerPlot speak, we call these Macros, which are really nothing more than instruction lists for all controls on the Interface.
It’s the Macro Builder that organizes and maintains these instruction lists, including all relevant variables under the Interface’s file name. The Macro Builder is also where changes to an Interface control — like adding a Text Tip — can occur and be saved.
By way of example, Figure 11 shows the MakerPlot instructions for two horizontal meters.
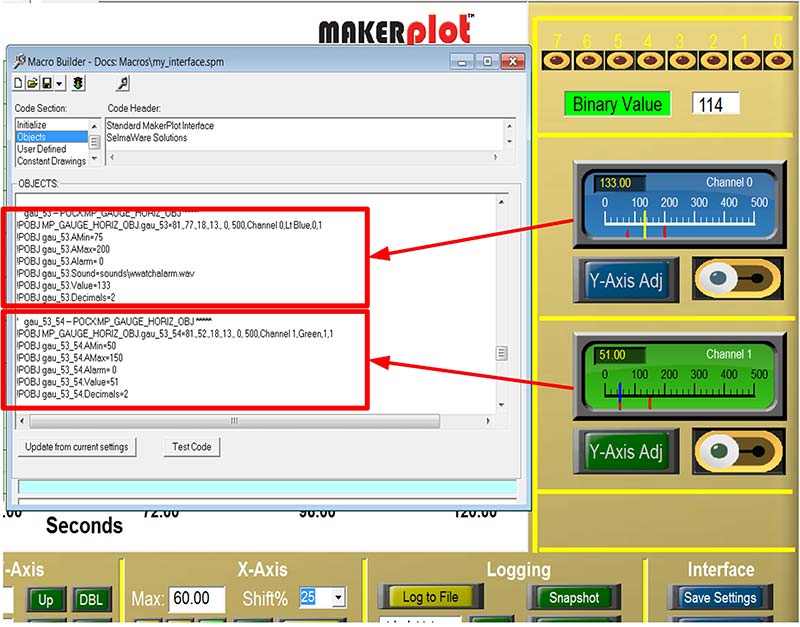
Figure 11. Macro Builder listing.
These instructions were automatically created in the Macro Builder as the meters were being built. Notice how each instruction sets itself equal to a variable for the meter’s characteristics:
Top Meter
‘ gau_53 — POCX:MP_GAUGE_HORIZ_OBJ *****
!POBJ MP_GAUGE_HORIZ_OBJ.gau_53=
81.,77.,18.,13., 0, 500,Channel 0,Lt Blue,0,1
!POBJ gau_53.AMin=75
!POBJ gau_53.AMax=200
!POBJ gau_53.Alarm= 0
!POBJ gau_53.Sound=sounds\wwatchalarm.wav
!POBJ gau_53.Value=133
!POBJ gau_53.Decimals=2
Bottom Meter
‘ gau_53_54 — POCX:MP_GAUGE_HORIZ_OBJ *****
!POBJ MP_GAUGE_HORIZ_OBJ.gau_53_54=
81.,52.,18.,13., 0, 500,Channel 1,Green,1,1
!POBJ gau_53_54.AMin=50
!POBJ gau_53_54.AMax=150
!POBJ gau_53_54.Alarm= 0
!POBJ gau_53.Sound=sounds\beep.wav
!POBJ gau_53_54.Value=51
!POBJ gau_53_54.Decimals=2
Also notice that the meters have no Event Codes associated with them. The reason is that the meters do not respond to any external stimulus like a mouse click; instead, they are affected by the slider switches below them that change the alarm states from 0 to 1 or vice versa, depending on the state of the slider switch.
Figure 12 shows their Macro Builder listing.

Figure 12. Macro Builder listing for alarm switches.
I’ve repeated it here for clarity, highlighting the Event Code that sets the alarm logic state to equal the logic state of the slider switch — which are hsw_57 (top) and hsw_58 (bottom).
Therefore, when the Alarm slider switch is clicked, it changes state from 1 to 0 or vice versa, and the corresponding meter alarm variable is changed accordingly. Hopefully, it’s making a bit more sense now as far as how the Event Code in one control affects the operation of another control:
Top Meter Alarm ON-OFF Switch
‘ hsw_57 — POCX:MP_IMGBTN_OBJ *****
!POBJ MP_IMGBTN_OBJ.hsw_57=91.,63.,7.7,6.6,
,0,dev\slide-sw\b_slider_blu_h_0.gif,dev\
slide-sw\b_slider_blu_h_1.gif,ON-OFF,1
!POBJ hsw_57.Sound=sw_slide2.wav
‘— Event Code
!POBJ hsw_57.C=!POBJ gau_53.alarm = (hsw_57)
Bottom Meter Alarm ON-OFF Switch
‘ hsw_58 — POCX:MP_IMGBTN_OBJ *****
!POBJ MP_IMGBTN_OBJ.hsw_58=91.,38.,7.9,7.2,
,0,dev\slide-sw\b_slider_grn_h_0.gif,dev\
slide-sw\b_slider_grn_h_1.gif,ON-OFF,1
!POBJ hsw_58.Sound=sw_slide2.wav
‘— Event Code
!POBJ hsw_58.C=!POBJ gau_53_54.alarm =
(hsw_58)
The Macro Builder is an important MakerPlot tool and there is a video on its operation at More → Videos → Maker as well.
Conclusion
We hope by now that you’re getting more familiar with MakerPlot’s inner workings since — like any programming language — the devil is in the details. We’ve made it as painless as possible to learn by offering video tutorials in addition to our extensive guide.
The beauty of MakerPlot is that you can start out with it at the off-the-shelf level with the Interfaces that come standard with the software. Then, if you’re so inclined, you can customize these Interfaces to your liking. Either way, MakerPlot will make your data plotting, logging, and analysis much easier and relevant.
What we’ve shown you in these last two articles is how to create and configure the various controls on the Interface directly on the PC. What we’ll show you in the next article is how to create them DIRECTLY from your micro, which means that you can build Interfaces “on the fly” as needed. This is really a neat feature since you can change the look and feel of the Interface to match your micro’s application.
That’s all for now, so just remember: Got Data – MakerPlot It! NV
Control Instructions
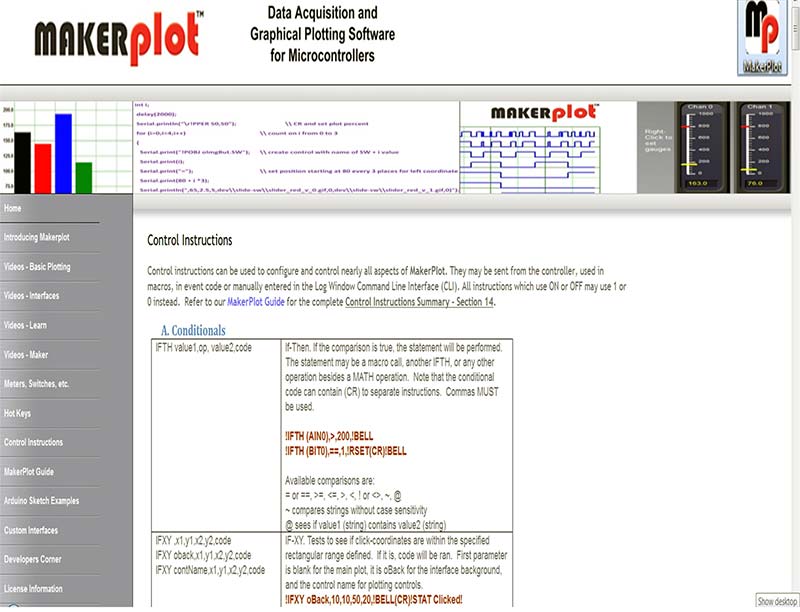
You can find the entire MakerPlot control instruction set on the website. Control instructions can be used to configure and control nearly all aspects of MakerPlot. They may be sent from the controller (used in macros) in Event Code or just manually entered in the Log Window Command Line Interface (CLI). Refer to the guide for the complete Control Instructions Summary starting in Section 14.