If you use microcontrollers in your projects, imagine seeing the graphical data they produce like the image shown above.
When you’re debugging your code, you can certainly do better with graphical data as compared with a terminal program that only shows numbers.
MakerPlot does all of this and connects directly to your microcontroller’s serial port to display analog and digital data in graphical form; it’s DIY software for your microcontroller projects. You can try MakerPlot FREE before you buy. Plus, there’s also a discount if you’re a Nuts & Volts subscriber.
Here’s how to build your own graphical data display today.
Since you’re a Nuts & Volts reader, you’ve probably done or will do a microcontroller project at some point. When you do, you’re going to generate data with your micro. Have you thought about how that data is displayed, logged, debugged, or otherwise presented to you for analysis?
With the popularity of the Arduino, PICAXE, Propeller, Raspberry Pi, BeagleBone, and other microcontrollers now on the market, the choices for the hobbyist have no real bounds these days. Given all these great micros, building a cool circuit and programming one of them is a perfect first step.
So, when things go wrong — especially in the firmware area where it then becomes a show stopper — what mechanisms do you have to debug your code? One way, of course, is to examine it line-by-line, and “hope” that you’ll discover the error in your ways. It’s worked for us in the past as we’re sure it has for you, but it’s time-consuming and iffy at best.
Once you find the errant instruction(s), you can re-compile the code and test it again (and again, and again) until it works. This takes a lot of discipline and a good “feel” for what your code is supposed to be accomplishing. It’s doable, but it’s not the most efficient in terms of time spent.
As a result, it may take lots of head scratching — not to mention many compiles — to solve the problem. When using this method, you don’t have any visibility into what’s going on inside your micro; your thought process is all you have.
To Plot or Not To Plot
Another way to debug your code is to output the analog or digital data that’s generated to your monitor in order to get a visual image of what’s happening. Terminal programs like HyperTerminal can do this, but the data are all numbers.
This makes a lot more sense compared to just “visual” code parsing as it can lend some hints to what’s wrong. However, numbers alone don’t tell the whole story of what’s going on that’s causing your problems. In this case, a picture really is worth a thousand words (or numbers).
If the internal data you’re displaying is graphic in nature (like plot lines of individual data), it’s even simpler. With this graphical information, you can locate your problems much faster and with greater precision as compared with just number-based debugging or manually stepping through your code to try and find the problem.
This is especially true if you’re trying to isolate intermittent problems, like those that depend on an external input voltage source such as a potentiometer or light sensor value that’s converted by an ADC (analog-to-digital converter) into a digital value (threshold and alarm settings come to mind). Let your code run normally, adjust the pot and light levels, and the graphic display will show you where the problem lies instantly.
Enter MakerPlot
Unless you’re a purest that nearly always builds their own handmade circuits, you’re most likely going to purchase an off-the-shelf “working” hardware board with your favorite microcontroller embedded into it. Since you didn’t design and build the hardware portion yourself, you can (correctly) assume that the hardware part of your project is working given that you’ve applied the correct wire hookups, voltage inputs, etc.
All these new micro boards are great hardware animals, and they all generate analog and digital data. So, the questions remain: “How do you plot, log, and display this data?” and “How do you debug your code without an external reference as to what’s going on?”
While you can “roll your own” graphics program to do debugging, that takes a lot of time, skill, and effort. There are software programs out there that can do this, but most are either too fundamental or too over-the-top, similar to expensive and hard-to-use graphic programs from — well, we won’t mention names. Free, or otherwise, they just don’t do the job.
Enter MakerPlot (Figure 1).
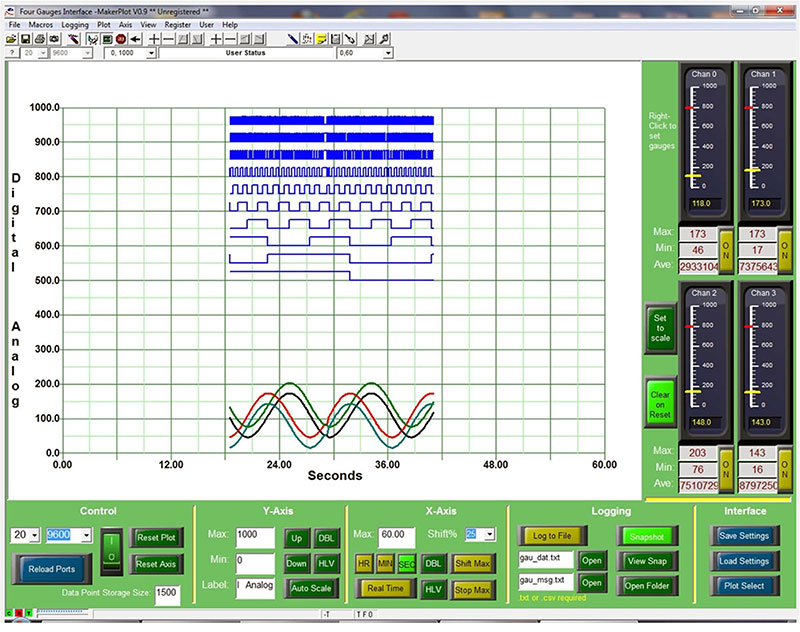
Figure 1: Plotting digital and analog data with MakerPlot.
MakerPlot is Windows software for plotting, data logging, displaying, and debugging analog and digital data generated by your microcontroller. The best part is that there’s no proprietary hardware required to get the data onto your PC monitor; just a serial connection from your microcontroller to the computer — that’s it!
Something as simple as a two-wire RS-232 hookup (TX and Gnd) between your micro and your PC’s serial port is enough. However, modern PCs don’t have nine-pin D connectors anymore, so a USB connection will also work. And, as you well know, this is standard these days with the PC establishing a virtual comm port for the serial data from the micro.
This way, you can have fast, two-way serial communications between the PC and your microcontroller — something that MakerPlot fully supports. Your code debugging just went to a higher level!
Figure 2 is a functional block diagram of MakerPlot’s data flow. You can see the various paths that your data can take going in and out of the MakerPlot software engine. Plus, there’s ample capability for true bi-directional interaction between MakerPlot and your micro. Besides plotting analog and digital data, think of MakerPlot as an extension to your microcontroller for data logging, debugging, and math co-processing. Yes — full-blown floating-point math co-processing for your integer-based micro is possible using MakerPlot. We’ll discuss this more in a subsequent MakerPlot article.
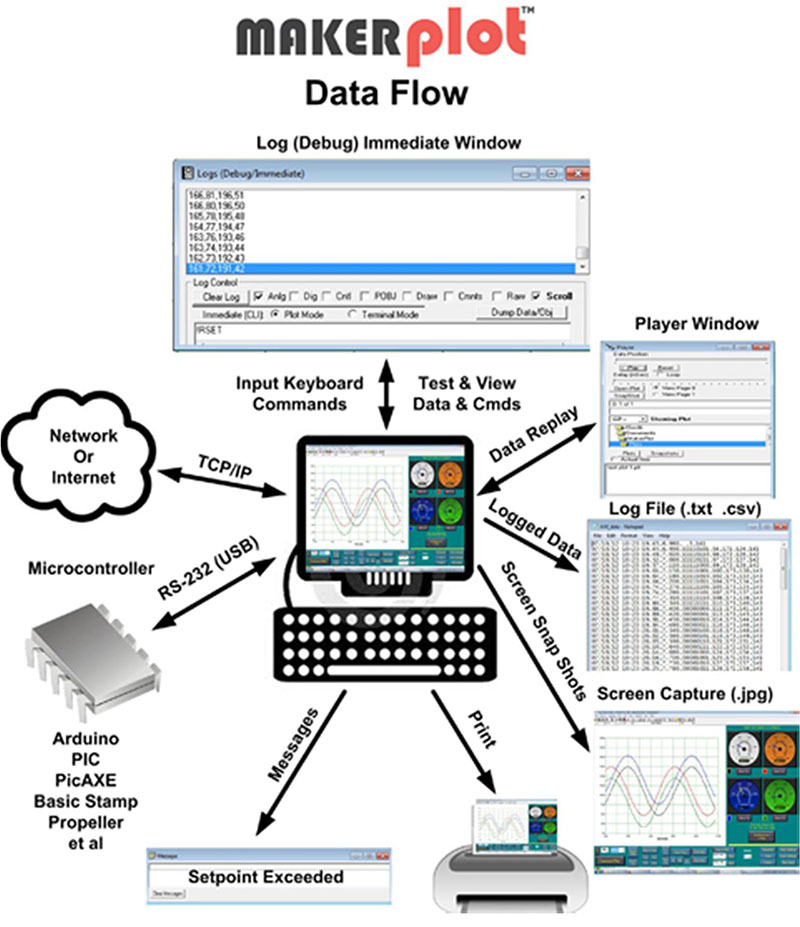
Figure 2: MakerPlot data flow.
For now, let’s look at how MakerPlot can debug your microcontroller’s analog and digital data. Besides data logging in an Excel-compatible CSV format, you can replay data right on your PC’s monitor in a continuous loop, so that you can isolate your micro’s firmware or hardware problem. You can also capture the screen as a jpg image and save it to a file for a permanent record of what happened. And, of course, you can print out the data for a hardcopy.
Besides a hard-wired serial connection from your microcontroller to your PC, you can also monitor your microcontroller remotely via the TCP/IP protocol built into MakerPlot. So, no matter where your micro is physically, you may be able to access its data using MakerPlot. This makes for an excellent debugging tool, let alone a powerful way to monitor remote data (even when everything is debugged and working).
An Example of MakerPlot’s Capabilities
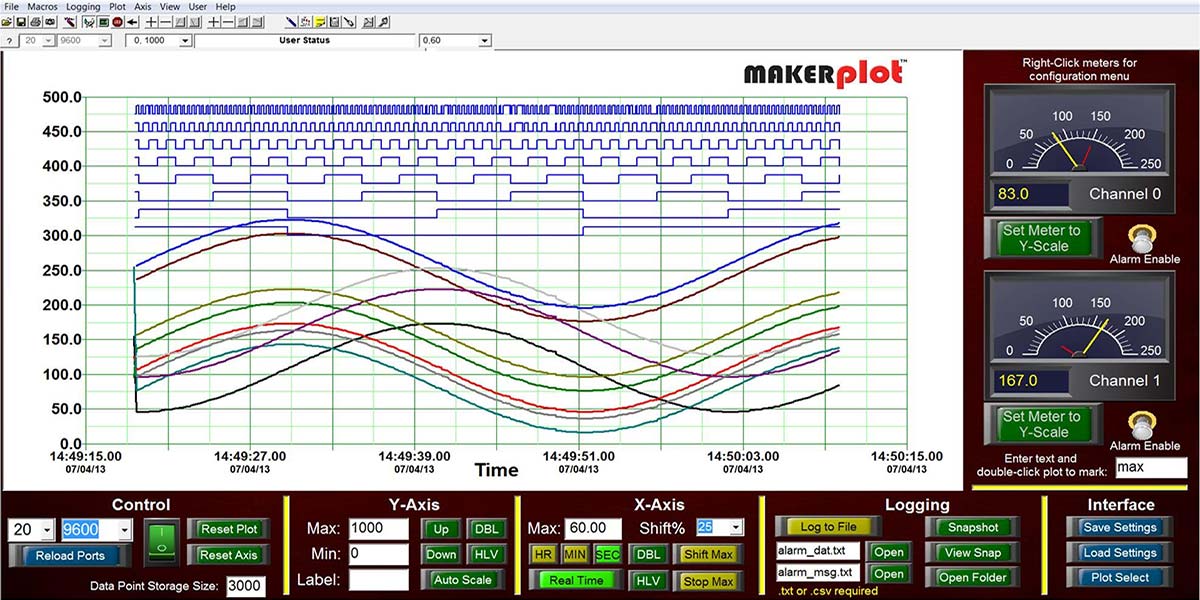
As an example of what MakerPlot can do, let’s assume you have a microcontroller project that involves plotting both analog and digital data. You can do this in near real time as in Figure 3.
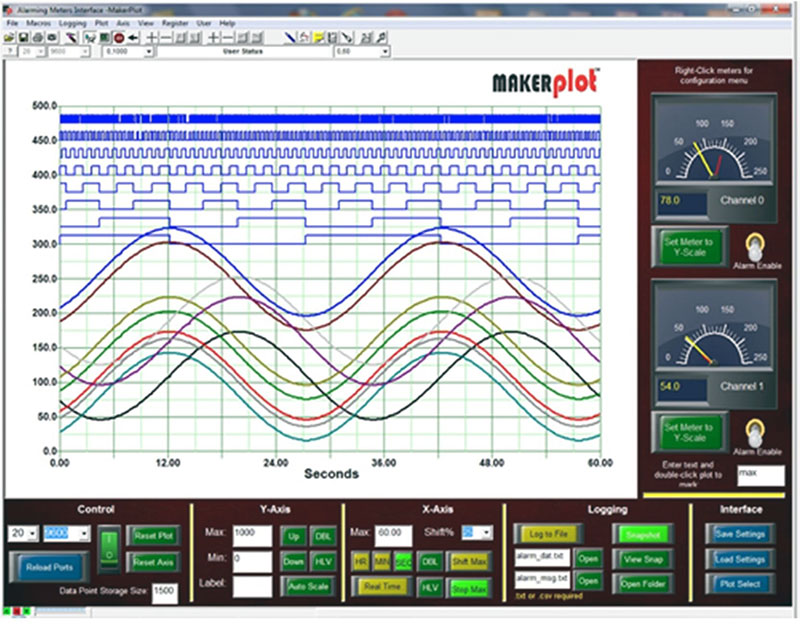
Figure 3: Analog sine wave and digital plots.
Here, you see 10 channels of analog data and eight bits of digital data being plotted along with two meters that display any of the two analog channels that you choose. You can also configure meter alarms to alert you when your analog signals are above or below limits that you set. The bottom menu buttons control the horizontal and vertical scales, as well as data logging and screenshots for recording.
Connecting to MakerPlot
MakerPlot is data acquisition and graphical plotting software that runs on Windows computers. Yes, you can also run it on a Mac, but you’ll need a suitable emulation program. However, the point really is, “How do you get your micro’s data into MakerPlot?” You do it through your microcontroller’s serial port.
Once again, modern PCs don’t have nine-pin D connectors anymore, so you’ll probably need to connect your micro to your PC with a USB cable and driver software on the PC side that can create a virtual comm port.
While we like many of the popular microcontrollers out there, the Arduino seems to be the most popular currently, so most of our code examples are oriented to it.
Figure 4 illustrates an Arduino sketch that generates analog and digital data for testing and — at the same time — shows how easy it is to create a serial connection (just look at the setup). If you don’t use an Arduino, you can take from this example the methods to do your own firmware code using the microcontroller of your choice.
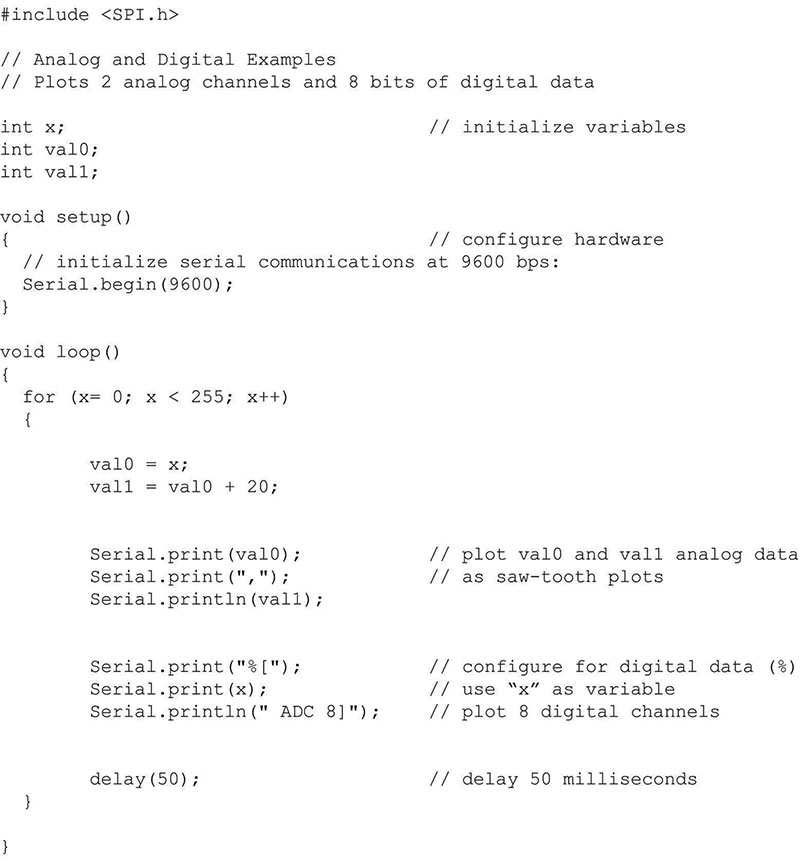
Figure 4: Arduino sketch code example.
The sketch defines the three variables with the serial comm port at 9600 baud. Then, it goes on to plot two analog data channels as val0 and val1, followed by plotting eight channels of digital data from 0 to 255 and repeating. The analog data are simply sent as comma-separated decimal values ending with a carriage return.
The digital data is really the “x” value used in the for loop that is then converted to eight digital “1” and “0” values. The MakerPlot “%” prefix command informs the software that the data is digital (binary). By using the [value ADC 8] string, MakerPlot converts the decimal value of x to eight bits of binary. The important thing to realize is that both analog and digital data are being generated as ASCII characters going to MakerPlot. You can see this by looking at the Serial.print and Serial.println instructions.
Figure 5 is what it looks like with the code running on an Arduino Uno shield. By the way, we call the MakerPlot display screens “interfaces.” So, if you’re interested in plotting, logging, debugging, and otherwise displaying your microcontroller’s analog and digital data in graphical form, MakerPlot is the way to do it.
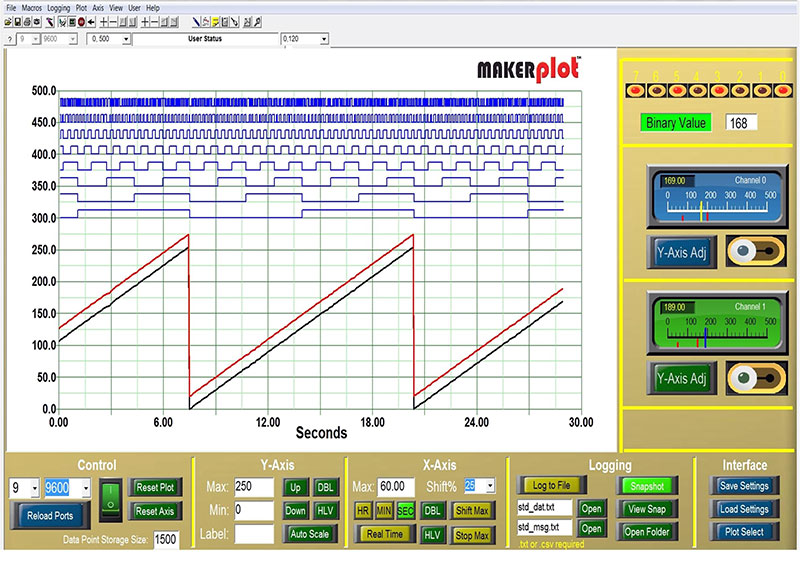
Figure 5: MakerPlot Arduino sketch example.
Why the Name “MakerPlot?"
We named it MakerPlot for those “makers” who want to create simple — yet powerful — screen interfaces for their projects and products.
As you can see, MakerPlot looks like the face of a conventional instrument. With dozens of meters, buttons, switches, and text boxes to choose from, you have full control of how the screen interface is designed and how information is displayed, plotted, logged to files, printed, and more.
Your microcontroller also has the ability to read information directly from these same controls for interactive measurement, plotting, and control. For example, if you have a slider control on the MakerPlot interface screen, your micro can read the slider value and react accordingly. This makes for the start of some great bi-directional project ideas (more to come on this subject in a future article).
MakerPlot is Customizable
With all this capability, where does one start to figure out what can be done with arranging these controls on the interface screen? Figure 6 shows four off-the-shelf interfaces that come with MakerPlot. Ten of these interfaces come standard, and you can build ones like these on your own because you’re provided with all the instructions to do so. The ability to design a customized GUI (graphical user interface) for monitoring your data combined with the ability to program your microcontroller to interface directly and simply with the GUI is a powerful combination for a developer.
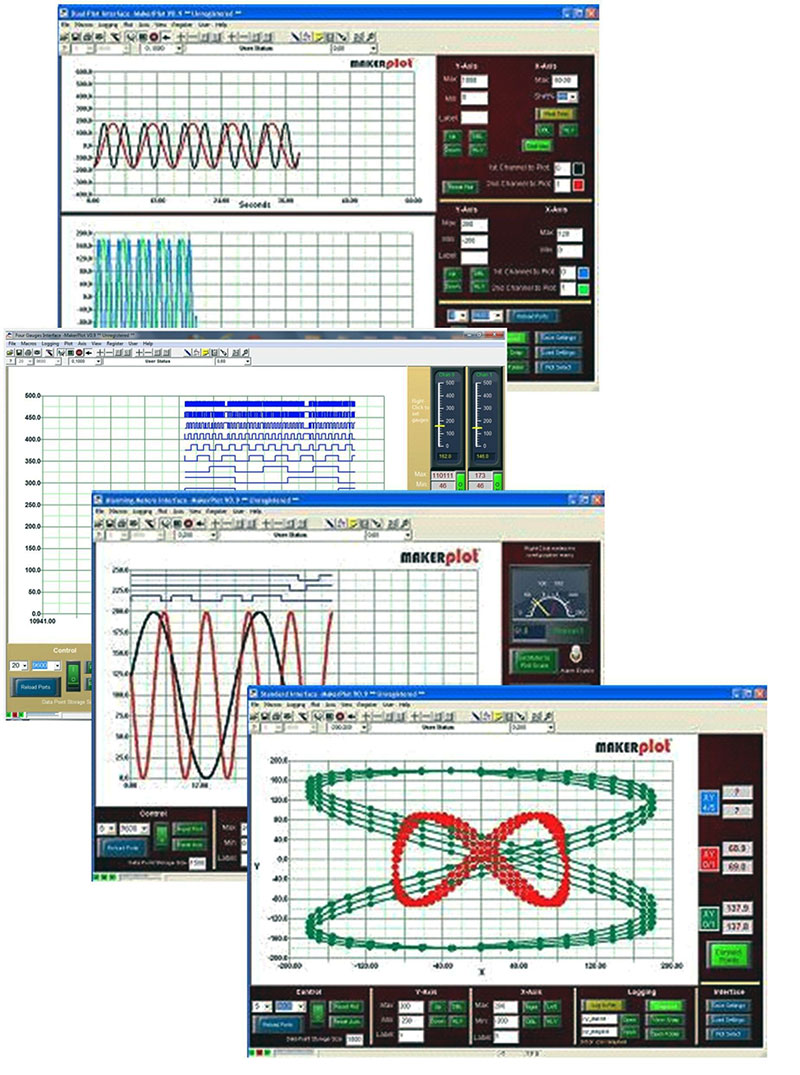
Figure 6: MakerPlot sample interfaces.
That’s the real power behind MakerPlot. It’s designed to be customized — by you!
Conclusions
While we started this article asking how you would debug your micro’s data, the discussion of this topic just naturally got expanded into a greater universe of MakerPlot’s graphic capabilities.
We’ll present much more about MakerPlot in subsequent articles and especially how you can customize it, but you don’t have to wait until then. Full details are available at www.makerplot.com including more sketch examples, video tutorials, and a complete MakerPlot Guide to show you all the inner-workings of this unique software program.
Plus, MakerPlot is available as a FREE 30-day trial download from www.makerplot.com. If you like what you see and what it does, you can order it from the NV webstore at a discounted price.
That’s all for now, so just remember: Got Data — MakerPlot It! NV
StampPlot to MakerPlot
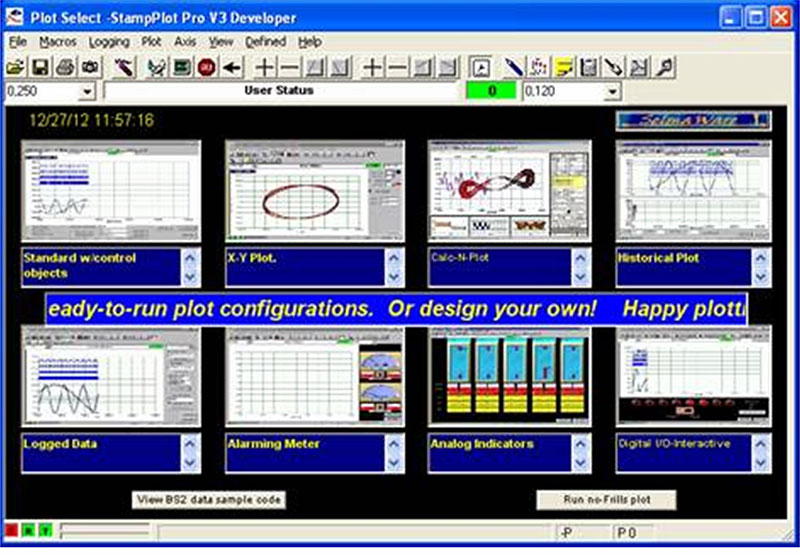
If you’ve ever used the Parallax BASIC Stamp, you may remember a software program called StampPlot. MakerPlot is the successor to StampPlot. Like StampPlot, MakerPlot is authored by Martin Hebel, Associate Professor at Southern Illinois University and author of several Parallax publications including “Process Control,” “Industrial Control,” and, along with yours truly, John Gavlik, “Experiments with Alternative Energy.”
With the maker movement in full force, StampPlot was totally re-engineered and renamed to MakerPlot to reflect the direction of this world-wide influence. Many months of coding and debugging went into the revision of StampPlot to MakerPlot — not to mention better looking and more functional graphical controls like switches, meters, text boxes, LEDs, and so forth.
MakerPlot supports just about any microcontroller out there that can output analog and digital data in a serial ASCII format. So, if you remember StampPlot (or even if you don’t), you’ll be even more pleased with MakerPlot and its expanded capabilities and documentation.
The Logs (Debug/Immediate) Window
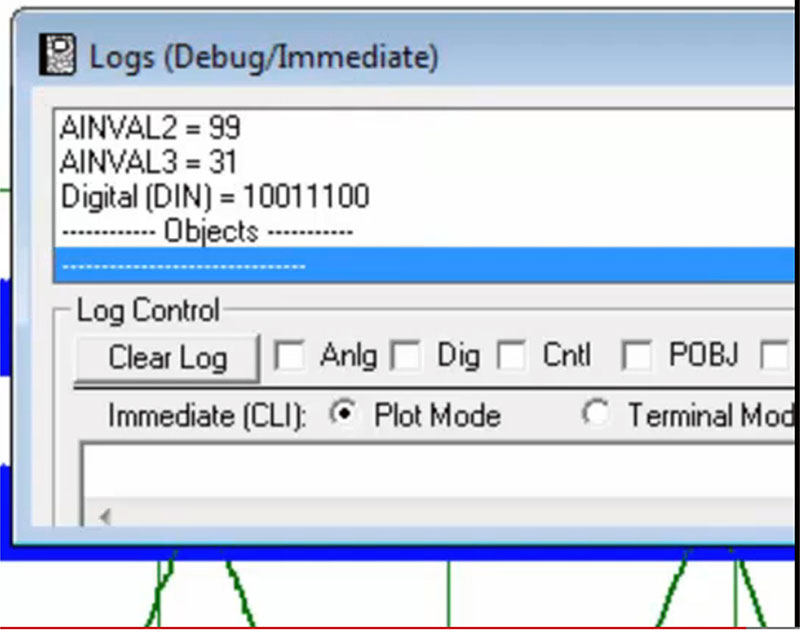
As this article points out, MakerPlot has a lot of debugging capabilities built into it. That is no more evident than in the Logs (Debug/Immediate) feature. With it, you can witness every analog and digital data point, as well as messages and other MakerPlot real time data streams. Plus, you can manually input analog and digital data (and commands) into MakerPlot to test your code.
Everything you do is logged and displayed to you in real time, so you have a record of what you did. For more information, check out our Video Tutorial Series on our www.makerplot.com website.