Light emitting diodes (LEDs) are the perfect electronic transducer. They convert electric current into light with typically a 10%-30% efficiency, and can respond in sub-microsecond time scales. Their brightness and efficiency is why they have basically become the standard for lighting applications. They’ve already taken over the flashlight and portable application space, and as their price goes down, will continue to take over more of the residential light bulb application space as well.
However, if all we do with an LED is use it for steady, dull, boring illumination, we are leaving so much of their performance on the table. Instead, why not take advantage of their ability to quickly respond to a changing current, and modulate their drive current to turn your room into a responsive environment?
In this article, I’m going to show you how to make any LED dance to the small randomly unstable air currents that make candles flicker. The technique can be applied to turn ANY environmentally-sensed input into an LED’s or light bulb’s brightness.
The usual 10 mA current levels recommended for LEDs just aren’t bright enough for me, however. I want brighter. How bright, you ask? As my buddy, Frank Schonig says, “A lot is good, more is better, and too much is just right.” I’ll show you how to modulate a current source right up to the limits of “too much.”
The Basic Architecture for this Project
There are lots of ways of turning a sensor’s signal into an LED’s light output. In this project, I chose to use an Arduino as the go-between because I wanted a general approach, and know I can add additional scaling and adjustments to the sensor signal using a little bit of code running in the Arduino. As good as I am in analog circuit design, I know I can get to the final performance I want faster and easier with the advantage of some digital signal processing.
The architecture of the system I wanted to implement — which I think is a good template for many applications — is shown in Figure 1.
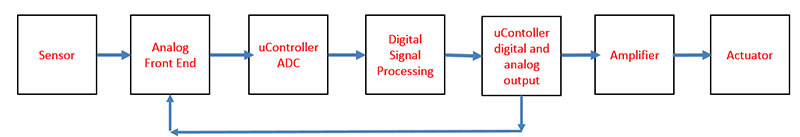
Figure 1. Flow diagram of the system implemented in this project, which can be used for many similar applications.
The start is the sensor which is picking up a particular quality in the environment and turning it into an electrical feature: a current, voltage, or resistance.
The interface between the sensor and the Arduino is the Analog Front End (AFE) that turns the sensor response into a high level voltage signal the Arduino’s Analog-to-Digital Converter (ADC) can read. This is usually some combination of resistors, voltage bias, op-amps, and instrumentation amplifiers.
Once the digital signal is in the Arduino through its ADC, we can apply the power of math with digital signal processing to turn these bits into the appropriate Pulse Width Modulated (PWM) voltage signal that will drive adjustable current through the LED. There is a limit to the output current of an Arduino pin. If we need more current, we can use a current booster. This can be as simple as a transistor follower circuit.
To illustrate how to implement each section, I’ll walk you through three examples which go from simple to more complex:
- Example #1: Internally generated sine wave signal and Arduino limited LED brightness.
- Example #2: Pushing the ultimate current limits to an LED.
- Example #3: Modulating the LED brightness with an air current sensor.
Example #1: Modulating an LED’s Brightness: The Quick and Simple
In this first example, we’re going to modulate an LED’s brightness with a simple math function generated inside an Arduino. I chose to use a sine wave as the example. If you can describe the function as an intensity vs. time, you can use it to modulate the LED or any other light source.
Every sine wave has just three terms that characterize it: the amplitude, frequency, and phase. The phase just says where in the cycle we start the sine wave. To make it easy, we’ll use a phase of 0. Then, it’s just the amplitude (A) and frequency (f) we need to define.
Sine waves are bipolar, rising equally above zero and below zero in magnitude. Figure 2 shows the calculated sine wave signal with an amplitude of one and a frequency of 1 Hz.

Figure 2. Example of the magnitude of a sine wave with an amplitude of one and frequency of 1 Hz, showing the signal going above and below zero.
The pattern repeats every 1 sec, so its frequency is one cycle per second — or 1 Hz — in this example. We have to modify this sine wave slightly to use it to modulate an LED. While the sine wave magnitude drops below zero, an LED’s light intensity cannot. Its lowest value is 0. We’re going to shift the sine wave up so it extends between 0 to the peak value, A. The sine wave function for an intensity [I(t)] is:
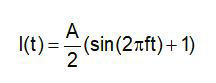
The factor of 1/2 at the beginning scales the sine wave so that its maximum value is A/2 x 2 = A.
This is literally the equation we will use in the Arduino sketch to modulate the LED. This will be the analog voltage output to the Arduino Digital-to-Analog Converter (DAC) pin which will drive the LED.
Analog Output Signals and the Arduino
The Arduino and many other microcontrollers don’t really have an analog output signal. Instead, they have a PWM signal. In the Arduino, it's a 500 Hz digital signal with a duty cycle that is modulated. The average of the modulated signal is the analog voltage.
When the analogWrite value is set to a high level, the duty cycle is nearly 100%. When set to a small value, the duty cycle is close to zero. Figure 3 shows the measured PWM output voltages on pin 3 for an output level that is a 4.5V/90% duty cycle and a 0.5V/10% duty cycle signal.
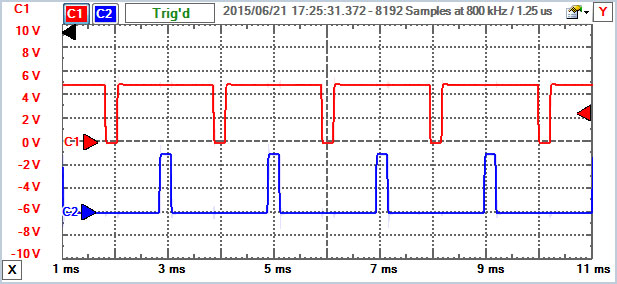
Figure 3. Measured output voltage of two PWM signals. Top: set for 4.5V output. Bottom: for 0.5V signal. The frequencies are the same 500 Hz, or a period of 2 msec. The duty cycle of each signal is adjusted to control the average value.
Not all the Arduino pins can be used for PWM output. On my RedBoard from SparkFun, the PWM pins are identified with a “~” (tilde) symbol written right on the board. A close-up of my board is shown in Figure 4.

Figure 4. Close-up of the RedBoard from SparkFun showing the PWM capable digital I/O pins marked with the “~” symbol on the right side of the board.
On this RedBoard, digital pins 3, 5, 6, 9, 10, and 11 are capable of PWM.
To use pin 3 as an analog output, we need to set up the pin in the void setup() function, using pinMode(3,OUTPUT);, for example. Then, in the section of code to output the analog voltage, we use the line analogWrite(3, 125); where the number 125 is an example of an integer from 0 to 255 — an eight-bit number.
Normally, if we wanted a true analog signal from a PWM pin, we would have to add some sort of RC circuit to integrate the pulses and turn it into an averaged nearly DC signal. When driving an LED, however, the PWM signal is ideal. Our eyes do the averaging. We can’t resolve the 500 Hz pulses unless we move our eyes around very fast. Then, we see the pulses of light in our after-image.
This is one way of telling if a car’s lights are LEDs or a light bulb. Next time you're behind a car at night, move your eyes around quickly and look for a train of pulses or a solid line in the wake of the light source. The typical recommendation for hooking up an LED to an Arduino pin is to use a 330 ohm resistor in series. For this initial example, we’ll follow this simple recommendation.
All the code that runs in the void loop() to drive the LED with a sine wave modulation is shown in Figure 5; the close-up of the whole circuit is shown in Figure 6.
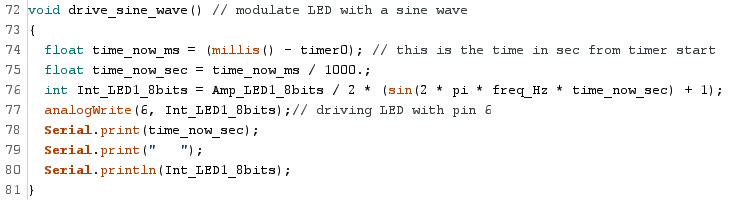
Figure 5. Code snippet which generates the sine wave signal and outputs to the PWM pin 6. This function is called in the void loop() routine to drive the LED with a sine wave. The serial print commands are there for debug.
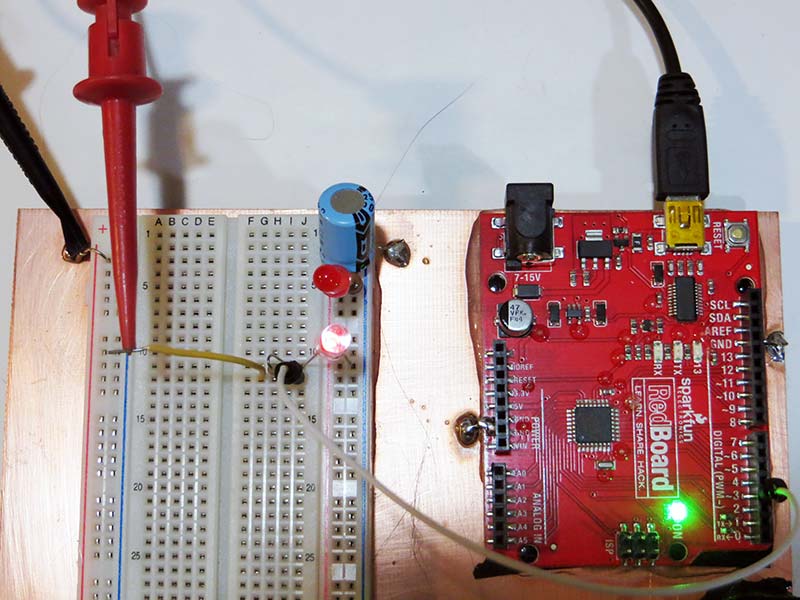
Figure 6. Close-up of my Arduino circuit with the LED connected to pin 3 with a 330 ohm resistor. The clip lead is connecting the voltage from pin 3 to the scope.
When the code runs, a 1 Hz sine wave with a peak-to-peak value from 0 to 255 with eight-bit steps is written to the PWM pin. The actual eight-bit number written to the pin was also printed to the serial port; I used MakerPlot to plot this number just to verify the signal. Figure 7 shows the plot of this value over time.
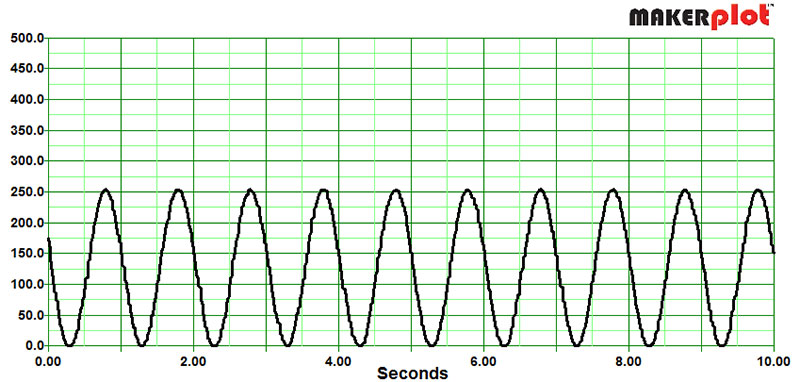
Figure 7. Plot of the eight-bit value written to the PWM pin and to the serial port, and displayed using MakerPlot.
Example 2: Driving the LED with “a lot of Current”
If you read the spec sheets for most LEDs, they say use 10 mA of drive current and do not exceed 20 mA. Really? How much current can we really put through an LED, and how do we do it?
An LED behaves like a really low resistance circuit element but with a constant voltage drop across it. Depending on the LED’s color, this voltage drop varies from about 1.6V to 3.5V. For a red LED, it’s about 2V with any current more than 10 mA through it.
This means that the current through an LED is not so much about the LED, but about the rest of the circuit it is in. When connected to the output pin of an Arduino, the equivalent circuit looks like the one in Figure 8.
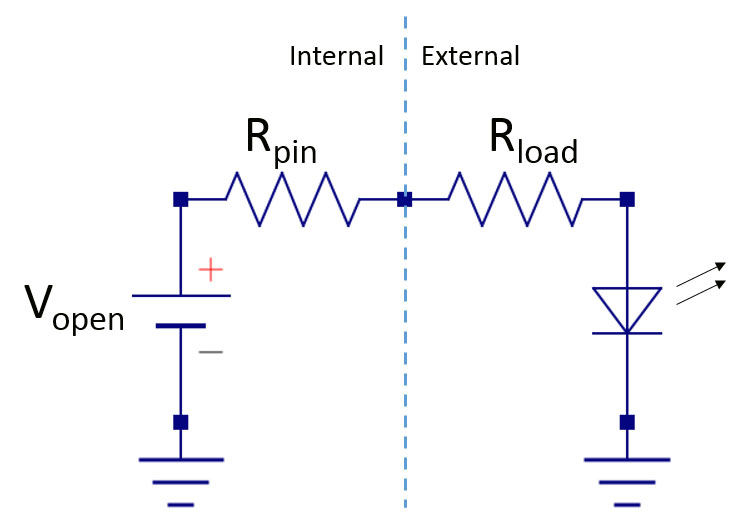
Figure 8. Equivalent circuit model of an LED connected to the output of an Arduino pin. Note the resistor modeling the output impedance of the Arduino driver pin and the load resistor we add to the circuit.
From this, we can calculate the current in the whole circuit and through the LED:
Vopen = IRpin + IRload + VLED and
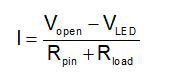
Let’s put in some numbers to see the special cases. For a red LED, we’ll use 2V as the LED voltage drop. I’ve measured the output impedance of an Arduino pin as about 25 ohms. The open circuit voltage of a pin with nothing attached is about 5V. When we use a 330 ohm load resistor, the current through the LED is:
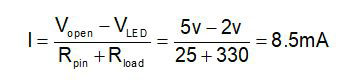
This is close to the 10 mA typical value suggested and why 330 ohms is often recommended. The ultimate limit to the current we can get out of an Arduino pin is if we didn’t use any load resistor at all. We’ll still have the 25 ohm output impedance of the pin electronics to limit the current. Let’s see how much current we’d get if we did not use the 330 ohm resistor:
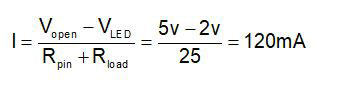
This sounds like a lot — and it is — compared to the spec sheets. Just to verify, I was really getting 120 mA from the Arduino pin. I added a one ohm series resistor to the LED and measured the voltage across it. I measured about 100 mV across a one ohm resistor, so there was 100 mA of current through it. This is slightly lower than our estimate because the voltage drop across the LED is a little higher than 2V, and the output impedance of this Arduino pin is probably slighter higher than 25 ohms.
The spec sheet for the Arduino Uno says the maximum current draw per pin is 40 mA, with 200 mA as the maximum total current draw for all the pins. This is just the safe recommended limit. Each pin can source more current than the specified value, but we run the risk of damaging the Arduino.
With 100 mA through our LED, it’s pretty bright. A lot is good, but more could be better. To drive the LED with more current, we need a current booster circuit.
A Current Boost Circuit: “More is Better”
There are a number of ways of driving more current from a fixed current source. The simplest one I chose is a transistor follower circuit with the LED between the Vcc power source and the collector of the transistor. This circuit is shown in Figure 9.
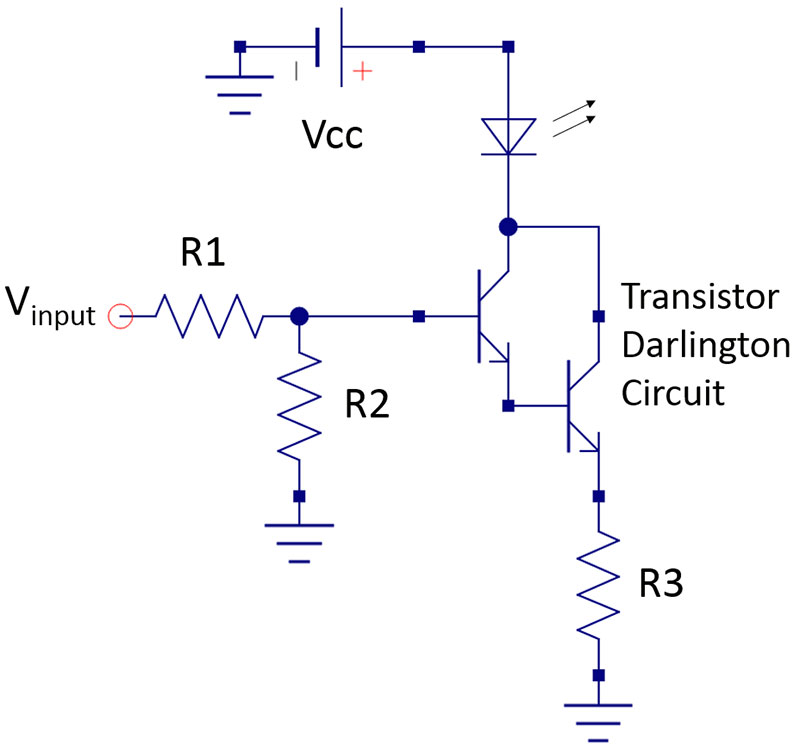
Figure 9. Current boost circuit to drive as much current as I could ever want.
A transistor is a current amplifier. The current flowing from the collector to the emitter is a factor times the current into the base. This factor is usually designated as h or hFE. For the TIP31B transistor I'm using, the value of h is a minimum of 25, but could be as high as 100. This gain was a little smaller than I wanted but I had plenty of the TIP31B transistors lying around, so I decided to use them in a Darlington configuration which is shown in the circuit.
The current gain of these transistors in series is the product of the gain of each one. In this circuit, the current into the base is amplified by at least 25 x 25 = 625. This transistor is rated for 3A DC current. I figured the LED would burn out long before the transistor would. In this circuit — called a follower circuit — the current through the transistor from the collector to the emitter and through the LED will automatically adjust to keep the emitter voltage plus the base-emitter diode drop voltage to be the base voltage.
The first two resistors, R1 and R2, act as a voltage divider. The output voltage from the Arduino pin is always an amplitude of 5V. It’s the duty cycle that is modulated. I wanted to make the maximum voltage into the transistor’s base adjustable to limit the maximum current through the LED. The current through the transistors will automatically change so that the voltage across the base is the two diode drops of the two base-to-emitter junctions, in series with the IR drop across resistor R3:
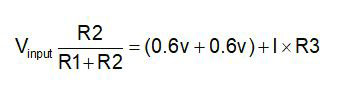
We can use this to determine what load resistor to use based on the maximum current we want to reach:
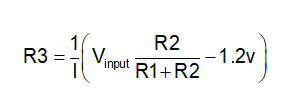
If we want the maximum current to be 0.5A, when the voltage divider is set to the maximum voltage so R1 is nearly 0 and the output voltage is 5V from the pin, the load resistor, R3, should be about:
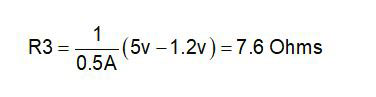
I used a 10 ohm resistor because I had one laying around. Whenever we use low resistance and 5V, we always want to pay attention to the power consumption to make sure we won’t generate smoke, unless that’s our intent. In the worst case — with 0.5A through the 10 ohm resistor — the power consumption will be:
P = 12R = 0.52 x 10 ohms = 2.5 watts
I only had a half watt resistor. This meant there was the potential for the resistor to get very hot and maybe smoke. I had to watch out for this. Of course, I expected my LED to die long before I got to 0.5A. When an LED dies, it usually dies as an open, so it would limit the current.
The last estimate we need to do is for the resistor divider to scale the Arduino’s output signal into a maximum current. If we really want 0.5A through the transistor and we have a current gain of only 625, then we need to supply at least 0.5A/625 = 0.8 mA of current into the base of the transistor. With a 5V source, the resistance of the voltage divider would have to be no more than R < 5V/0.8 mA = 6K ohms. No problem. To provide easy adjustment, I used a 1K pot. A 10K pot would probably have worked just as well.
Finally, I had a 9V switched mode power supply (SMPS) from SparkFun which was able to supply 1A of current at 9V. I used this to power the Arduino and picked off this voltage to power the LED. Figure 10 shows the setup capable of driving 0.5A of modulated current through my LED.
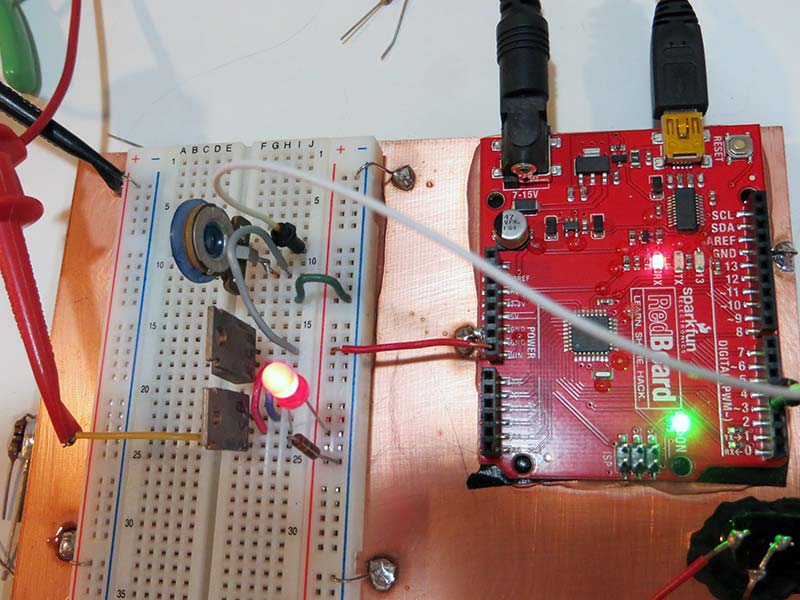
Figure 10. The setup using my Darlington current booster driving an LED from an Arduino pin.
Just How Much is “Too Much?”
By adjusting the 1K pot, I could adjust the maximum voltage across the base of the Darlington, which adjusted the maximum current through the LED as the Arduino produced the PWM sine wave signal which modulated the LED. As I cranked up the maximum input voltage to the transistor’s base, I monitored the peak voltage across the 10 ohm resistor with my scope. This voltage is a direct measure of the current through the LED.
At 160 mA of current (1.6V across the 10 ohm resistor), the red LED I was using started to not turn off completely at the bottom of the sine wave cycle. This was probably some thermal effect in the LED. At 200 mA, the LED was mostly on and did not turn off at all at the bottom of the cycle. Plus, it was a bit warm to the touch.
Using an ultra-bright red LED and 160 mA of current, the LED was too bright to look at directly. After the after-image cleared, I cranked the current up. Beyond 200 mA, the intensity seemed to drop, and the LED was warm to the touch.
I also tried a bright white LED. One of the cool features of this current boost circuit is that it has plenty of voltage head room to drive any color LED — no matter what its forward voltage drop. At 150 mA of peak current, the white LED was brilliant. At 200 mA, it began to fade and the fade was irreversible. I damaged the LED.
This exercise defines the limits to driving most LEDs in a near steady state. The maximum brightness is with about 150 mA of current, and 200 mA is too much and will damage the LED. For most LEDs, the current limit is really set by a thermal limit.
Running an LED at 200 mA with a 2V forward voltage drop is a power consumption of 2V x 0.2A = 0.4 watts. This is dissipated in a very small volume and thermally insulated from the outside in its plastic housing. It’s easy to imagine the diode getting too hot and being thermally destroyed. If all I wanted was pulses — like for a strobe — I could probably get away with more current if it lasted for a short time. However, I was going to run this LED as mostly steady on for long periods.
Even running at 150 mA, I am severely decreasing the lifetime of the LED, but like Achilles, I’d rather my LED have a short but bright and glorious life, than a long life at a dull intensity. To make my life easier, I decided to run at 150 mA and use a socket for the LED, so I could easily replace it should the need arise.
Example 3: Dancing to Thermal Fluctuations
The original idea I had for this project was to modulate an LED with small air currents and have it behave like an electronic candle. The perfect air current sensor is a warm thermistor which is self-heating by its own current. I’ve used this in many similar sensor applications.
The resistance of most conductors increases with temperature. This is fundamentally related to the scattering of the electrons by the vibrations of the crystal lattice of the metal. The higher the temperature, the more the lattice vibrates, the more the electrons are scattered, and the higher the resistance. For copper, the resistance increases about 0.4% per °C. This is called the temperature coefficient of resistance (TCR). It is positive in most metals.
In conductive ceramic materials, the TCR is negative. Increasing the temperature decreases the resistance. They are called negative temperature coefficient (NTC) materials. In these materials, the number of conductors released into the material increases with temperature. At higher temperatures, the material becomes more conductive. The resistance and temperature is highly nonlinear, so we don’t often use a TCR value, but can easily see 100% changes over ambient temperature ranges. These make excellent temperature sensors.
My idea was to use a very small size “bead” type thermistor with a fast response time which I could heat above ambient. As small air currents cooled it, its temperature would decrease and its resistance would change. I would modulate the LED’s current based on the resistance of the thermistor. An example of a suitable thermistor is the MF52 series from Cantherm (a Canadian company)
The original idea was to use a simple voltage divider circuit with the thermistor as one leg of the divider. I already had a 9V supply in the system. This would be plenty to power the thermistor. The power dissipation in a resistor is V^2/R. For at least 0.1 watts of power in the thermistor, to get it warm I would need no higher than a 1K ohm thermistor.
One danger to watch out for is just attaching the thermistor across a constant voltage supply. The current through it would heat it up. With its negative temperature coefficient, its resistance would decrease and more current would flow through it. It would then dissipate more power and get hotter. Its resistance would drop and the current would increase and ... you get the idea. This is called thermal runaway.
To avoid this problem, I added a series resistor to create a voltage divider. This enables a simple way of measuring the resistance of the thermistor and limiting the current to prevent thermal runaway. Figure 11 is the final schematic I settled on.
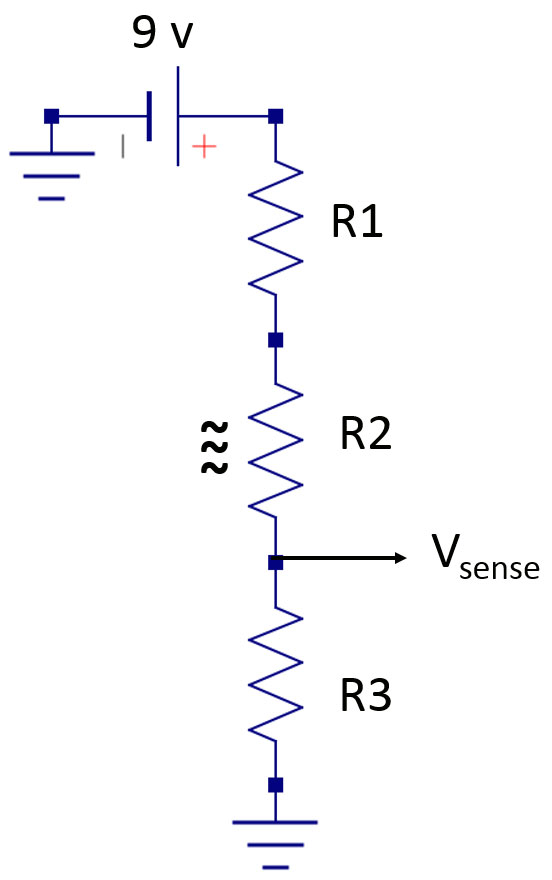
Figure 11. Schematic of the thermistor biasing circuit. R1 is 50 ohms, R2 is the thermistor, and R3 is the 100 ohm sense resistor.
The thermistor is a small bead on the end of very fine wires. This helps to thermally isolate the sensing element. Figure 12 is a close-up of the thermistor soldered to copper wires, and the other resistors in the protoboard I used to assemble the entire circuit.
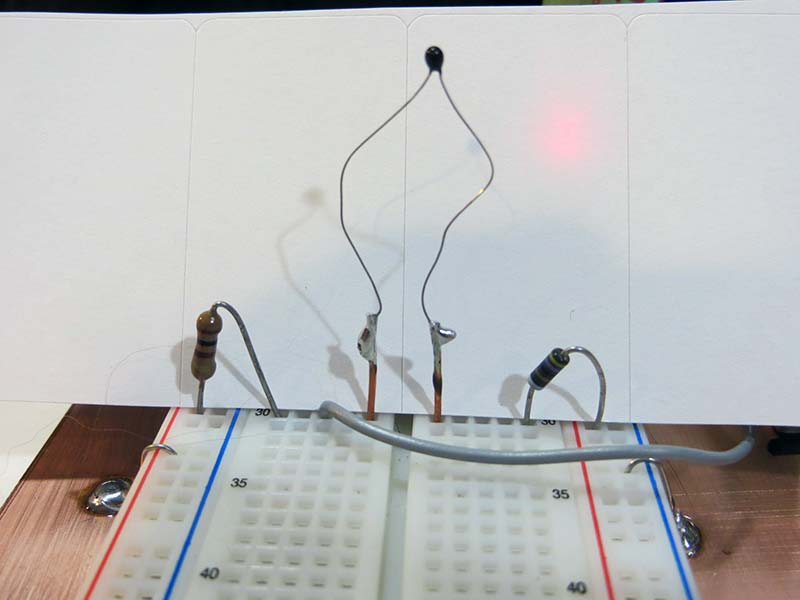
Figure 12. Close-up of the bead thermistor with its very fine wires soldered to copper leads mounted in the protoboard with the two bias resistors.
When I first tried the thermistor — which had a nominal resistance of 1K ohm at low current — I thought a 1K resistor would be an ideal sense resistor. However, when I connected this circuit, the thermistor went into a thermal runaway and its resistance dropped to nearly 200 ohms. I finally settled on a 100 ohm sense resistor. Using the 9V supply to bias the thermistor would have resulted in a nominal voltage of about 4.5V on the sense resistor. I wanted this closer to 2.5V — the sweet spot for the Arduino’s ADC.
The final circuit used a 100 ohm sense resistor and a 50 ohm resistor to shift the nominal sense voltage closer to 2.5V. This means the total resistance in the path is about 250 ohms. The current draw through the thermistor was 9V/250 ohms = 36 mA. With this current, the power dissipation in the thermistor is I^2 x R = 0.035^2 x 100 ohms = 125 mW. This power is enough to heat the tiny bead thermistor to be hot to the touch. This is exactly what I wanted.
The slightest air motion is enough to cool the tiny bead thermistor and lower its temperature. This increases its resistance, and the total current in the circuit decreases. The voltage across the sense resistor will also decrease. Figure 13 is a scope trace of the voltage on the sense resistor in still air and then when I touched the thermistor to cool it down.
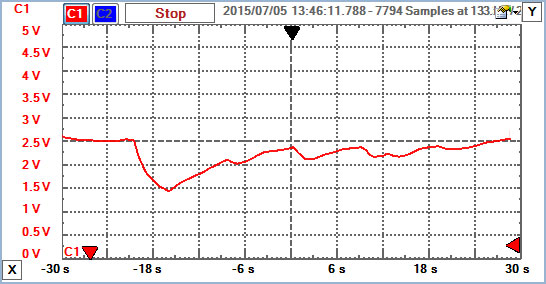
Figure 13. Scope recording over a one minute period of the voltage across the sense resistor when the thermistor was touched, cooling it and lowering its temperature. This shows the range of the voltage signal spanning 1V.
In this example, we can see the maximum voltage range of the sense resistor spanning about 1V. This is well inside the range of the ADC.
The real fluctuations from tiny air movements are very small. Figure 14 shows the measured voltage across the sense resistor from still air motions cooling the thermistor, which are less than 100 mV in extent.
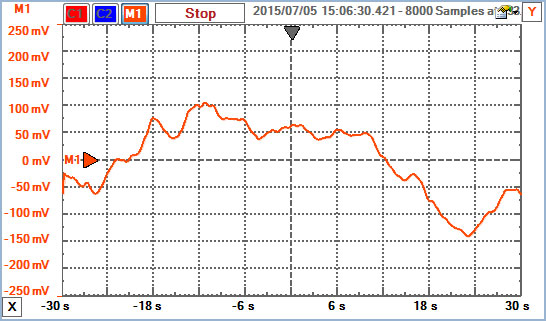
Figure 14. Measured voltage across the sense resistor in still ambient air, showing variations on the order of 50 mV. This is the sort of fluctuations that will emulate a candle flicker, and will be used to drive the LEDs.
The challenge left is to turn the small fluctuations into a large enough signal to drive the LED so it mimics the flickering of a candle.
A Little Digital Signal Processing
I needed to turn these small voltage fluctuations into higher level signals to drive the LED current. I experimented with an AD623 instrumentation amplifier front end. This worked really well. I could amplify these low level signals into any range I wanted.
However, the dynamic range of the signal was a 1V variation. If I used a gain of more than five, I ran the risk of saturating the output signal.
If I used another Arduino DAC pin to create an offset voltage which I could adjust, I could always change the offset voltage so the difference signal was in range. I built all this up and it worked just fine, and then realized there was a simpler way.
These 50 mV sensor fluctuations I wanted to be sensitive to are just in the range that can be resolved with a 10-bit ADC. The resolution of a 0V to 5V 10-bit ADC is 5 mV.
Even though the instrumentation amplifier AFE gave me unlimited headroom, I decided to go for a straight up digital signal processing solution. I wanted to use only the fluctuations of the sense resistor voltage to drive the LED. Yet again, if I just took a scaled version of the fluctuations, I would quickly reach the voltage limit of the DAC and saturate the LED.
So, I used a trick of re-establishing the baseline. I initially measure the voltage on the sense resistor. This is stored as a reference value and subtracted from every consecutive value. This difference is scaled by a factor and then centered about an offset value. This signal is then used to drive the LED intensity.
However, I also monitor the voltage level to the LED. If it's close to saturation and exceeds a predefined limit — either too high or too low — I take another reading on the baseline and re-center the LED drive voltage. This continually shifts the LED drive voltage so it's always in range, and allows any scale factor or sensitivity. Figure 15 is the code snippet which executes this simple algorithm.
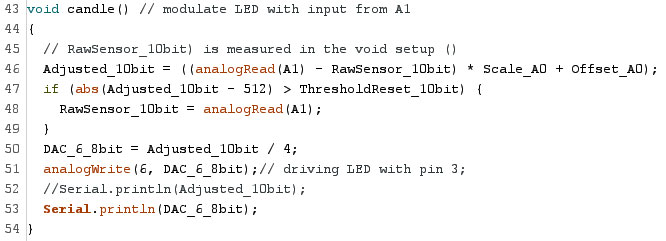
Figure 15. Code snippet to re-center the LED signal each time it exceeds a pre-set threshold.
Nominally, I wanted the roughly 100 mV of sensor excursion to be mapped into a 0V to 5V output signal. This is a scale factor of about 50. I experimented with different scale factors and found a value of from 30 to 50 seemed to give the electronic candle its most realistic performance. Figure 16 is an example of the typical signal which drives the LED when the sensor is in still air. This is the eight-bit signal that is written to the PWM pin.
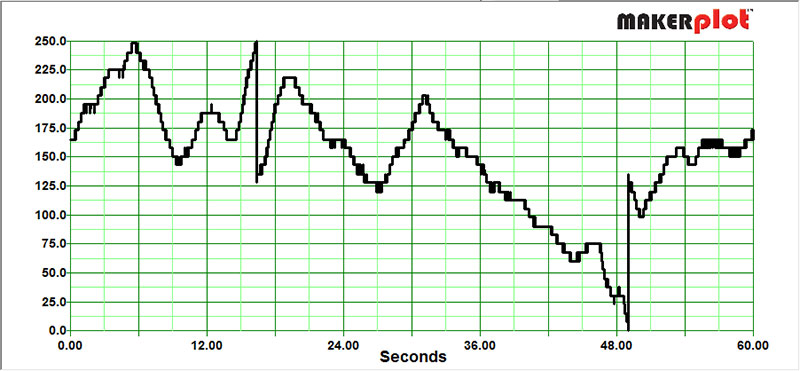
Figure 16. Plot of the eight-bit signal to the PWM pin that drives the LED when the thermistor was sitting in ambient still air. The fluctuations in slight air movement from the hot thermistor drive the LED signal. Note the re-centering happening at 17 seconds, when the voltage exceeded the upper threshold, and at 49 seconds when the signal exceeded the lower threshold.
I also wrote this value to the serial port and used MakerPlot to plot this data.
With a scale factor of 30, the 250-bit range corresponded to about 5V/30 = 167 mV. When I touched the thermistor, the voltage could change by as much as 1V, which is actually 12 re-centering operations. Figure 17 shows the signal to the LED when I touched the thermistor.
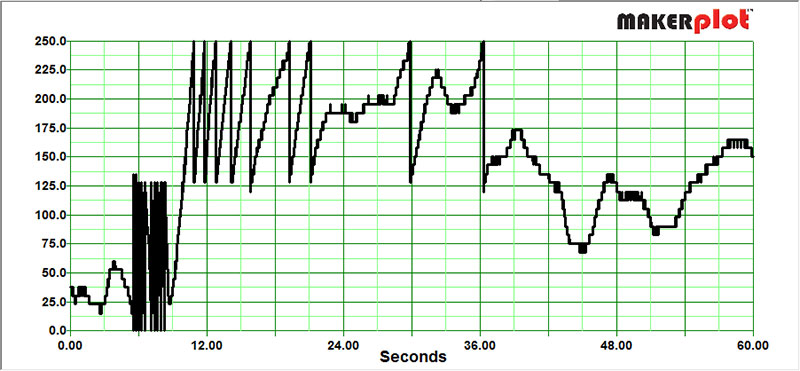
Figure 17. Recording of the eight-bit signal to drive the LED using MakerPlot, when the thermistor was touched and rapidly cooled, and then allowed to warm up. Note the rapid re-centering of the processed signal to the low side and then to the high side, to reach a more steady value.
There were about 10 very rapid re-centerings as it cooled to my touch, and then about eight re-centerings in the upward direction as it warmed back up. These very nicely emulated the rapid flickering of a real candle.
This simple algorithm of high gain to capture the fluctuations and an auto re-centering of the signal gave my electronic candle the flickering characteristics of a real flame. I could gently blow in the direction of the thermistor and watch the LED flicker as the sensor cooled and then warmed back up.
In steady air, the self-heating of the sensor generated its own convection air currents and always kept the light flickering with a slow and seemingly random pattern just like a regular candle.
An Even Better Solution
I set out to build an electronic version of a candle that would respond to the gentle fluctuations of air currents, and modulate an LED to emulate the hypnotic allure of a fluctuating flame. I found that a self-heated thermistor is the perfect sensor, and the Arduino has just barely enough sensitivity in its ADC to take the small voltage fluctuations from the sensor and scale them into the range which makes an LED behave like a candle. A simple algorithm always keeps the LED signal in range and adds the feature of rapid flicker.
Along the way, I found a simple circuit which boosts the low current from an Arduino PWM pin to enable me to drive as much current as I could ever want. I originally thought this would be great for driving an LED. However, the circuit and system works for any current driven light source that doesn’t need more than about 4V of bias.
Even though I am enamored with LEDs, for this application I found a simple incandescent light bulb gave an even more dramatic effect. With this 9V SMPS, I was limited to using a light bulb that took less than 4V to turn on. Just replacing the 9V supply for a 15V supply allowed me to use a 6V night light bulb. This is one of the advantages of this specific current boost circuit, with the light source between the voltage source and the transistor’s collector.
In the circuit, the light bulb fluctuates as though it were a real candle. It flickers and responds to the subtle air currents around it. In a small dark room, the flickering of the light bulb really does look exactly like an electronic candle. NV
Downloads
What’s in the ZIP?
DriveLED_candle_noAFE.ino