Two important elements for good growth are moisture and light. The Plant Monitor Kit monitors both, and alerts you to when one or the other is less than optimal. In the end, we can’t guarantee a thriving plant with this kit, but at least you’ll have a better than fighting chance for growing it successfully.
Kit Description
The Plant Monitor Kit created by TinyCircuits (www.tinycircuits.com) and available in the Nuts & Volts Webstore here is composed of two separate elements: hardware and software. First, the hardware.
The hardware consists of TinyShields (tiny circuit boards), Wirelings (even tinier boards), and assorted cables. In Figure 1, the block diagram details each one in the kit and how it relates to the overall system.
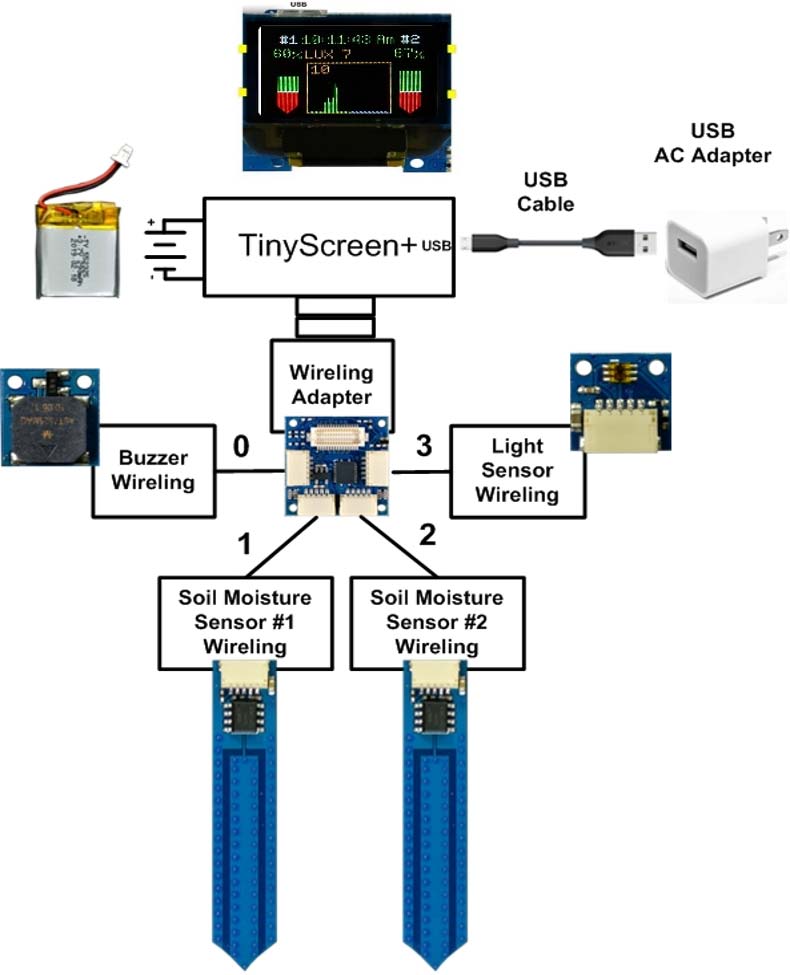
Figure 1 – Block diagram for the Plant Monitor Kit.
The TinyScreen+ with OLED and Wireling adapter shields are joined with mating connectors. The other interconnecting lines between the major blocks are the five-wire cables that allow everything to be attached together without soldering (with five-pin connectors). The numbers on the block diagram (0, 1, 2, and 3) indicate the Wireling adapter ports.
Next comes the software.
The software or — more specifically — the firmware is written in Arduino’s version of C++. Since we encourage you to view what goes on inside the TinyScreen+ processor, you’re free to modify the code to your desires. After all, it’s your kit. It’s also included in the downloads with this article.
Portions of the firmware (specifically the important variables) are listed in the sidebar Changing Variables in Code for you to modify to your needs. You can then recompile the code and load it in.
The OLED Screen
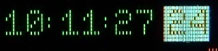
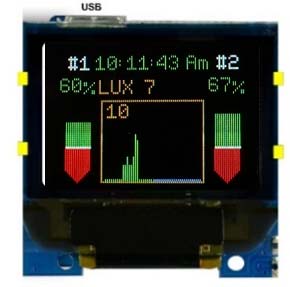
Perhaps the most striking feature of the Plant Monitor Kit is the OLED screen (Figure 2), which is the top part of the TinyScreen+ TinyShield.
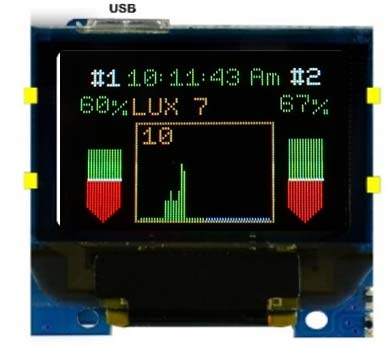
Figure 2 – OLED screen display.
Among other things, it gives the kit the color graphic features that makes understanding what’s happening to your plant a simple matter.
Compare these graphics to just seeing numbers. If there’s a problem with the soil moisture or light, the OLED display visually alerts you to it with colors and plots that beat simple numbers, including flashing warnings when things aren’t up to par. Plus, there’s the buzzer that sounds to make you aware of “minimum conditions” as well. But we digress.
The OLED is a 96 H x 64 V 16-color pixel display in a one square inch package. It also has four buttons (two on each side) that allow you to change the time as well as the soil moisture limit and lux plot range. Then, there’s the power slider switch, which is also on the side.
The Other Components
At the heart of the Plant Monitor Kit are the two moisture sensor Wirelings (Figure 3).
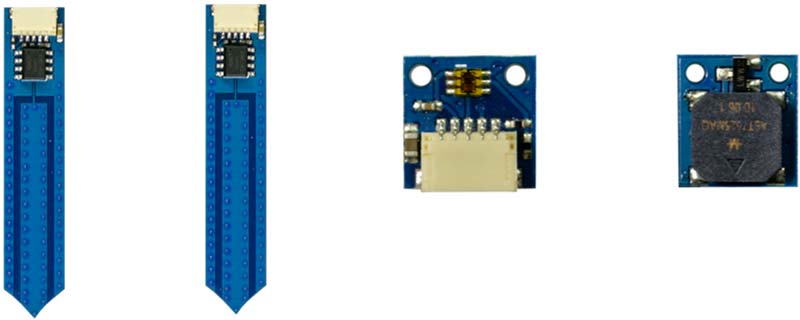
Figure 3 – Wireling sensors.
They both feature an ATtiny25, a high performance/low-power AVR eight-bit controller, and moisture is detected using capacitance to measure the dielectric permittivity of the surrounding medium (a.k.a., dirt).
Again, your kit comes with two of them: one for each plant you want to monitor or both for a large potted plant. When inserted into the dirt, the ATtiny25 micro detects and transfers the surrounding moisture level to the TinyScreen+ processor using the I2C protocol via the Wireling adapter TinyShield.
It also comes with a five-pin connector that connects to the main unit’s Wireling adapter with no soldering.
Next comes the ambient light sensor Wireling that uses the TSL2572 chip that detects the light coming to the plants (Figure 3 again). It’s all packaged on a small 10x10 mm board with the standard five-pin Wireling connector on it. And, of course, you get the connecting cable as well.
Light — both indoor and sunlight — are measured in “lux” which can vary quite a bit from single digits in very low light (0-9 lux) to thousands (1,000+) in direct sunlight. So, we give you the ability to adjust the lux plot to match the light that strikes your plant.
A buzzer alerts you to any problems with your plant’s health and well-being. It generates three separate tones: one beep at 2,700 Hz for moisture sensor #1; two beeps at 3,000 Hz for moisture sensor #2; and three beeps at 3,300 Hz if the light levels are below minimums.
To find out what’s really going on, simply view the OLED screen to see exactly what’s up; you’ll see “red” when things aren’t right.
Moving up the electronic food chain, we have the Wireling adapter board that connects all these external sensors to it by way of the supplied five-pin connectors (Figure 4).
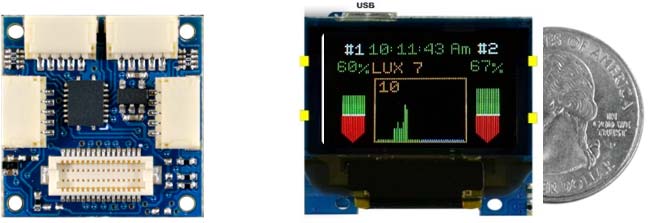
Figure 4 – Wireling adapter and TinyScreen+.
The Wireling adapter then plugs into the TinyScreen+ Tinyshield that features an Atmel SAMD21 32-bit ARM processor (the same one used in the Arduino Zero) running at 48 MHz with 256K Flash, 32K RAM, a USB port, a real time clock (RTC), power management, battery charger and, at the top, a 16-color 96 H x 64 V pixel OLED screen all packaged into one square inch.
To keep the battery charged, simply plug in the supplied USB cable to a USB wall adapter (Figure 5) that’s available nearly anywhere (not supplied).
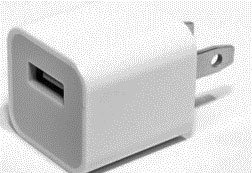
Figure 5 – USB AC adapter (not supplied).
You probably have some laying around for your smartphones; they’ll work fine. If you’re worried about power failure, a LiPo battery keeps the RTC at the right time even when the USB wall adapter is out of its socket (up to a few hours, that is).
Just plug the battery into the connector on back of the TinyScreen+ TinyShield as no soldering or wire cutting is needed.
NOTE: There is NO separate battery backup for the RTC, so you’ll always need to keep the main LiPo battery charged with the USB wall adapter.
How It Works
While it won’t water your plants for you just yet (at least this version won’t), the Plant Monitor Kit still does the important work of letting you know how your plants are doing and what they need from you.
It starts with inserting the two moisture sensors into the dirt (refer back to Figure 1). Using a capacitive approach, these sensors report the relative moisture content of the soil to the TinyScreen+ microcontroller via the Wireling adapter using the I2C protocol.
Then comes another I2C input from the ambient light sensor that monitors the amount of light the plant receives. This sensor should always be facing towards the light for the best readings.
Finally, if something needs attention (like more water or light), the buzzer sounds between 4 pm and 5 pm: one beep for soil monitor #1; two beeps for soil monitor #2; and three beeps for low light.
All these peripheral devices (Wirelings) communicate via I2C protocol to the Wireling adapter shield that, in turn, communicates this combined information to and from the TinyScreen+ processor. All except the buzzer use I2C; instead, the buzzer simply uses a pin on the Wireling adapter shield to activate it if the sensor readings are below minimums.
Turning It On
On the side of the TinyScreen+ TinyShield, there’s a slider switch that turns power on and off. Simply slide the switch down to turn it on. The OLED screen will illuminate as in Figure 2.
Setting the Time
The first thing you want to do after you turn your unit on is to set the time. For this, you have two choices: Am/Pm or 24 hour time. While the unit has a battery, it’s not a dedicated battery backup for the clock. So, you’ll need to do this everytime you turn it on.
It’s simple, so here’s what to do:
- Setting starts with choosing Am/Pm or 24 hr format.

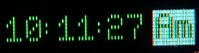
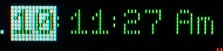
- Push the top right button; Am should be seen blinking.
- If you want Am, then push the top right button again to advance to hours.
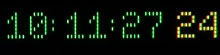
- Otherwise, push either the top left (+) or bottom left (-) button to select Pm or 24 as below


- Push the top right button again. The Am/Pm/24 are stored, and the hours blink once a second.
- Use the top left (+) or bottom left (-) buttons to adjust the hour if necessary.
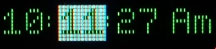
- Push the top right button again. Hours are stored and the minutes blink once a second.
- Use the top left (+) or bottom left (-) buttons to adjust the minutes if necessary.

- Push the top right button again. Minutes are stored and seconds blink once a second.
- Use the top left (+) or bottom left (-) buttons to adjust the seconds if necessary.
- Push the top right button again. The seconds value is stored.
- Finally, push the top right button again and the time display will “flash” indicating that it’s set.
- If you made a mistake, then simply repeat the procedure.
That’s it!
Remember, the time is NOT set until you see the white flash where the time is displayed. The white flash also gives you good visual feedback that you have set the time.
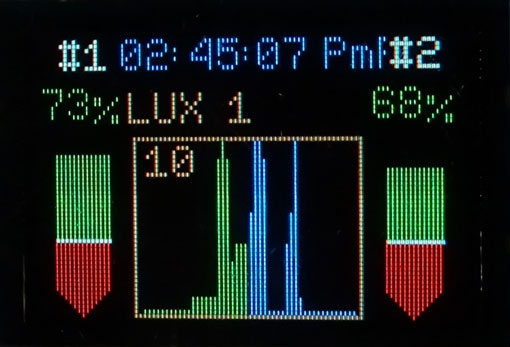
Changing the Soil Moisture Thresholds and Lux Range
- Push the bottom right button and a red rectangle begins flashing in the soil moisture #1 icon.
- Use the top left (+) or bottom left (-) buttons to adjust the white line up to 80% or down to 20%, or just leave it alone if you want it there.
- This image shows 00% for soil #1 moisture, but you can still move the white line if moisture is indicated in a red/green arrow (which is normal).
- Push the bottom right button again and a red rectangle begins flashing in the soil moisture #2 icon.
- Use the top left (+) or bottom left (-) buttons to adjust the white line up to 80% or down to 20%, or just leave it alone if you want it there.
- This image shows 5% moisture (see the small triangle tip at the bottom), but you can still move the white line if moisture is indicated in a red/green arrow (again, which is normal).
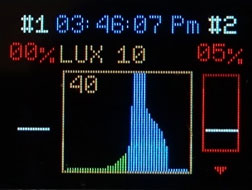
- Push the bottom right button a third time and a red rectangle begins flashing around the LUX plot area – the rectangle in the middle.
- Push the top left (+) or bottom left (-) buttons to adjust the lux plot range setting (the number in the upper-left corner) to match the level of lux you desire. The plot will adjust with every push of the + or – buttons and the lux range will change by 10 each time up or down; here, we set it to 10.
- Finally, push the bottom right button to escape this mode as shown here.

- In any of the above cases, you can just wait 10 seconds and the flashing red rectangles will disappear. When this happens, the mode is canceled.
Turning the Buzzer Off
The buzzer sounds between 4 Pm and 5 Pm – once every 10 seconds – to alert you to the following:
If either one of the soil moisture levels are below minimums, i.e., below the white line, the buzzer will sound. Also, if the total lux value for the day is below what it should be, the buzzer will also sound.
- One beep at 2,700 Hz for soil moisture #1.
- Two beeps at 3,000 Hz for soil moisture #2.
- Three beeps at 3,300 Hz for low lux levels.
To turn the buzzer off:
- Push the bottom right button once.
The soil #1 red rectangle should begin flashing, so let it flash until it stops (about 10 seconds — this is normal). The buzzer will remain off until the following day between 4 Pm and 5 Pm, and will remain permanently off if the soil or light conditions are fixed before then.
The OLED Screen Explained
Time
At the top of the OLED screen is the time display “in color” (Figure 2):
- Green — Between 12:00:00 am (midnight) and 11:59:59 am (one second before noon)
- Blue — Between 12:00:00 pm (noon) and 11:59:59 pm (one second before midnight)
- Yellow — All day for 24 hour time
- 00:00:00 (midnight)
- 06:00:00 (6 am)
- 12:00:00 (noon)
- 18:00:00 (6 pm)
- 23:59:59 (one second before midnight; rolls over to 00:00:00 as above)
There wasn’t room for the date, so it’s left out.
Soil Moisture #1 and #2
These icons look like the soil moisture Wirelings on either side of the screen. The horizontal white line divides the display into red (below the line) and green (above it). If either of the icons are “in the red” after 4 pm (16:00:00 military time), the buzzer will sound with one or two beeps depending on which one(s) are below minimums. The ones pictured here look okay.

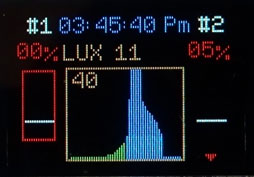
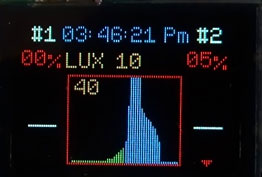
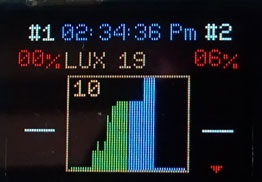
LUX Display
The LUX display is the rectangle in the middle between the soil icons.
The LUX value just above the rectangle always displays the real time LUX value that the sensor detects. It shows 11 here.
Inside the LUX rectangle is another number between 10 and 1000 that represents the top LUX value for the plot inside the rectangle. You can change this value from the default 10 lux (at turn-on) up to 1,000 lux in increments of 10. The above image shows 40.
Also, inside the rectangle, the LUX plot is displayed as a series of 48 vertical lines going from bottom to top or somewhere in between depending the LUX level. Each line represents the “average” of received lux for each 15 minute interval between 6 Am and 6 Pm – green for morning and blue for afternoon. Remember, this is the “average” value over 15 minutes and usually doesn’t reflect the “real time” lux value.
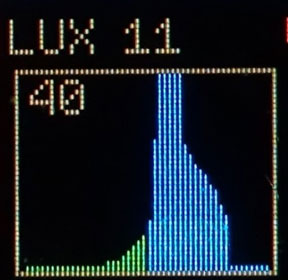
In the morning, there’s usually very little light, so the LUX value is normally single digits between 0 (no detectable light) to 9.
As the morning progresses into afternoon, the LUX value increases, and the resulting line plot may “clip” at the top as seen on the right.
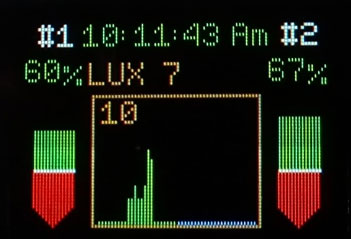
To see the entire LUX plot, simply push the bottom right button until the LUX rectangle flashes “red.” Then, push the top left (+) or bottom left (-) buttons to adjust the lux number in the upper-left corner (the one that says 10 now).
Again, this number inside the rectangle is the maximum lux value for the plot and the green/blue line plot will automatically adjust to it. Once again, the number above the rectangle is the real time lux value (19 in this case).
A new lux plot is generated every day between the hours of 6 Am and 6 Pm and it remains there for the entire evening. The lux plot is reset every morning one second before 6 am and a new plot is started.
If the total daily lux is below minimums after 4 pm, the buzzer will sound. The software adds up the total lux for the day and compares it against a fixed value in the firmware.
If it’s below this value, the buzzer will sound. You can only change this fixed value by digging into the code and changing it there. See the sidebar Changing Variables in Code for details on how to do so.
A Sunny/Rainy/Cloudy Day
Here’s a lux plot from a day where there were some significant interruptions to the light (lux) levels due to rain in the morning and afternoon, along with sun and clouds in between the showers. As you can see, the LUX line plots reflect this weather system perfectly.
By viewing the vertical line plots (green for morning and blue for afternoon), you can see when the sun was shining and also when clouds were blocking the sun.
Plastic Enclosure
Depending on the kit you purchase, it may come with its own plastic container that houses the TinyScreen+ and Wireling adapter (assembly and gluing required). All the electronics are contained in it, and it has slots on the sides to allow access to the four five-pin Wireling cables, ON/OFF switch, pushbuttons, and USB connector.
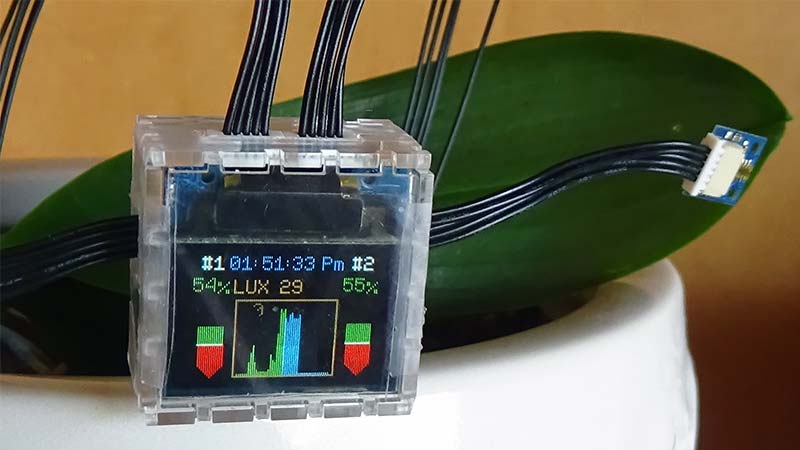
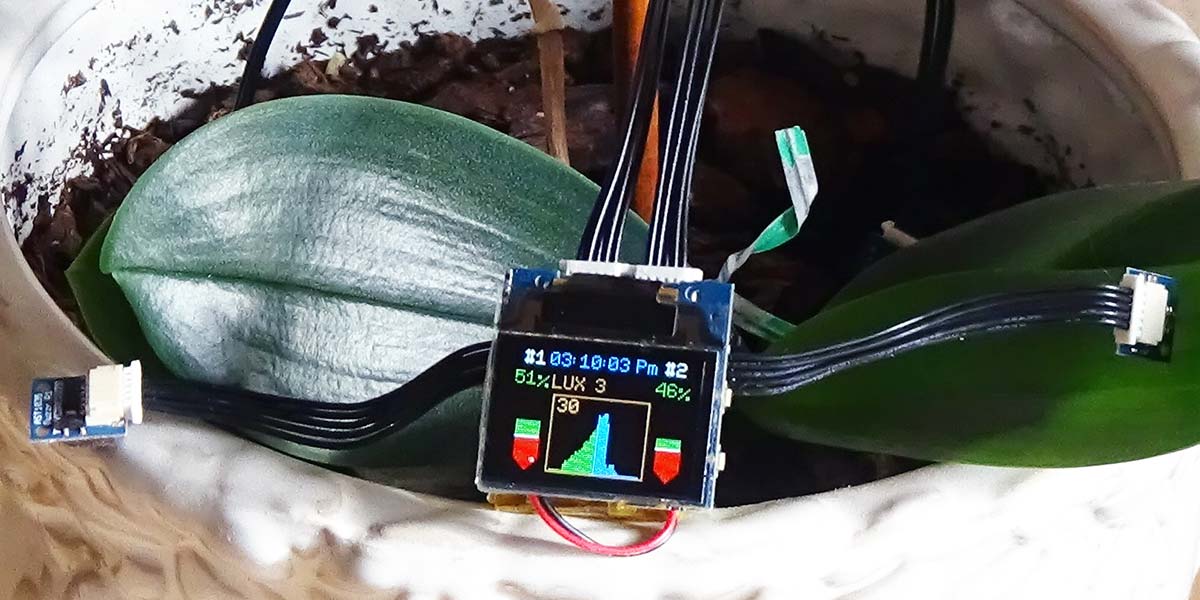
All together it makes for a rugged electronic package that you can place on the dirt or in the pot somewhere with the OLED facing up as shown here. The plastic enclosure assembly manual is included with the article downloads.
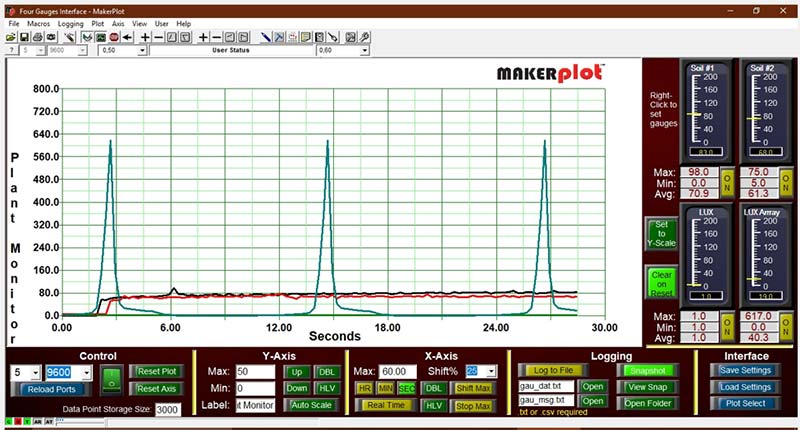
Plotting Data
If the USB port is connected to a computer, then you can see the real time soil moisture and lux data. There are basically two ways to do this: using a Terminal or Microsoft Excel program or MakerPlot (Windows only — sold separately in the Nuts & Volts store) that plots these values and also shows their values on meters.
The data output comes in four separate plots:
- Soil 1 moisture percent (0-99) — Black in MakerPlot
- Soil 2 moisture percent (0-99) — Red in MakerPlot
- Lux real time value (0 to 1,000+) — Green in MakerPlot
- Lux daily average plot — Blue in MakerPlot (the spikes)
Monitoring Your Plants via the Web
The logical extension to the Plant Monitor Kit is putting the data on the web. We’ve got you covered here (at least in hardware) with either the BLE TinyShield or the WiFi TinyShield (Figure 6).
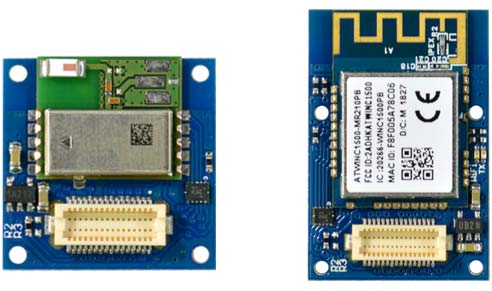
Figure 6 – BLE and Wi-Fi shields.
Just plug either one into the TinyScreen+ processor and Wireling adapter stack and you’re all set.
This is where your DIY skills come into play as you’ll need to create the Arduino code as well as an “app” for them. Let us know if you do so and (with your permission) we’ll feature it at www.tinycircuits.com so that others can learn from you.
NOTE: The plastic enclosure will not accommodate either the BLE or Wi-Fi TinyShields.
You can find the Plant Monitor Kit and the MakerPlot software in the Nuts & Volts webstore. NV
Changing Variables in Code
Here’s where to find the code variables that you can change. You can find them in the Arduino code under the following headings. Just changing these will affect the rest of the code, so you won’t have to hunt any further.
//---------------Buzzer Variables-----------------
const int lux_buzzer_min = 48*5; //lux_total must be greater than this to avoid the buzzer beeping - see update_buzzer()
const byte buzzer_start_time = 16; //24hr start time for buzzer if below minimums - set_limits()
const byte buzzer_stop_time = 17; //24hr stop time for buzzer if below minimums - set_limits()
//--------------Limit Variables---------------------
const int lux_top_plot_level_min = 10; //min top lux inside LUX rectangle
const int lux_top_plot_level_max = 1000; //max top lux inside LUX rectangle
const byte soil_moisture_limit_min = 20; //min and max soil_moisture_limit values for limit_lines
const byte soil_moisture_limit_max = 80;
Lux Defined
According to Wikipedia “The lux (symbol: lx) is the SI (System of Units) derived unit of illuminance, measuring luminous flux per unit area. It’s equal to one lumen per square meter. In photometry, this is used as a measure of the intensity as perceived by the human eye of light that hits or passes through a surface.
This is the formal lux definition, but the more lux you expose your plants to, the better they’ll grow (or at least that’s what we’ve been told).
Lux varies greatly from single digits up to 60,000 in full sunlight, and the TSL2572 lux sensor in this kit is capable of the following:
- Approximates human eye response
- 45,000,000:1 dynamic range
- An operation to 0-10 lux in very dim light up to 60,000 lux in full sunlight
TinyScreen+ Buttons
The TinyScreen+ has four small buttons: two on each side. They look like little rectangles poking out from the sides.
Here’s how to use them in this application.
| Top Left |
Plus — Increments the chosen number value. |
| Bottom Left |
Minus — Decrements the chosen number value. |
| Top Right |
Set Time — Selects the HH, MM, SS and Am/Pm/24 hr to be adjusted with the Plus and Minus buttons. If the numbers seem okay, then just push this button to move on. |
| Bottom Right |
Halt Buzzer — Pushing silences the buzzer until the next update at 4 Pm. If the alarm condition has been satisfied before then, the buzzer will not sound.
Adjust Levels — Pushing cycles among soil #1 and soil #2 “white line” minimum levels as well as the LUX maximum value in the upper-left corner of the LUX rectangle display in the middle. |
Downloads
What’s In The Zip?
Code
Plant Monitor Plastic Enclosure Assembly Manual