Software Concepts and Support Library
In Part 1, we described the background and hardware build of the Arduino Graphics Interface (AGI). With this platform, you can turn an analog oscilloscope into a very high resolution graphics display device. This time, we’ll complete the project by describing the details of the XYscope: the software libraries and sample code that make the AGI hardware easy to use and integrate into any graphics display application.
X-Y Point Plotting
Early computer driven graphics display terminals featured large screen Cathode Ray Tubes (CRTs). These displays were essentially “up-sized oscilloscopes” whose X-Y beam deflection was driven by a computer. An application program would generate a list of XY coordinates for plotting, and a special interface would then convert the list into voltages for plotting onto a CRT screen.
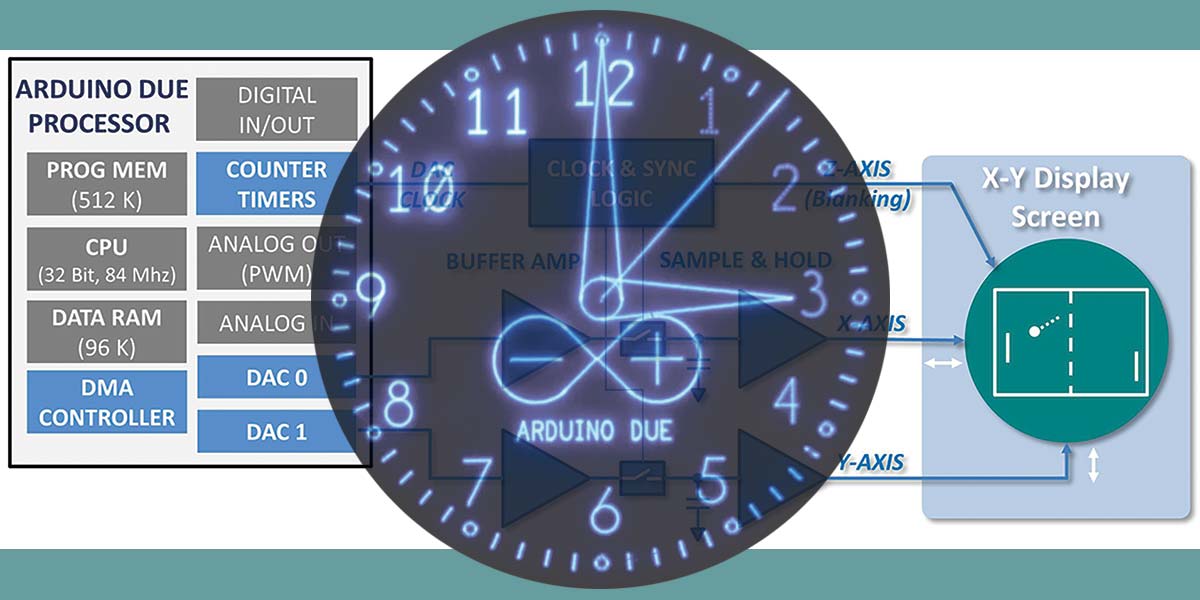
As shown in Figure 1, the AGI system uses this same approach to plot graphics onto the face of an analog oscilloscope.
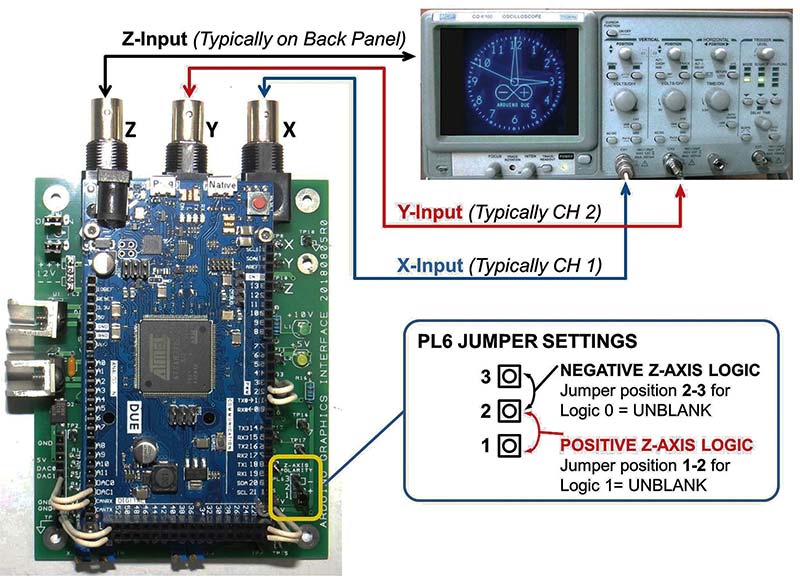
FIGURE 1. Connecting the AGI to an analog oscilloscope.
To briefly recap, AGI uses the two Digital-to-Analog Converters (DAC) found on an Arduino Due CPU board to generate an X voltage and Y voltage to drive an analog oscilloscope. These voltages drive the electron beam inside the scope CRT to specific locations on the screen. After the beam has settled into position, the AGI sends a short “unblank pulse” to the scope Z axis input which briefly flashes the point “on.”
The AGI Coordinate System
Data for plotting to the screen is held in the XYscope XY_List[] array. The XY_List array consists of pairs of 12-bit unsigned integers that correspond to specific physical locations on the face of the CRT screen.
The AGI coordinate system is depicted in Figure 2.
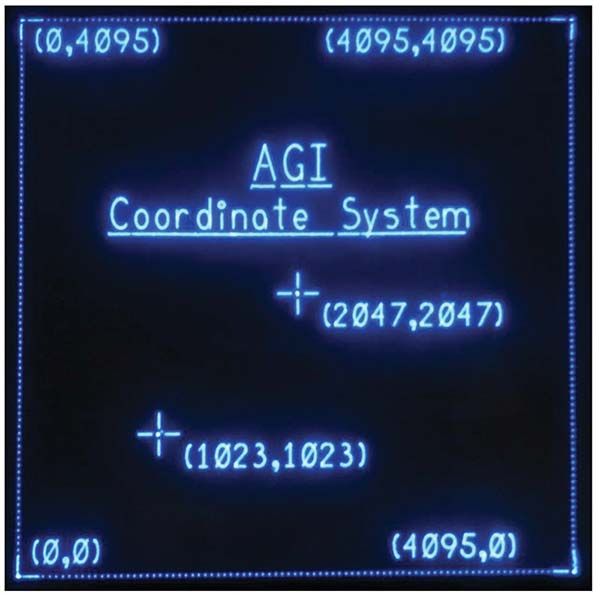
FIGURE 2. AGI XY coordinate system.
Here, it is seen that the lower left-hand corner of the display is plotted when X,Y = (0,0). Similarly, the upper right-hand corner is plotted when X,Y = (4095,4095).
More complex graphics such as lines, arcs, circles, and text are created by plotting a series of closely spaced points. The job of the application code (a.k.a., your program) is to fill an integer data array with the complete list of XY point pairs needed to fully define the graphics image to be displayed.
Getting XY Data Out to the Scope
As an example, let’s say we’re using a single array to hold all the X-Y points we want to plot. In the EVEN array locations (0, 2, 4, ...), we’ll put the X values; then, we’ll store the Y values into the ODD array locations (1, 3, 5, ...).
Once we’ve loaded the points into our XY_List array, we could use programmed I/O commands to send the data to the DACs. The programmed I/O approach would look something like this:
pinMode(3,Output); //Use pin 3 as an UNBLANK signal to the scope
digitalWrite(3,LOW); //Initialize UNBLANK signal TO BEAM OFF (low)
While (1) { //Send the XY integers to the screen……Do this Forever…
For (i=0;i<= endOfList; i=i+2) { //Sequentially send the list to the screen
analogWrite(DAC0,XY_list[i] )); //Load the X-DAC with the X-Value from the array
analogWrite(DAC1,XY_list[i+1]); //Load the Y-DAC with the Y-Value from the array
digitalWrite(3,HIGH); //Pulse CRT Beam “ON”
digitalWrite(3,LOW); //Turn CRT beam “OFF”
}
}
This block of code uses the Arduino analogWrite() command inside of a For-Next loop to sequentially send each X-Y point-pair to the two DACs, starting at the first array location (0) to the last array location (endOfList). While this programmed I/O approach does work, it’s slow and is very CPU intensive. If we use an estimated “for-next loop time” of 30 µs per loop, we would only be able to plot around 700 points to the screen within our target 20 ms refresh period (a refresh frequency of 50 Hz).
With just 700 X-Y points, only simple graphic objects could be rendered. This analysis tells us we need to find a better way to send the data set to the DACs!
DMA — The Better Way!
The solution is Direct Memory Access (DMA). With DMA, we utilize hardware circuitry inside the SAM 32-bit CPU to automatically perform the data transfer. The DMA controller hardware depicted in Figure 3 consists of a SOURCE pointer register, a DESTINATION pointer register, and a TRANSFER COUNT register.
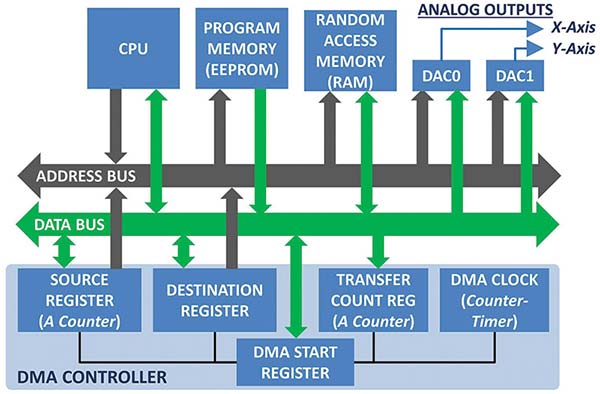
FIGURE 3. Block diagram of DMA hardware and register set.
To use the DMA hardware, we need to:
- Load the start address of the XY_List array into the SOURCE register
- Load the base DAC address into the DESTINATION register
- Load the total number of points in the list into the TRANSFER COUNT register.
We also program COUNTER_TIMER_0 as the DMA_CLK. In this way, COUNTER_TIMER_0 sets the rate at which the data points are transferred to the DACs.
Once these register setups are complete, we send a command to the DMA START register to kick things off; from this point on, the DMA hardware takes over and does the rest!
To keep the image visible, we need to resend the point list to the CRT 30 to 50 times per second. A second timer is programmed to fire off a “Time-to-Refresh” interrupt every 20 milliseconds (50 Hz). We use this interrupt as a cue to start another DMA screen refresh cycle.
What Actually Happens During a DMA Transfer?
While the DMA transfer is running, the DMA controller will ‘steal memory cycles from the CPU’ so it can grab XY coordinate values directly out of the XY_List array and transfer that data to the DAC output registers. Here, the CPU bus access is suspended briefly while the DMA controller drives the address bus and reads an integer from the XY_List. This data is then directed and loa
ded into the appropriate DAC register.The data transfer is accomplished in the background and requires no CPU help or involvement. However, we do program the DMA controller to fire off an interrupt after the whole list has been fully transferred. When we get this interrupt, a short interrupt service routine turns the CRT BEAM “off” (blank the Z axis) so we don’t just sit there and brightly show the last point plotted.
Defining and Loading the XY_List Array with Coordinates for Plotting
The AGI software package uses C++ constructs to define a data structure to hold all the XY coordinate point pairs. The following lines of code (as found in library file XYscope.h) shows how the data structure is defined and the XY_List declared:
struct pointList{
short X; //Defines a 16 bit integer in which to store X coordinates
short Y; //Defines a 16 bit integer in which to store Y coordinates
};
static const uint32_t MaxArraySize=15000; //This sets the max Array size reserved for XY list.
pointList XY_List[MaxArraySize]; //Define a contiguous array called XY_List of point pairs
In the Arduino Due world, the short variable type specifies a 16-bit signed integer. The lower 12 bits of the integer hold the coordinate value we want to plot while the upper four bits hold a DAC_ID code. The DAC_ID is read out of the XY_List data during the DMA transfer, and used by the DMA controller to direct the data to DAC0 (DAC_ID=0, X axis) or DAC1 (DAC_ID=1, Y axis).
If you ever need to access the XY_List array directly in your code at the element index, for example, you reference the “X” value as XYscope.XY_List.X[index], and the “Y” value as XYscope.XY_List.Y[index].
Plotting Points the Easy Way
To make it easy, the XYscope library includes a plotPoint routine that works like this:
int X_coord=2047;int Y_coord=2047; //Define X,Y coordinates of point we want to show
XYscope.plotStart (); //Initialize/erase the XY_List and start a new plot
XYscope.plotPoint (X_coord,Y_coord); //Plot the point!
XYscope.plotPoint(. . . //Plot more points as needed
XYscope.plotEnd (); //Finalize array for best display
plotPoint(X,Y) automatically manages the XY_List array, DAC_ID codes, and the array index pointer for you. Other routines that draw lines, arcs, text, and other graphic primitives are also provided to make ‘plotting’ quick and easy.
In the above example, you also see calls to plotStart () and plotEnd (). These two routines — along with a few others — make up the group of setup and data management routines that the AGI uses.
AGI Programming
The AGI libraries and CRT_SCOPE sample code set was developed and tested using the Arduino IDE (integrated development environment) version 1.8.2 (download from Arduino.org).
The basic structure of an Arduino AGI program is in Figure 4.
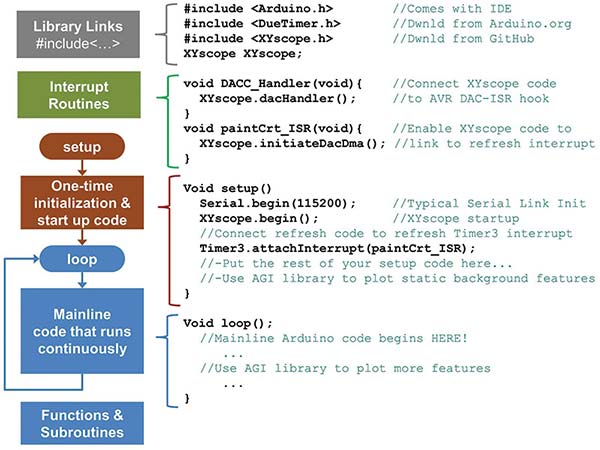
FIGURE 4. The basic AGI software framework.
This figure shows an overview of the libraries and unique interrupt links you must provide to get the AGI system up and running.
Library Links (#includes) — First off, you must include the needed timer and XYscope libraries (Note: You must install these libraries into the IDE on your PC/Mac!) Of course, your code will likely have additional “include” statements for the other libraries you are using.
Interrupt Routines — To properly link the XYscope functions to the interrupt system, the DACC... and paintCRT... routines must be defined as part of your code as shown.
setup() — Most of the DAC and DMA controller setup is performed with the call to XYscope.begin(). Since the CRT refresh timer-counter cannot be ‘attached’ inside the XYscope library code, this step must be performed as shown within the Arduino setup() program segment. You can also utilize AGI plotting routines inside of the setup() segment if you want to show a splash screen or plot static unchanging background graphics.
Mainline Loop — Here is where the bulk of your code will likely go. Take a look at the CRT_SCOPE sample code mainline loop and use it as a baseline to get started writing your own AGI programs.
Let’s Get Plotting!
With the setup and preliminaries out of the way, let’s give the graphics library a try. A list of the available AGI routines is shown in Table 1. These high level routines make using the AGI easy and fun. While the table provides a brief overview of each routine, I suggest that you examine the sample program CRT_SCOPE to check out a working example of the format and usage for each library call.
POINTS, LINES, CIRCLES, ELLIPSES — In addition to the plotPoint(x,y) routine already discussed, a number of other graphics plotting functions are also provided. plotLine(x0,y0,x1,y1), for example, is used for drawing vectors to the screen from coordinate (x0,y0) to (x1,y1). Similarly, plotCircle(xc,yx,r) draws a circle centered at coordinate (xc,yc) of radius r.
TEXT CHARACTERS — Characters are formed by combining lines, circles, ellipses, and arcs together. A structured data table was created to define a vector font for the AGI so text can be easily ‘printed’ to the CRT screen. This font is fully scalable with many routines that make it easy to plot text and numbers of varying size to the CRT. As shown in Figure 5, the font can be set to use MONO or PROPORTIONAL spacing. At startup, the spacing defaults to MONO mode.
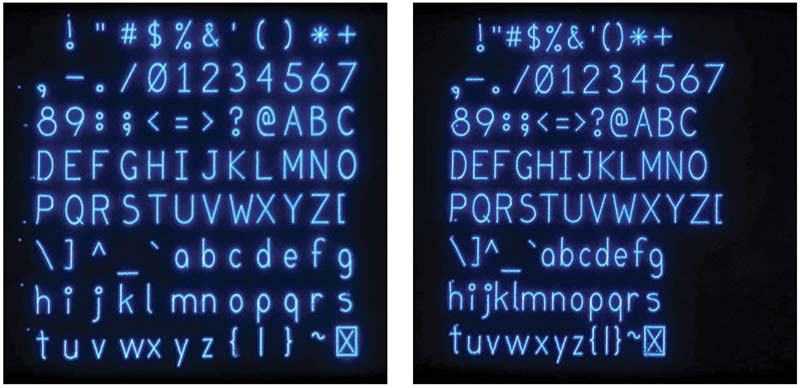
FIGURE 5. The AGI font can be used in Mono (left) or Proportional (right) spacing modes.
BRIGHTNESS — Any single graphic point plotted to the CRT will be either full on or full off. At first blush, it appears that we have no intensity or display brightness control. However, since lines, text, arcs, circles, and ellipses are simply made up of closely spaced individual points, we can vary display brightness by changing the density and spacing of the individual points making up each feature. Closely packing the points — that is putting very little space between them — will cause a feature to appear very bright. Similarly, putting more space between adjacent points will cause the feature to dim.
Two routines — setGraphIntensity(...) and setTextIntensity(...) — are used to independently set the point-to-point spacing values of graphics and text entities. This effect is shown in Figure 6 where each of the “hour digits” have been plotted at intensities starting at 20% on up to 250%. Individual dots can be seen in the dimmer characters (i.e., 1 o’clock).
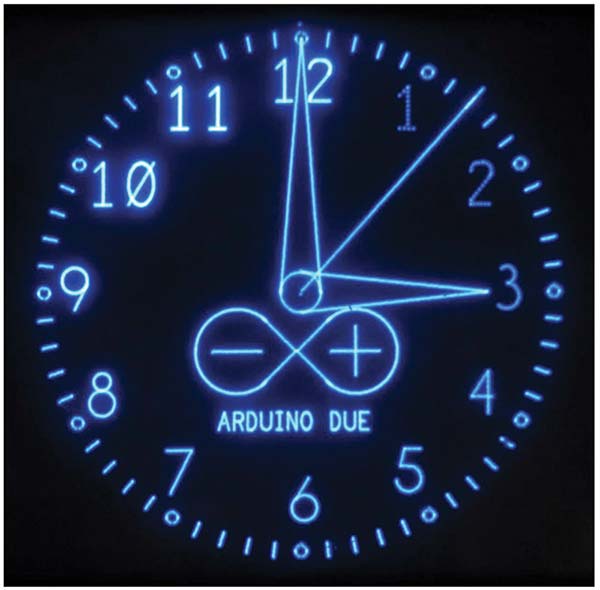
FIGURE 6. Variable brightness demonstration.
SCREEN SAVER — Prolonged tracing of an unchanging pattern onto the face of a cathode ray tube can permanently burn that pattern into the phosphor. That’s why screen saver programs were first invented. I have included the setScreenSaveSecs(ScreenOnTime) routine in the library to provide this protection. This routine measures the time since the last plotPoint(...) routine call, and blanks the CRT when the specified ScreenOnTime seconds have elapsed. The screen saver can be disabled by setting the ScreenOnTime = 0.
The Sample Program
Sample program CRT_SCOPE is included as part of the XYscope library download. You can quickly get started by opening CRT_SCOPE, compiling, and uploading the code into your Due. Once you’ve got the code running, open the serial monitor (baud rate=115000, format=NONE), and you will see and interact with the option menu shown in Figure 7.
========= CRT_SCOPE_Ver_1.57 =========
h Show this HELP Screen
? Show current plotting STATS
---- Hardware setup and diagnostics -----
7 Signal Scope Pattern for Gain & Center Adj.
C/c Incr(C)/Decr(c) DMA Clock Freq by 50 Khz
F/f Front-Porch blank count [Incr=F/Decr=f]
B/b Back-Porch blank count [Incr=B/Decr=b]
2 Display Centering Pattern
V/H Peak-to-Peak Vertical/Horiz Sq-Wv Test Pattern
d Peak-to-Peak Dots_in_the_Corners Test Pattern
---- Test plots for TEXT routines
m Toggle Font mode Monospace<->Proportional
I/i TEXT intensity [Incr=I)/Decr=i]
0/1 0=Print Random Nums, 1=Nums w/Underlines
s/S plotChar Test, s=Test 1, S=Test 2
w Wakeup from Screen-save timeout
---- Test plots for GRAPHICS routines ----
+/- GRAPHICS Intensity [Incr=+/Decr=-]
3 Display Random Rectangles, Circles, & Ellipses
4 Simulated Graph Plot
5 Display Random Ellipse
6 Display a fixed Ellipse
8 Demo Circle arc segments from 0 to 7
9 Demo Ellipse arc segments from 0 to 7
---- Simulated Application Screens ----
l Plot an animated Arduino Logo
D Show AGI Coordinate System Plot
t TIME - A Simulated Clock Display
* Toggle ‘SimClock’ second-hand On-Off
p Pong Simulation
==========================================
STATS..............
MaxBuffSize: 15000 Total Array Used: 4288 (28 %)
DMA Clock Freq: 800 Khz (Period: 1.25 us)
Point Clock Freq: 400 Khz (Period: 2.50 us)
Refresh Freq: 50.00 Hz (Period: 20000 us)
Graphics Int: 100 % Text Int: 100 %
Font Spacing Mode=MONO
Second Hand Enab = NO, Screen_Save_Secs: 600
FIGURE 7. Option menu for sample program CRT_SCOPE.
HARDWARE SETUP — By using CRT_SCOPE, you can run several test patterns to help get the hardware debugged and set up. For example, Option 7 will display a circular test image to the screen that you can use to make the AGI gain and offset adjustments. To do this, just monitor the X and Y AGI outputs using your oscilloscope (as a regular scope!), and adjust gain and position pots on the AGI board for a 1.0 to 4.0V P-P amplitude sine wave (see the Build documents in the downloads for more adjustment details).
You can try option V or H while changing the DMA CLOCK frequencies (C/c) to test and optimize the display quality for your setup.
TEST PLOTS — There are short test programs available that demonstrate the various graphics and text plot routines of the AGI library. A glance through the source code will help you see how to use the various library routines and options. Note: Take care when specifying coordinates and radius values; several routines skip plotting or fold over from one screen edge to the other when all or part of a graphic element falls “off the edge of the universe” (i.e., a point coordinate goes negative or exceeds 4095).
SIMULATED APPS — I’ve mocked up a few simulated application displays to show how the AGI project could be put to work for you. Figure 8 shows a few of these screenshots photographed off of my five inch diagonal HP1332A XY monitor screen.
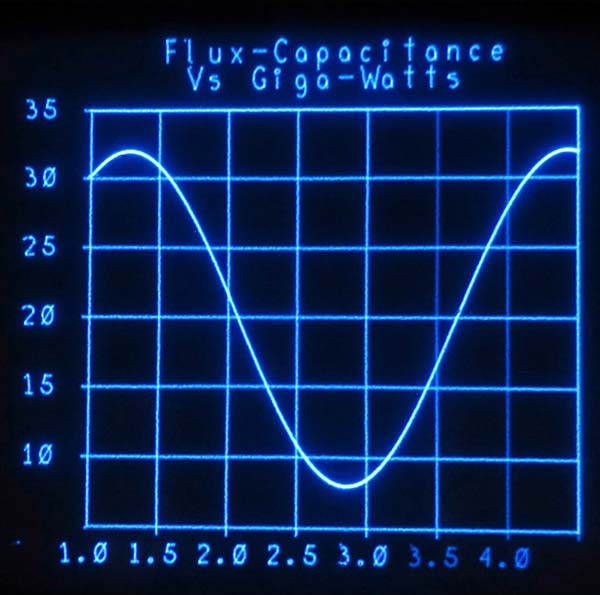
A.
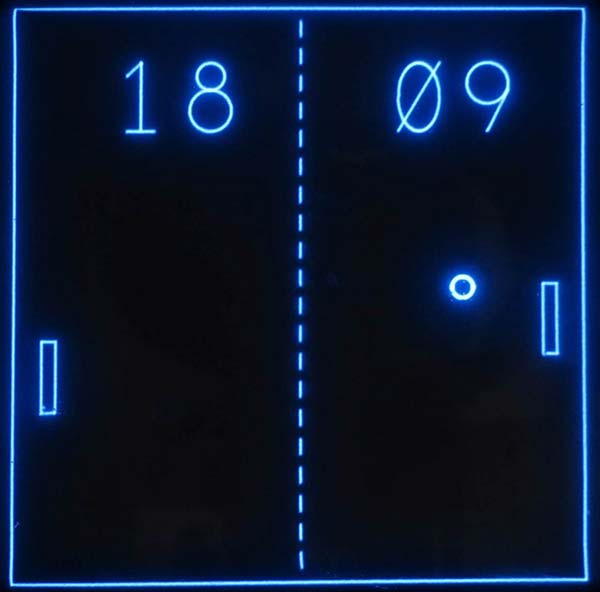
B.
FIGURE 8. A few “simulated application” displays.
For those of you interested in building a CRT clock, menu option ‘t’ produces the clock face image shown in Figure 6. The AGI platform only needs a Real Time Clock (RTC) module or Wi-Fi link to Internet time to get going!
MONITORING PLOT-MEMORY USAGE — After a CRT_SCOPE option is executed, general statistics are reported below the menu (Figure 7). Memory usage, current DMA clock rate, CRT refresh frequency, intensity settings, and other data is reported. The “Total Array Used” report keys off the global XYscope.XYlistEnd array pointer variable.
To prevent array overruns, plotting is stopped (that is, calls to XYscope.plotPoint(...) are ignored) once (XYscope.XYlistEnd + 5) >= XYscope.MaxBufferSize. Within your program, you can identify overrun events by regularly comparing global variable XYscope.XYlistEnd to global constant XYscope.MaxBuffSize.
Wrapping Up
I trust you have found the Arduino Graphics Interface interesting and informative. With this project, I learned a lot about the Arduino Due, DACs, timer interrupts, DMA hardware, and how these ideas could come together to drive an XY display.
I invite you to download the software library and other project details, dust off your analog oscilloscope, and give this project a try! Happy plotting to all! NV
Table 1
| Setup and Control Routines |
| void XYscope.begin(uint32_t dmaFreqHz); |
Call this routine once within the setup() section of your program. This routine initializes the DACs, DMA controller, and Refresh Counter Timer. If the dmaFreqHz variable is omitted, AGI will use a default value of 800,000. |
void XYscope.autoSetRefreshTime();
long XYscope.getRefreshPeriodUs(void); |
The CRT refresh period starts at 20 ms. Call this routine to automatically extend the refresh period if needed (i.e., >9.5K points). Use ‘get’ routine to read current refresh value (µs). |
void setScreenSaveSecs(long ScreenOnTime_sec);
long getScreenSaveSecs(void); |
Set/retrieve screen saver time (in seconds). If ScreenOnTime = 0, the screen saver is disabled and the display will NEVER be blanked. |
| float getLibRev(void); |
Retrieves the revision level of the AGI library as a (Major.Minor) format. |
| Buffer Management Routines |
| void XYscope.plotStart(); |
Initializes/erases XYlist buffer. Call once to start a new plotting sequence. |
| void XYscope.plotEnd(); |
Ensures last points plotted are visible; call once at end of plot sequence. |
| Set Graphics/Text Intensity Routines |
void XYscope.setGraphicsIntensity
(short GraphBright);
int XYscope.getGraphicsIntensity(); |
Sets/gets the brightness (as a %) of lines, circles, ellipses, and arcs. Valid range is 1% to 250%. Defaults to 100% if GraphBright is omitted. Higher values use up more XY_List space. |
void XYscope.setTextIntensity(short TextBright);
short XYscope.getTextIntensity(); |
Sets/gets text brightness (as a %). Valid range is 1% to 255%. Defaults to 100% if TextBright is omitted. Higher values use up more XY_List space. |
| Graphics Plotting Routines |
| void XYscope.plotPoint(int x0, int y0); |
Plots a point at location (x0,y0). Coordinate values must be 0-4095. |
| void XYscope.plotLine(int x0, int y0, int x1, int y1); |
Plots a line from (x0,y0) to (x1,y1). Coordinate values must be 0-4095. |
void XYscope.plotRectangle(int x0, int y0,
int x1, int y1); |
Plots a rectangle from (x0,y0) to (x1,y1). Coordinate values must be 0-4095. |
void XYscope.plotCircle(int xc, int yc, int r);
void XYscope.plotCircle(int xc, int yc, int r,
uint8 ArcSegment); |
Plots a circle centered at (xc,yc) of radius r. Coordinate values must be 0-4095; radius value must be 1-2047. A fully formed circle is plotted if ArcSegment is omitted or set to 255. |
void XYscope.plotEllipse(int xc, int yc, int xr, int yr);
void XYscope.plotEllipse(int xc, int yc, int xr, int yr);
uint8 ArcSegment); |
Plots an ellipse centered at (xc,yc) of radius rx/ry. Coordinate values must be 0-4095; radius value must be 1-2047. A fully formed ellipse is plotted if ArcSegment is omitted or set to 255. |
| Text Plotting Routines |
void XYscope.printSetup(int textX, int textY,
int textSize);
void XYscope.printSetup(int textX, int textY,
int textSize, int textBright); |
Sets the text X-Y start location (lower left-hand corner of text), text size (in pixels), and optional brightness (%) for subsequent XYscope.print(...) calls.
Valid textSize range is 16-3000; practical range is 150-2500. Text will wrap to left side of screen upon overflows. |
void XYscope.setFontSpacing(short spacingMode);
short XYscope.getFontSpacing(); |
Sets/gets the font spacing mode. Use spacingMode values as follows: Prop=0, monoTight=8, monoNorm=10, =12. |
| void XYscope.print(char* text, bool UL_flag); |
Print text string starting at current text X-Y location. Set optional UL_flag>0 to underline text. Text will wrap to left-hand side of screen on overflow. |
| void XYscope.print(int number, bool UL_flag); |
Print integer starting at current text X-Y location. Set optional UL_flag>0 to underline text. Text will wrap to left-hand side of screen on overflow. |
void XYscope.print(float number,int nPlaces,
bool UL_flag); |
Print floating point number at current text X-Y location, with nPlaces to right of DP. Set optional UL_flag>0 to underlined text.
NOTE: Rounding errors may become evident if nPlaces exceeds 7. |
References
Introduction to Digital-Analog Conversion
https://www.allaboutcircuits.com/textbook/digital/chpt-13/digital-analog-conversion
DMA D/A Conversion with a SAM4S Microcontroller: The Timer/Counter
27-Apr-16 Robert Keim
https://www.allaboutcircuits.com/projects/dma-digital-to-analog-conversion-with-a-sam4s-microcontroller-the-timer-cou
Understanding & Using the SAM4S Digital-to-Analog Converter
4-May-16 Robert Keim
https://www.allaboutcircuits.com/projects/understanding-and-using-the-sam4s-digital-to-analog-converter
Digital-to-Analog Conversion with the SAM4S Peripheral DMA Controller
9-May-16 Robert Keim
https://www.allaboutcircuits.com/projects/digital-to-analog-conversion-with-the-sam4s-peripheral-dma-controller
The Beauty of Brsenham's Algorithm
http://members.chello.at/easyfilter/bresenham.html
An Overview of Digital-to-Analog Converters and Specifications
https://en.wikipedia.org/wiki/Digital-to-analog_converter
Design Spark
Free PCB Layout Software
https://www.rs-online.com/designspark/pcb-software
Arduino
Arduino IDE, Source of Due Hardware, Arduino Libraries
https://www.arduino.cc
AGI Hardware Details, Software Library, Sample Programs
https://github.com/Ed-EE-Eng/XYscope