A Sequel to the Graphing Thermometer
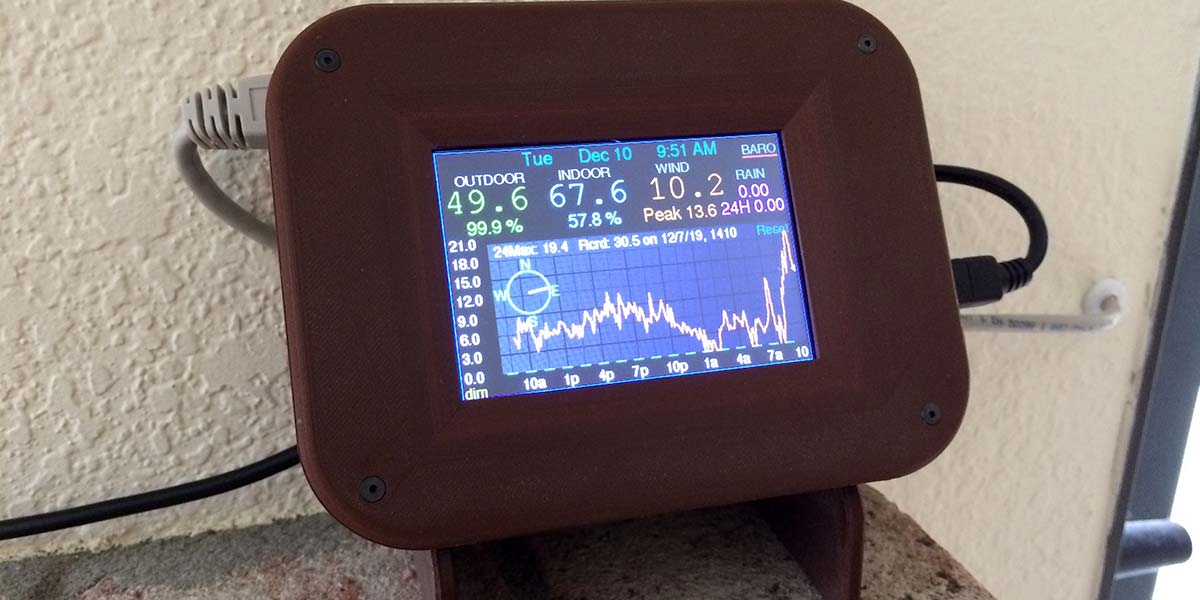
Wow, the wind was really blowing last night! I wonder how fast it was. Or how cold did it get, or what did all of that rain amount to? With a graphing weather station (Figures 1 and 2), it’s possible to know all of this and more. An Arduino Mega is the brain, and it uses eight sensors to read what’s happening. Figure 1 is the weather station on my mantel shown at the beginning of this article.
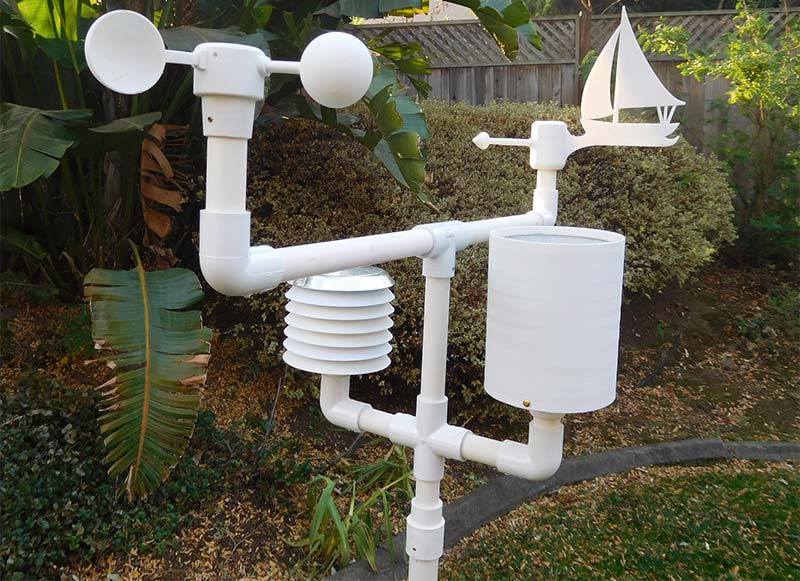
FIGURE 2. External sensors ready to mount on the mast on the roof.
In the San Francisco area, we care a lot about the wind because it’s very windy here. We also care about the rain because it doesn’t seem to rain enough. Everybody cares about the temperature.
My graphing weather station uses a 3.5” color touch screen, and measures and graphs the following over a period of 24 hours:
- Outdoor temperature, with maximum and minimum listed.
- Outdoor humidity.
- Indoor temperature.
- Indoor humidity.
- Wind speed, including the maximum, and a resettable record high with time/date recorded.
- Wind direction, with a visual display of the compass headings.
- Rainfall now and for the last 24 hours, with one graph displaying each hour of rain, and another displaying rain for each day for the last 17 days. The total season’s rainfall is displayed, which can be re-zeroed including a time/date stamp. Rainfall is measured in 0.01” increments.
- Barometric pressure.
Most readings are updated every 2-3 seconds, and logged for graphing at different intervals. The Mega has just enough memory to do all of this.
Temperatures, humidity, and wind are logged every seven minutes, which gives one point per two pixels on the graph. Barometric pressure is logged every 20 minutes. A non-volatile memory backs up the data, so in case of power outage, reset, or reprogramming the device, everything is preserved.
Each piece of data is recorded in a location determined by a pointer. Each is an integer, multiplied by 10 or 100 so that the data lists hold two-byte integers instead of four-byte floating numbers, which would require much more memory. The spot numerically below the most recent location is the second-newest data recording, and the spot just above is the oldest. The location below location zero is wrapped around to the highest-numbered location. This makes for a circular list of data.
With a few modifications to the code by simply commenting and un-commenting some lines, all the readings can be changed to the metric system. Also, wind can be changed to knots.
With this project, I am standing on the shoulders of a giant. Ed Andrews wrote a previous article on the Graphing Thermometer for Nuts & Volts. It measures and graphs outdoor temperature on a color screen, and also displays humidity and indoor temperature. It features a self-adjusting Y axis so that the graph magnifies what’s happening and emphasizes what’s changing with the temperature. A real time clock logs the times, and maximums and minimums are recorded. All of this is on a cool color screen.
Without all his hard work, I might have never had the courage to tackle something like this. I’m grateful for his paving the way in graphing, scaling of results, color screens, temperature sensors, and real time clocks. Thank you, Mr. Andrews!
The Anemometer
The anemometer measures the wind speed, where the wind blows three cups that spin in proportion to the wind speed (Figures 3 and 4).
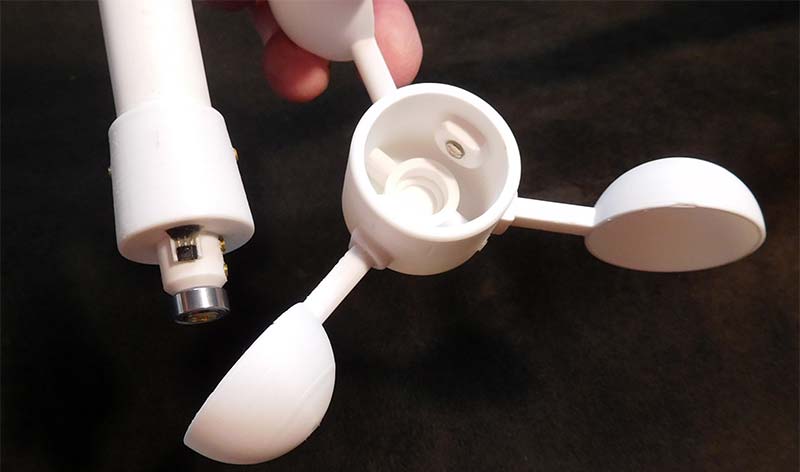
FIGURE 3. The anemometer cups next to the bearing/sensor/mounting support.
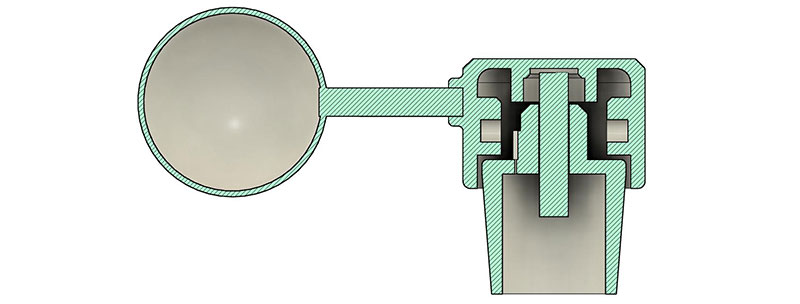
FIGURE 4. CAD drawing of the anemometer.
A ball bearing makes the anemometer very sensitive to wind. There is a Hall-effect magnetic sensor in the middle, and a housing holding the cups also has two magnets to pass by the south pole sensor.
Figure 3 shows the inside with the sensor mounted, holes inside of the cap to hold the magnets, and the recessed area to hold the bearing. The microcontroller measures the interval between magnet passes, and from this the speed can be calculated. This is all determined in the ReadWind() section of the code. The wires to the sensor are all covered with epoxy so that moisture won’t get to them or find its way down into the support tubing.
I started the calibration process using the SWAG method (Scientific Wild A.. Guess). I saw how fast it spun while walking, figured this was 3 MPH, and started with that. I had it display the estimated speed on the screen. Then, while my wife drove the car at 5 MPH increments in speed and with a 9V battery powering the weather station, I wrote down the number for each speed. I graphed that on a piece of paper (actual speed vs. the readout on my screen; Figure 5) and could then calculate a correctional factor to modify my number to calculate the actual speed.
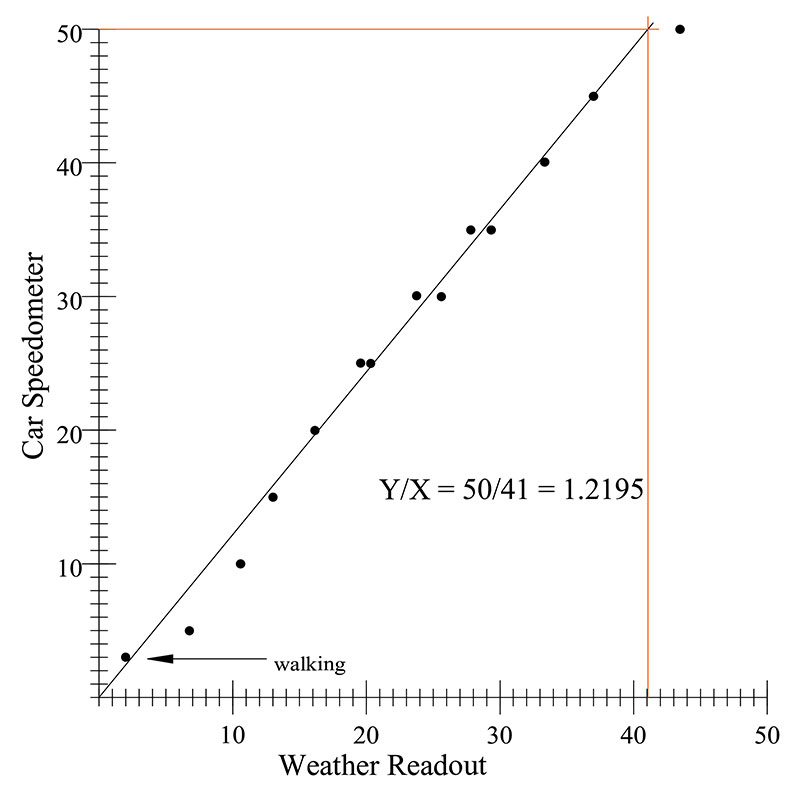
FIGURE 5. Graph for calibrating the wind speed.
At 5 and 10 MPH, it was not so easy to control the car speed exactly, but the graph illustrates where the right numbers should be. I went up to 50 MPH for these tests. If you use my design and materials you won’t need to do this, but if you use another method and dimensions of construction, this will help you get it calibrated.
Start with my number, use the driving experiment to obtain the ratio (car speed) / (displayed speed), and multiply that times my number to obtain the new number. Search for the code for vc279 to see where I did this. For miles per hour:

When the magnet passes by the sensor, the program waits for the level to drop while a loop is counting. When it drops a second time, the loop is exited with a number that is proportional to the time between lows, or inversely proportional to the speed. If the loop reaches the end of its limit, the speed is too slow and is counted as zero. Less than 1.7 MPH counts as zero.
Much slower speeds may not really get the anemometer spinning, and will require more time for the microcontroller to determine the speed. If the anemometer is going very slowly, it’s possible for almost an entire rotation of the cups to occur before arriving at a speed measurement. This would delay the reading of everything else, and slow the response to the touch screen.
The Wind Vane
The wind vane (Figures 6 and 7) has a magnetic field sensor in the top of it that senses which direction it’s pointing. A cap at the top shields the circuit from the weather.
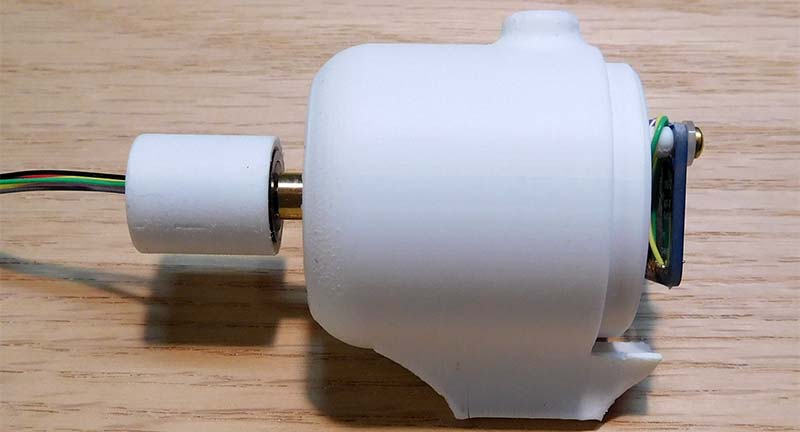
FIGURE 6. Hub of the wind vane, with compass sensor on the right and slip ring on the left.
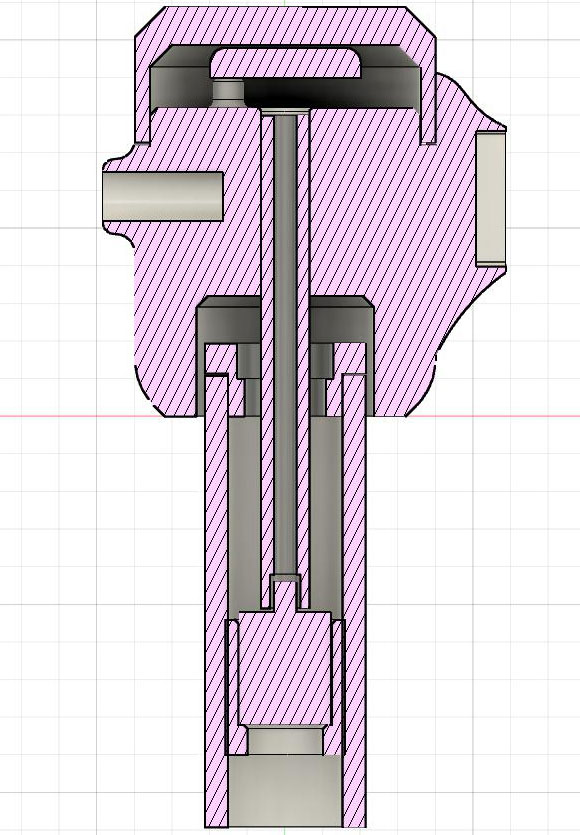
FIGURE 7. Cross-section CAD of the wind vane hub.
For the rotation, I used a stainless steel ball bearing. It’s located in the fitting at the top of the support pipe. Though it’s slightly magnetic, it didn’t seem to throw off the readings since it’s a little ways under the sensor and directly underneath it, affecting the Z axis but not the X and Y axes.
Bearings are also available with Delrin (acetal) races and glass balls, which are not magnetic but may not last as long. The wires from the sensor lead down through the center, through the bearing, and through a brass tube to a slip ring. The wind vane can then turn around to its heart’s content, keeping electrical contact with the wires below without twisting any.
A drilled-out brass rod connects the base of the vane to the slip ring, after passing through the ball bearing. To drill into the center of the rod, clamp the drill bit below the work, put the rod in a drill press, and drill it with the rod spinning and the drill bit holding still.
The hole will want to go up the center of the rod. Starting with a center drill will help get it started in the right place.
I printed a sailboat as my wind vane. It’s a little heavy which may slow down the response to wind changes a little. However, the wind changes direction continually, so this damps out the rapid changes a little. For me, it works well and looks better than a flat vane. Style!
The pointer at the front is made from solid brass, connected by brass tubing. It should then be telescoped and glued into place after finding the right balance point, so that balance problems won’t keep gravity from affecting the direction of pointing. A brass lamp finial might make a stylish pointer/counterweight.
The display shows a compass rose (Figure 8).
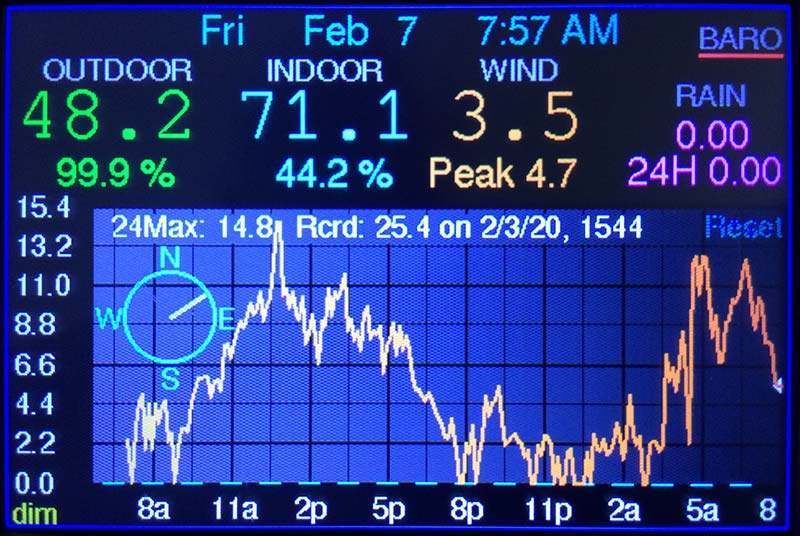
FIGURE 8. Wind speed and compass display.
The microcontroller uses the readings to calculate the angle of wind direction through the atan2 function, and the resulting angle is used through the sine and cosine functions to make a pointer that goes from the center to the edge of the compass rose circle. It’s updated about every two seconds.
The Rain Gauge
Rainfall is measured by the depth of water over a given area. If there is a wide funnel channeling the water, the effect is magnified and it’s possible to measure small increments.
The rain gauge has a funnel that channels the water into a teeter-totter “bucket” arrangement (Figures 9 and 10).
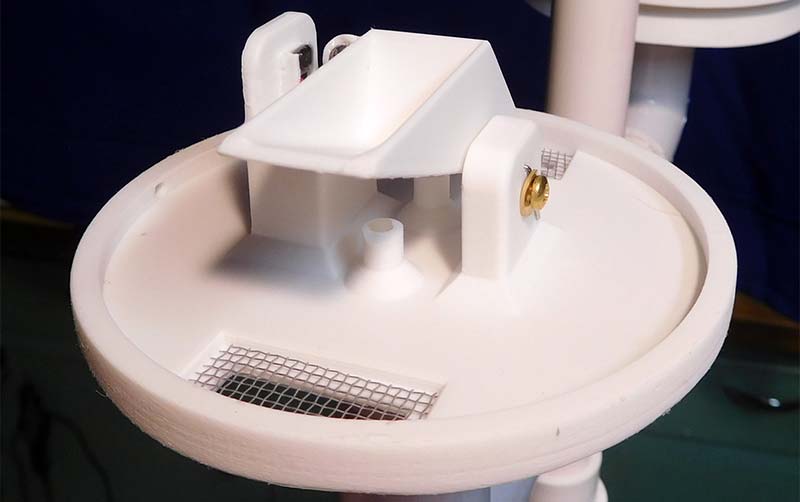
FIGURE 9. Rocking bucket for measuring rainfall, with sensor and magnet at the upper left.
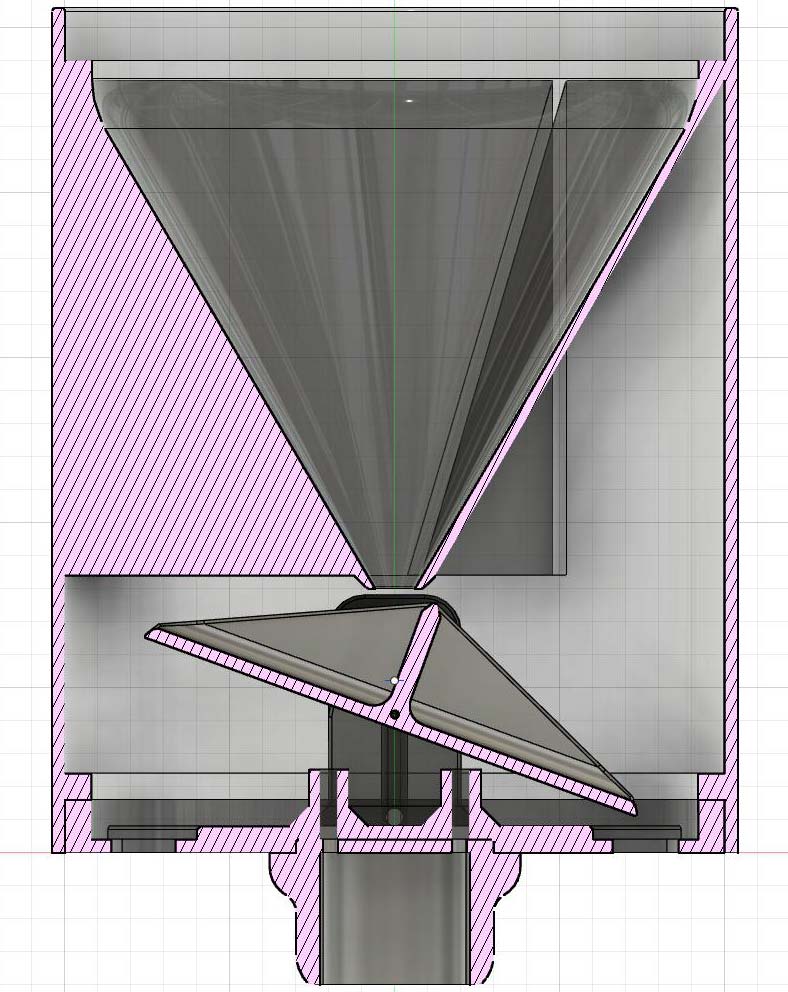
FIGURE 10. Cross-section of the rain gauge.
When the water fills one side bucket, it tilts and dumps the water out, ready to fill the other side bucket. There is a magnet attached to the bucket device. A latching Hall-effect sensor holds the voltage level high while one pole of the magnet is facing it. When the teeter-totter tilts, the other pole of the magnet changes the sensor to a low voltage state.
The microcontroller senses the change and increments a counter. The number of changes to the sensor can be multiplied by a factor (0.01192) to determine the amount of rain. There are little stops under the ends of the bucket teeter-totter, threaded for a nylon or brass setscrew that can be adjusted to refine the amount the buckets hold. It didn’t seem to make much difference at all and the code can give all the adjustment needed.
If you make a tilting bucket different in size than mine, you’ll need a different number. You may wonder: What if the rain comes so fast that the microcontroller misses a bucket flip or two? As long as the rate of rainfall does not exceed 14 inches per hour, it won’t miss any. If you get that much rain, a missed reading will be the least of your worries!
To calibrate the rain gauge, I used a medical IV setup to drip water into the funnel. I collected the water that got dumped out and weighed it. (The metric system is best for this.) The radius of the funnel at the top, R, is 5 cm. The area of the funnel is the πR². The volume (V) in one inch (2.54 cm) depth of water is:
V = πR² * 2.54 =199.49 cubic centimeters or ml or grams per inch of water
Take the weight (W) of the water I dribbled through the apparatus (898.90 grams) divided by the number of bucket flips (B = 378), then divided by 199.49 grams per inch gives inches of water per bucket flip:
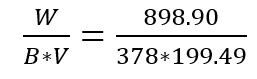
0.01192 inches per bucket flip
So, multiply the number of bucket flips times 0.01192 to get the amount of inches of rain. (B*0.01192). The Update Rain section of code calculates this, and also has alternative code for metric system units.
The axle of the rain bucket system is stainless steel wire, and a brass screw keeps it in place. Mesh over the funnel at the top and over the exit holes at the bottom keeps spiders and insects from inhabiting the inside and fouling up the works.
Temperature and Humidity
The inside temperature/humidity sensor is attached to the left side with a spacer to hold it away from the box. The side view shows this (Figure 11).
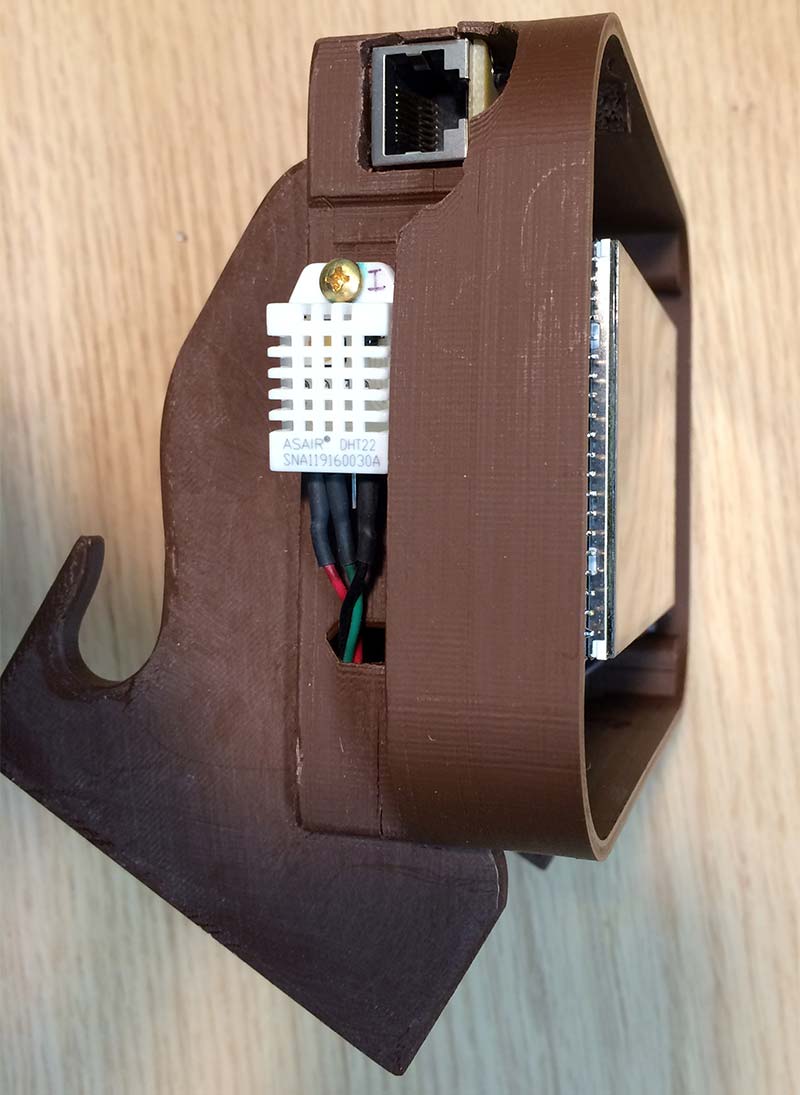
FIGURE 11. Side view with the inside temperature sensor.
The outside temperature/humidity sensor is mounted inside a solar radiation shield (Figure 12).
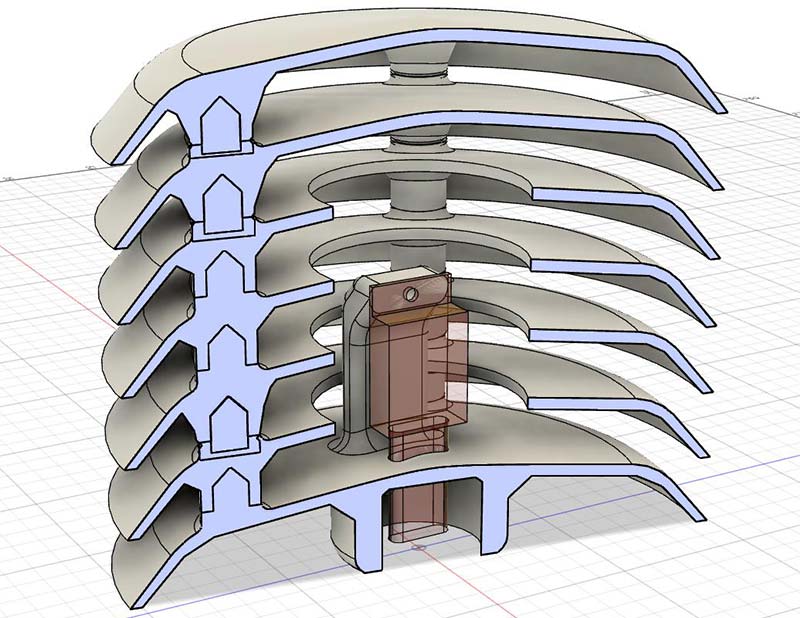
FIGURE 12. Cross-section of the radiation shield for the outside temperature/humidity sensors.
It consists of a 3D printed stack of plates. The top two plates are solid, and below it are plates with openings surrounding the sensor. The very top plate is covered with shiny aluminum tape.
The wiring below the sensor is covered with epoxy to protect it from the water and to keep water from getting down into the support tubing.
All but the bottom plates have an extension printed onto the bottom support to keep the printer from generating support inside the hole where it’s not needed and save post-printing work.
There’s a groove printed that shows where to cut off the extension; a knife slices it off nicely.
This shield allows air to circulate around the sensor and shades it from direct sun. In full sun and no wind, the temperature will read 1-2 degrees higher compared to a shield with a forced-air fan inside it, but for the most part it gives a fairly reliable indication of the temperature.
Mounting it up on the pole with the other instruments helps give a more accurate reading than mounting in a more sheltered place. If the weather allows the graph to include the freezing point, a dotted line appears at that temperature if the graphed area covers that temperature (great idea, Mr. Andrews!).
Atmospheric Pressure
Every barometer I have ever had told me nothing. Part of it was that the resolution was not fine enough to see small changes, but also in California, the changes with rain are not as dramatic as other places.
This sensor is very accurate and with the variable scale of the graph, even very small changes are quite noticeable (0.01 inHg). The sensor will read to 0.001 inHg, but the readings change continually. I found it practical to round it off to two decimal places.
Barometers are useful for predicting rain and storms. I wasn’t going to include a barometer since Internet weather prediction is so good, but a friend wondered “why not?”
If he cared, then others must also be interested, so I added it. Now that I see how finely it reveals the changes, I decided that I like it (Figure 13).
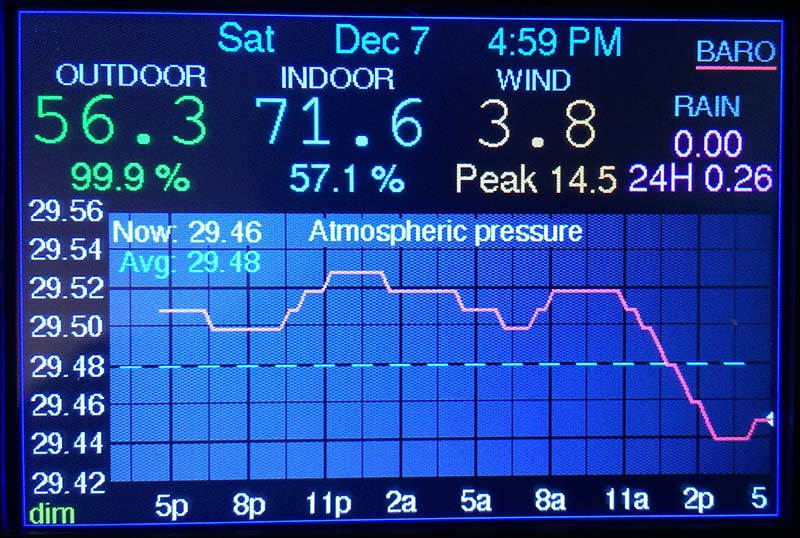
FIGURE 13. Barometer graph.
I can see the pressure dropping below the average line and think “Maybe rain?” Then I look outside, and voilà, it’s raining.
The top left of the atmospheric pressure graph shows the pressure updated every 2-3 seconds. Below that is the average for the world in general, corrected for my elevation. When the average is visible on the graph, a dotted line is there to help see how the readings compare to average.
I used the Adafruit example program for the sensor, plugging in the value for current atmospheric pressure from my local weather service, and used that to generate my elevation in meters. Multiplying elevation by the change in pressure per meter of elevation and subtracting it from the average pressure, I then arrived at the average pressure for my elevation. Search the code for average baro pressure for more details and for metric:

The Touch Screen
In general, if you touch an area of readout, you get more information and a graph of that property. Touch the outside temperature reading, and the graph switches to outside humidity. Touch it again, and the graph goes back to outside temperature. Since the touch screen is not interrupt driven, it may not respond during wind speed measurement, so the screen dims briefly to let you know your touch was detected. It may respond on the first touch, or it may take 2-3 touches to get there.
The touch screen demo program can help you determine the pressure threshold p.z. I had to reduce the threshold after using it for a while. You can find more about this in the code by searching for p.z. The recommended value of 10 was too low.
The rain display on top of the screen shows the rainfall since the top of the hour, and below it the rainfall for the last 25 hours. Touch that area and you see a graph of the rainfall (Figure 14) for each hour of the last 25 hours.
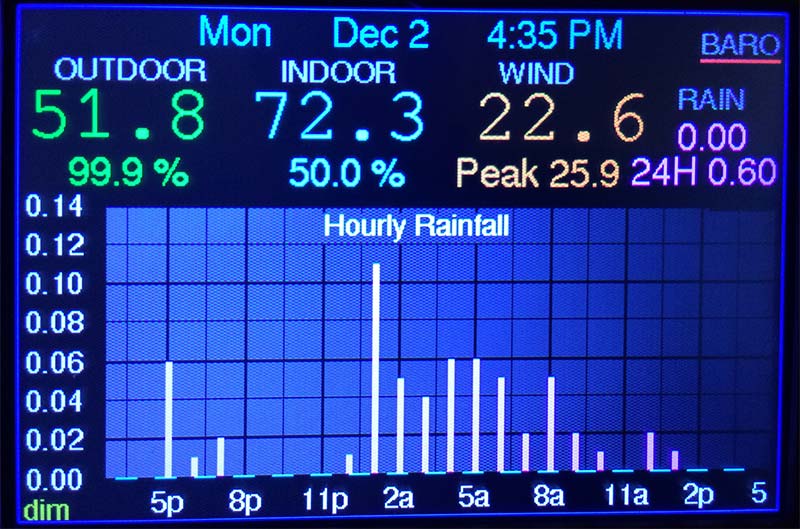
FIGURE 14. Hourly rainfall graph.
Touch the same area again and you see a graph for each day of rainfall (Figure 15) for the last 17 days (I loaded fake data for this picture because it hadn’t been raining enough to get a decent looking graph).
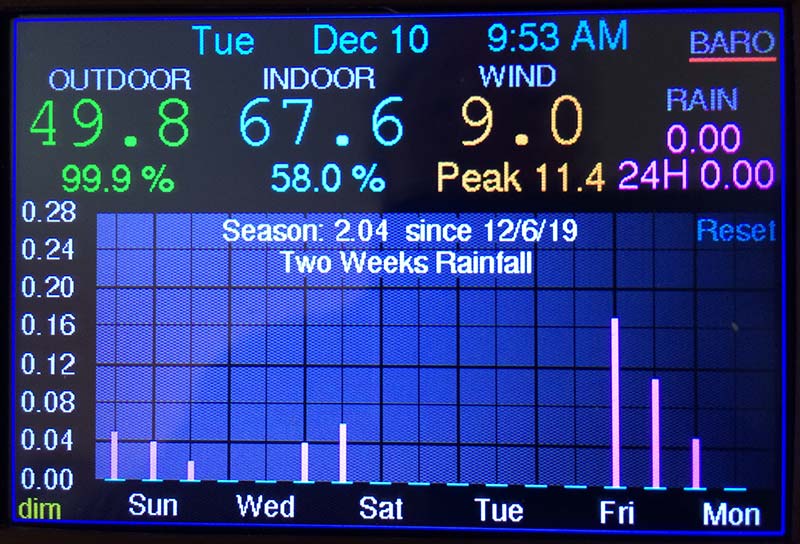
FIGURE 15. Seventeen day rainfall graph.
The top of the graph lists the seasonal rainfall total since it was last reset and the date it was last reset. Touching just below the reset at the right sets it back to zero and dates it.
Similarly, the wind graph shows the maximum for the last 25 hours. Next to that is the highest recorded wind speed since it was last reset, with time and date. The wind display at the top shows the wind speed measured in the last 2-3 seconds and below it is the peak reached since it was last logged, starting over every seven minutes as shown back in Figure 8.
Only these peaks are logged for graphing, and even with just the peaks the graph gives quite a saw-tooth-shaped display. The wind is a dynamic three-dimensional phenomenon with continually changing swirls, puffs, and lulls. My experience in small boat sailing has taught me the challenges of observing and compensating for these changes.
The compass is displayed as the compass rose on the left of the screen, which has a pointer that points in the direction the wind is blowing.
The top right of the screen says BARO, and touching this shows the barometer graph as seen in Figure 13. When the average appears on the screen, a dotted line appears at that value. In case it’s not showing, the average is displayed at the top left of the graph.
The bottom left of the screen says dim, and if you touch it, the screen dims. Touch it again and it goes back to normal brightness.
The top of the screen displays the time and date from a real time clock (RTC). The clock has a battery backup to preserve the time in case of power outage. The bottom right of the graph of the outside temperature screen says Clk. Touch that to get to the clock setting routine.
The touch screen uses different coordinates than the display screen. The display screen uses the top left as the origin; the X axis increases as it goes to the right; and the Y axis increases as it goes down. The touch screen puts the origin at the top left, but X and Y are reversed. The X axis increases as it goes down, and the Y axis increases as it goes to the right. It’s a little confusing. I tried to remap it to make them both the same with no success.
Mounting the Outside Instruments
I used PVC pipe to mount all the instruments (Figure 16).
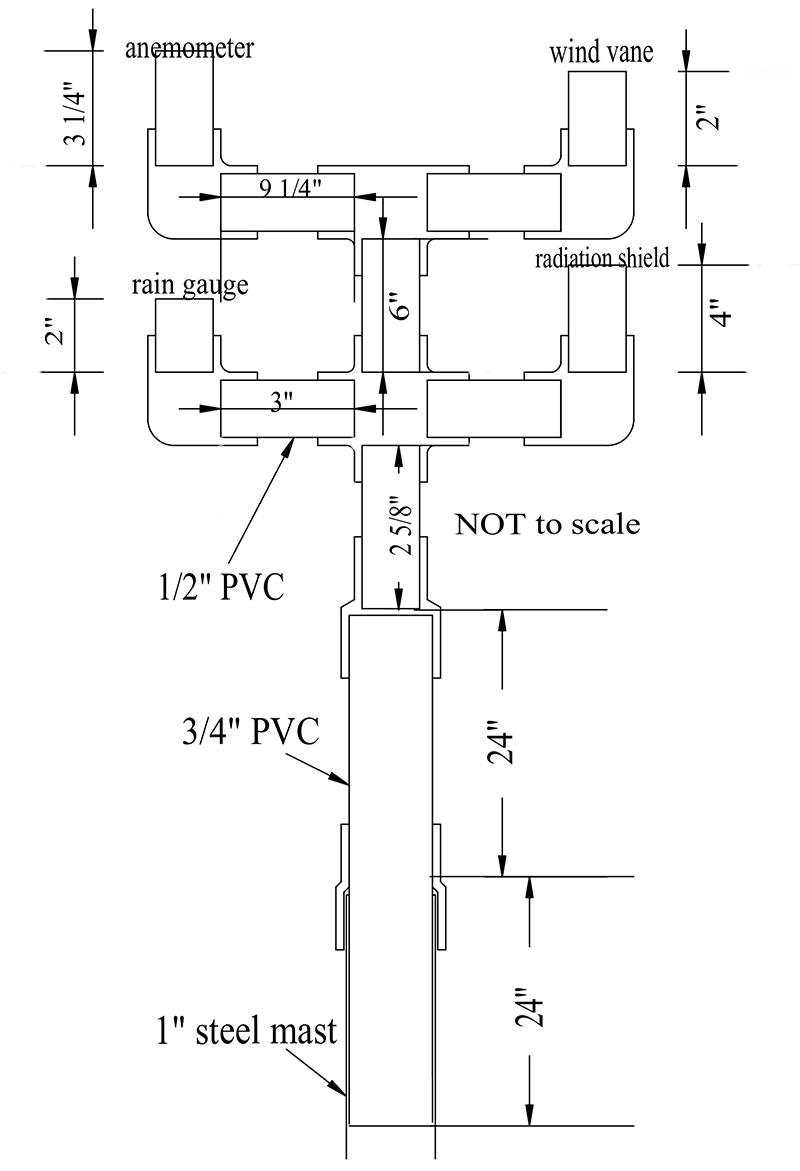
FIGURE 16. Drawing of the mounting structure for outside sensors.
For connecting all the instruments, I used 1/2” I.D. (schedule 40, thick) pipe, connecting this to four feet of 3/4” pipe which goes down to eight feet of one inch steel antenna mast. The 3/4” pipe overlaps two feet inside of the steel mast.
I used plastic for two feet above the steel mast so that the magnetic steel mast would not influence the compass sensor. When I see how much the 3/4” PVC pipe bends in a 40 MPH wind, I think something larger would be better. Maybe some larger pipe outside the 1” pipe would do it, giving two layers of pipe. My 3/4” pipe hasn’t broken yet and has survived over 50 MPH winds. I hate to remake the whole thing to replace it, but if I was starting from the beginning, I would use fatter pipe or two layers of pipe.
Where a pipe connector faces up or horizontally, I glued it with clear PVC cement. Where an instrument connects to tubing and where a group of instruments has a connector facing down, I used a brass setscrew, locking into a dimple in the pipe. This way, water can’t find a way into the piping, but some disassembly can still be accomplished for servicing reasons. I’ve learned that if you think you’ll never need to get something apart, you are sure to eventually need it apart. I used 30 feet of category 6 Ethernet cable. I cut off one end, and passed it through some 1/2” I.D. flexible ultraviolet-resistant PVC tubing using an electrician’s fish tape. I then spliced the cable wires to the four feet of wires coming out of the instruments.
Below each place where the wires come together, I combined the 5V and the ground wires, so at the bottom of the PVC there is only one 5V and one ground wire. The plug end attaches to the weather station readout unit. This reaches from my fireplace mantle, through a hole in the wall, and up to the mast attached to the chimney of my two-story house. I read that more than 25 feet can cause problems for I2C communications, and I have had some problems (more about that coming), but I’m not sure that the distance caused any trouble.
At the bottom of the PVC going to all the instruments and at the bottom of the mast I made two jam nuts (Figure 17).
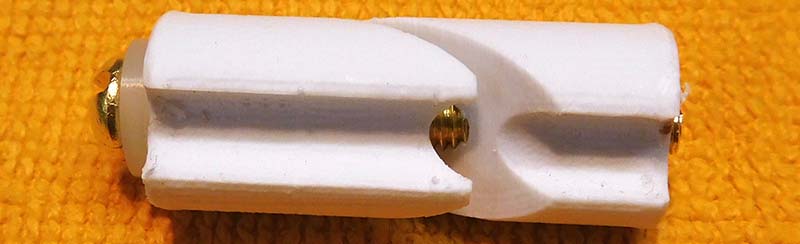
FIGURE 17. Jam nut for anchoring the upper end of the outside cable with cover.
These hold the wire to the side of the pipe and prevent pulling on the wires from disconnecting the more fragile connections to the electronic parts.
A note on threading for machine screws: The 3D prints leave the holes a little small. They need to be drilled out to the proper diameter and tapped. I use a gun tap. It has two flutes and pushes the cuttings out ahead of the tap. It can only be used on holes that are open at both ends.
It can be chucked into an electric drill and slowly motored in and back out again. No turn-backup-turn-backup and out to clear the flutes. It saves a bunch of time and is easy.
Electronics
I designed a small printed circuit board (PCB; Figure 18) that plugs into the Arduino Mega 2560 board, holds the female Ethernet socket, and has female headers that the Adafruit 3.5” TFT display plugs into.
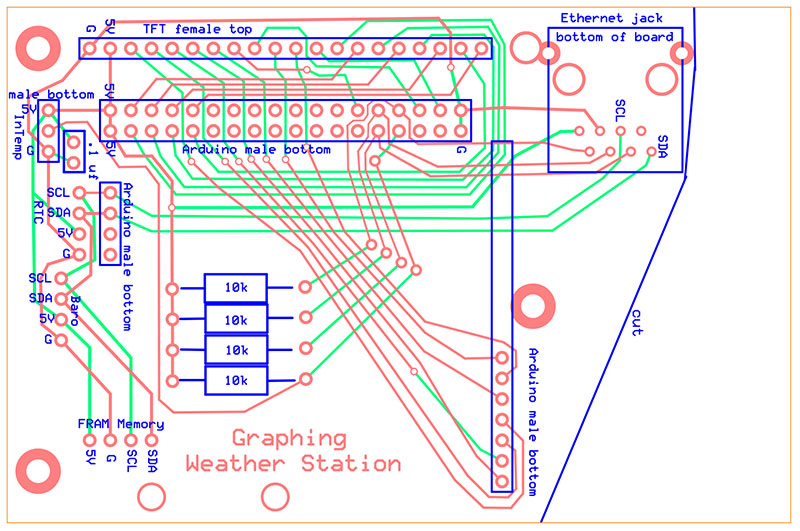
FIGURE 18. Printed circuit board to connect TFT display and the Arduino board.
I’m using the TFT end with the parallel pins to connect to the PCB. This end of the display has the pins D0-D7 on it. The PCB also has a header strip for the indoor sensor, and short wires to connectors for the RTC and the pressure sensor. The FRAM non-volatile memory is attached to the PCB with small nuts and bolts, with jumper wires soldered between the circuit board and the breakout board for the memory unit.
The PCB is like a shield that connects the microcontroller to the display. Figure 19 shows the inside with the screen removed (including the FRAM memory attached to the PCB on the right) and inside the bottom wall with the atmospheric pressure sensor at the lower left and the RTC on the lower right.
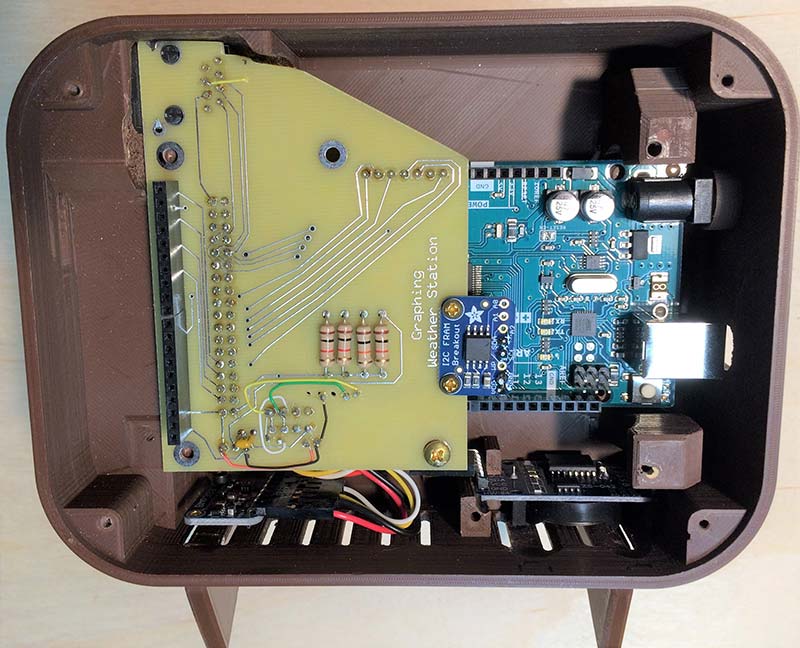
FIGURE 19. Inside the box with the TFT display removed.
Be sure to pay close attention to which side of the board things are mounted. The Ethernet jack is on the bottom of the board.
The circuit is in Figure 20.
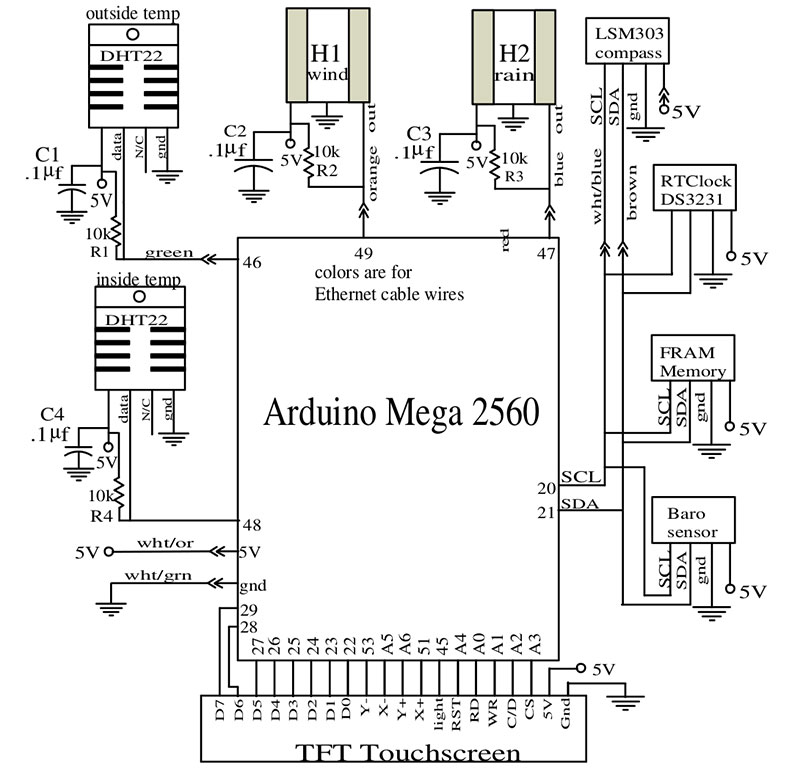
FIGURE 20. Circuit diagram for all of the weather station.
Much of the wiring is accomplished by the PCB. It’s important to note the colors of the wires for the Ethernet cable written in the circuit diagram. I cut the plug off one end and spliced the wires to the instruments inside the mast on the roof. The end with the plug on it plugs into the readout unit inside the house. The Parts List has the parts and where to find them.
I used mostly Adafruit products because they have such good customer support, software libraries, great information for connecting and programming, and example programs that help make sure it’s all working. By using their products, I reasoned I would have less chance of things going wrong that would be difficult to figure out. I’m an amateur, and I need all the help I can get.
The libraries they’ve developed made interfacing with all the sensors very easy, and without them I’m sure I would have been too overwhelmed to try to interface to all those sensors. They put so much into their products; I think they deserve the business. The RTC is not Adafruit, because I missed that they had one that was not a feather wing. The Hall-effect magnetic sensors and the outdoor temperature sensor need a 0.1 µF capacitor connected from the five volts to ground, and close to the sensors. These capacitors are wired to the leads just after they emerge from the bottom of the sensor mounts. The PCB is close to the indoor sensor already, so that capacitor is on the board.
Programming the Arduino
I tried to fill the code with lots of comments, explaining the functions of different parts of the code and adding information to help interface to the sensors. This project is a great exploration of sensors, touch screen, and color TFT displays, and with it I learned so much that I can adapt to other projects later.
At the beginning of the code, there are comments that lead you to making conversions to metric by simple commenting some and un-commenting other lines of code.
I found it very useful to load the example programs for each of the sensors to make sure everything was working well. This will also help you determine the average atmospheric pressure for your altitude. Starting with Mr. Andrew’s code, a number of error messages kept it from compiling. I found it necessary to edit six of the library files because of conflicts with each other and to customize some sections to the hardware that I’m using.
I made a folder (c:\weather) and placed them there, and put the path for two of them in the define statements. That way, if I update the library files, those files will be untouched (except that I left the edited Adafruit_LSM303_U.cpp library file where it started, since it didn’t like my moving it). These edited files are included with the downloads for this project.
Problems in Weather Land
I had problems for a while with the MCU freezing up after a number of hours of working just fine. That meant everything happened thousands of times, and then all of a sudden quit. To help find the problem, I put in a SpecialDelay() routine to print a number on the screen for different parts of the program. When the program froze, the number of the place right before it froze would be on the screen. Instead of finding the problem, it seemed to partially solve the problem. I thought it might be because that routine delayed a little, but substituting this routine for just a delay didn’t work.
As the project progressed, I found that it did freeze after two or three days of operation. The number that showed the place before freezing was different for different incidents! As it turns out, it was partially a problem of the memory crashing: The stack ran into the fragmented heap.
The strings were the problem. I created more free memory where I could, and then reserved space for the full length of the strings to eliminate fragmentation and holes in the heap.
Putting the formation of the strings into functions helped because this then happened in the stack, which gets cleared when the function exits. Learn.adafruit.com had great information that helped me solve this.
This partially solved the problem. Editing the LSM303 compass library file made a time-out adjustment to some while statements which as they were could allow loops that could never exit if things didn’t go right. This improved it some more, but it still froze sometimes. My SpecialDelay() routine found that it was the compass sensor that was doing it the most often.
Even so, the program would freeze up in 4-5 days. Since I couldn’t seem to stop this completely, I found a workaround. I installed a FRAM non-volatile memory, and each time the bulk of the data is logged, the data and critical variables are backed up. When the unit is started up, it restores the backup, and everything is initialized to where it left off.
I also used a watch dog timer, so that if it freezes up for more than eight seconds, the unit will automatically reset, and then take up where it left off using the backed-up data and variables. This not only solved the freezing up problem, but now if there’s a power outage or I reprogram the unit, everything takes up where it left off.
Making the Weather Instruments
I used a 3D printer to make most of the parts of the weather instruments and for the electronics case. I used Autodesk Fusion 360 to design them. This is a great program that is free if you’re using it for hobby purposes. The .stl files are included in the downloads, and also information to access the Fusion 360 designs. You can upload the .stl files to a 3D printing service, and have them print everything for you.
The outdoor components of the weather station are mostly printed in ABS plastic. I printed the parts with usually 1.2 mm wall thickness, and then the thin parts are printed solid. I used 35% infill in places that didn’t print solid. The printed weather instruments have to take some stress being out in the weather, and they need some strength. I used clear PVC pipe cement to glue the parts, as this performs some solvent-welding in the process of gluing, making the glue joints quite strong.
The outer diameters of the bearings fit by friction in the anemometer and the wind vane. I found that setscrews slightly distort the bearings and then they don’t turn freely. So, friction fit is the way to go.
You can also make everything without a 3D printer, and use my design files to get dimensions and ideas. Corrosion resistance of the materials prevents weather damage. Magnetic materials need to be avoided since some of the sensors are sensitive to magnetic fields. Acrylic, copper, and brass would be useful materials for this. The dimensions are not critical; they just need to hold on to sensors and magnets and then be calibrated if the dimensions are different.
A handsome case for the display could be made out of wood. If you need an excuse to get a 3D printer, this may be it. If you like to make things, you’ll be amazed at all the stuff you’ll find yourself making with it.
This was a very fun project. I find it fascinating to look at all the visual information that I’ve gotten from my instruments. I love to see what the wind has been doing during the night as well as the day.
he rainfall recording helps me know how much to water my yard. The furnace/air conditioner functions can be observed. The humidity has an interesting inverse relationship with the temperature.
The atmospheric pressure is fun to observe as the weather gets ready to change and correlates with the rainfall. NV
Parts List
| |
Real Time Clock DS3231 |
|
eBay |
382781644430 |
| |
Magnetic Compass Sensor LSM-303 |
Adafruit 1120 |
Digi-Key |
1528-1173-ND |
| |
3.5” TFT Touchscreen Display |
Adafruit 2050 |
Digi-Key |
1528-1470-ND |
| |
I2C FRAM Breakout |
Adafruit 1895 |
Digi-Key |
1528-1035-ND |
| |
Six-Wire Slip Ring |
Adafruit 775 |
Digi-Key |
1528-1157-ND |
| |
Hall-Effect Sensor, Latch |
APS12205LUAA |
Digi-Key |
620-1964-ND |
| |
Hall-Effect Sensor, South Pole |
APS11205LUAATI |
Digi-Key |
620-1830-1-NDdigi |
| 2 |
Temperature/Humidity Sensor, DHT22 |
Adafruit 385 |
Digi-Key |
1528-1504-ND |
| 30 feet |
Cat 6 Ethernet Cable |
|
Digi-Key |
N201-030-GY-ND |
| |
BMP388 Barometric Pressure Sensor |
Adafruit 3966 |
Digi-Key |
1528-2733-ND |
| |
Ethernet Connector Female PCB Mount |
A-2004-2-4-LPS-N-R |
Digi-Key |
AE10387-ND |
| 3 |
Neodymium Magnets 3/16 dia x 3/16 L |
|
kjmagnetics.com |
D33 |
| |
Arduino Mega 2560 |
|
Digi-Key |
1050-1018-ND |
| 2 |
Bearing Stainless Steel, 0.25” I.D. x 0.5” O.D. |
|
McMaster-Carr |
R188 2Z |
| 25 feet |
PVC Flex Tubing UV Res, 1/2” I.D. x 5/8” O.D. |
|
McMaster-Carr |
5231K88 |
| 4 |
10K 1/2 watt Resistors R1-R4 |
|
Digi-Key |
CF12JT10K0CT-ND |
| 4 |
0.1 µF Ceramic Capacitors C1-C4 |
|
Digi-Key |
445-173583-1-ND |
| |
1 x 20 Header Connectors Female |
|
Jameco |
308567 |
| |
2 x 18 Header Connectors Male |
|
Jameco |
53532 |
| |
Single Row Header Strip |
|
Jameco |
68339 |
| |
Printed Circuit Board |
|
ExpressPCB |
|
| |
Center Drill |
|
McMaster-Carr |
2915A52 |
| |
Gun Tap, 4-40 Thread |
|
McMaster-Carr |
2523A444 |
The .stl files are in WeatherStlFiles.zip with the downloads, which includes other files useful for this project. The Fusion 360 design files for the Weather Station are also included in the zip file in the downloads. If you have issues downloading the files, contact the author at
[email protected] for assistance.
Downloads
What’s In The Zip?
PCB Files
Code Files
Links
Fusion 360 design files for the Weather Station