Work areas usually have multiple power strips ganged together and connected to the same outlet. Various devices are connected to these strips, including computers, lights, coffee pots, space heaters, etc. Environmentally conscious persons ask, “How much power does my work area consume?” Safety conscious persons ask, “Am I overloading my circuit?” Calculating the answers requires two basic measurements: the voltage supplied to the circuit, and the amperage consumed by the circuit. Measuring AC voltage and, particularly, amperage with a multimeter is a potentially dangerous diagnostic for laypersons.
Wouldn’t it be nice to have a self-contained volt/amp meter that displays the values on a webpage?
One Solution
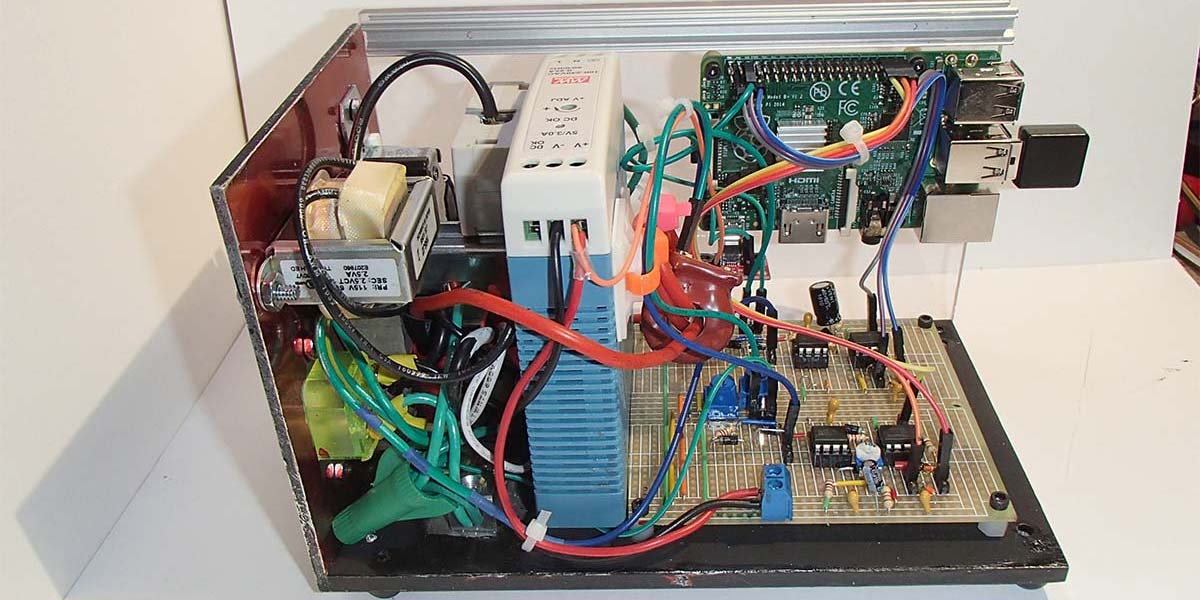
Voltage sensors and current sensors produce signals that can be conditioned and converted to digital form. A Raspberry Pi can read the conditioned and digitized sensor outputs, compute the corresponding measurements, provide a wireless access point, and display a webpage showing the voltage, amperage, and apparent power of the circuit. This article presents one implementation of such a solution (Figure 1).
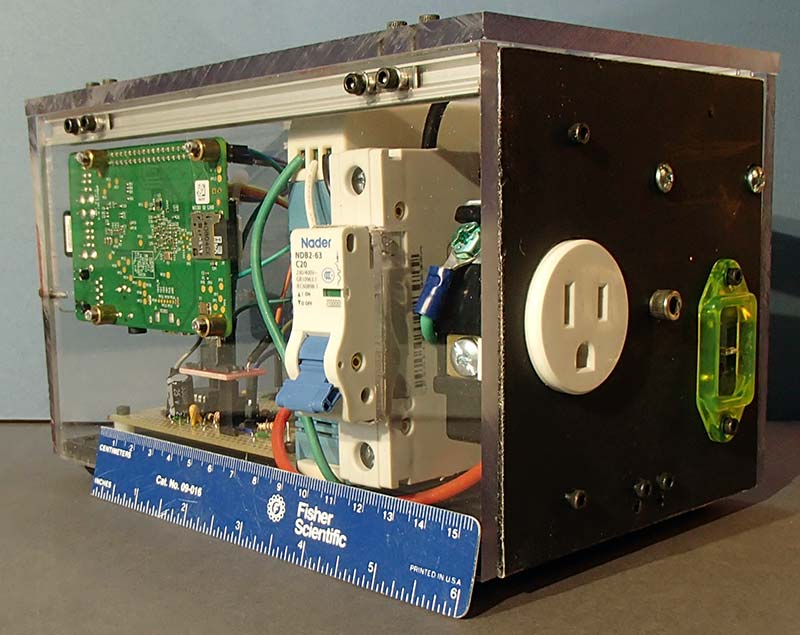
FIGURE 1. Completed prototype.
Circuit Description
AC (Mains) Interface
This part of the device is hazardous. If you are not a qualified professional, find one to work with you. The high voltage schematic is shown in Figure 2.
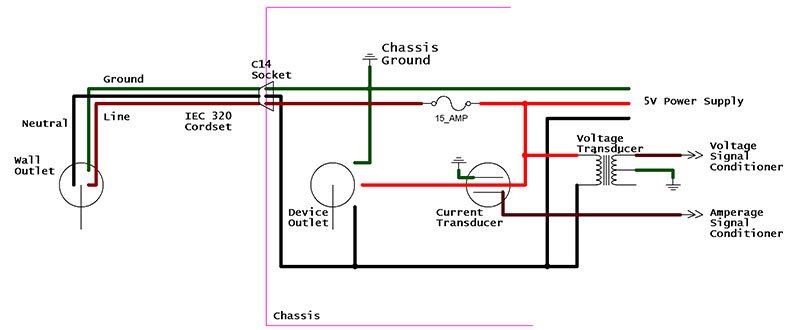
FIGURE 2. High voltage AC schematic.
Power to the device and to the outlet enters the housing at an IEC 320 C14 socket via a 14 AWG IEC 320 C13 cord. All high voltage conductors are ultra-flexible, silicone insulated 14 AWG wires. These flexible wires minimize crowding and wire stresses at the high voltage end of the chassis.
A 15 amp DIN rail-mount circuit breaker protects the high voltage circuit. The ground is clamped to the aluminum chassis base with a single-wire lug. Anti-oxidant is applied to the lug chassis contact surfaces to preserve and improve the conductivity at the contact area. Use of a back-wire, screw, and clamp single-socket receptacle (see Resources) is recommended because ultra-flexible wires have many fine strands that can form bird cages or crush when attached to side-screw receptacles.
The current sensor is a through-the-hole current transducer. These non-intrusive devices are preferred over devices that make hard-wired connections to high voltages. Depending on the transducer used, multiple loops through the hole may optimize transducer output.
The voltage sensor is a 2.5V center tap transformer. I grounded the center tap and used a single 1.25V lead for the sensor signal. Power to the low voltage DC components is supplied by a 5V DIN rail-mount power supply.
Signal Board
The transducers connect to the signal board where the transducer outputs are conditioned and digitized. For clarity, the circuit schematic diagram for the signal board is presented as two separate sub-circuits in Figures 3 and 4.
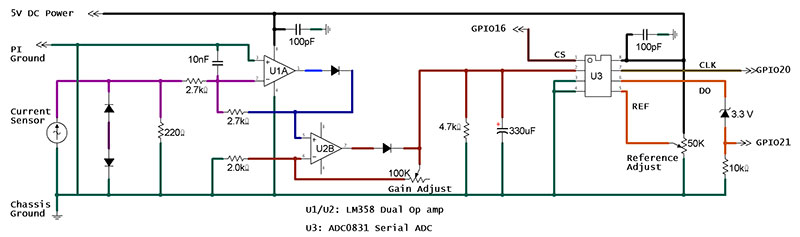
FIGURE 3. Signal board, current measurement sub-circuit.
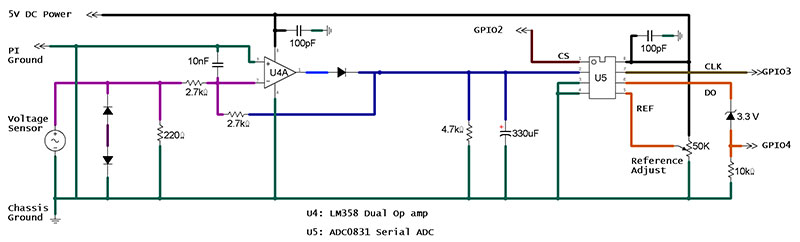
FIGURE 4. Signal board, voltage measurement sub-circuit.
Signal Conditioners
Connected as shown, the sensors will output low AC voltages that are proportional to the sensor inputs. Both outputs must be rectified. In the case of the current sensor output, the signal is also amplified. Both signals need filtering to reduce ripple.
The signal conditioners use a rectifier design that eliminates diode drop — a shortcoming of diode bridge rectification that interferes with the measurement of low AC voltages (see Resources). The op-amp used in the conditioners is the LM358 dual op-amp. The first stage has a unity gain in both cases.
Further amplification through the second stage is used in my current sensor’s signal conditioner, where the gain is adjustable through a 100K ohm potentiometer connected as a variable resistor. The initial resistance for the gain resistor will depend on the current sensor, but 50% is a good starting point. Additional amplification was not necessary for my voltage measurement sub-circuit.
Ripple is removed with RC filters. The values for the resistors and capacitors in these filters were empirically chosen to give acceptable ripple removal while maintaining a reasonable response to meaningful changes in sensor inputs.
Analog-to-Digital Conversion
Before the Raspberry Pi can interpret a conditioned signal, the signal must be digitized using an analog-to-digital converter (ADC). Finally, the ADC output must be constrained to 3V3 logic for GPIO pin compatibility.
The ADC chosen is the ADC0831: a serial output device that is easily controlled by the Pi. The reference (REF) pins (pin 8) are supplied by a potentiometer configured as a voltage divider. Initially, the Reference Adjust potentiometer should be set to deliver 5V to the REF pin on each ADC.
Junctions on the board connect to the Pi GPIO pins as labeled in the schematic. None of the Pi’s 3V3 or 5V pins connect to the board. A Pi ground pin is connected to the signal board’s ground, and all grounds within the enclosure tie to the chassis ground. The assembled project is shown in Figure 5.
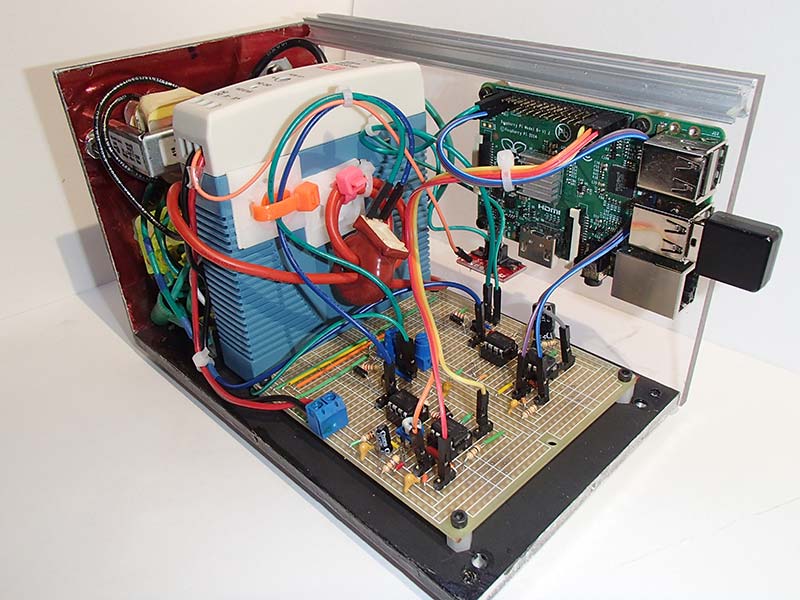
FIGURE 5. Assembled project
Raspberry Interface
The Pi is configured for public key-authenticated SSH access. During setup, I prefer a wired Ethernet connection and a remote SSH session.
A desktop GUI uses resources needlessly, so the Pi can be configured to run without one if resources are limited (for example, when using a vintage Pi like I did).
To avoid joining the crowd of compromised IoT (Internet of Things) device owners, change the password for both the Pi user and root. Verify that the Pi requires a password when running commands with sudo. If it doesn’t, it probably has a pi_no_password file in /etc/sudoers.d/. Edit it and comment (or delete) the line: pi ALL=(ALL) NOPASSWD: ALL.
I use simple low-overhead bash scripts for device control and data acquisition in this project. Update the system and install the bc package: sudo apt install bc. This package is used for doing floating point calculations from bash.
The Clock (CLK), Chip Select (CS), and Data Out (DO) pins on the ADCs connect to the PI. The GPIO pins associated with the CLK and CS pins are configured as outputs. The GPIO pins associated with the DO pins are configured as inputs.
GPIO pin setup is configured at boot, which is discussed later. By convention, I keep all scripts in a directory at /home/pi/bashScripts/. The pin configuration script is named configPins. In the script, input pins are configured as follows (where <GPIO#> is replaced with the GPIO pin name, e.g., GPIO4):
echo “<GPIO#>” > export
echo “in” > /sys/class/gpio/<GPIO#>/direction
Likewise, for output pins:
echo “<GPIO#>” > export
echo “out” > /sys/class/gpio/<GPIO#>/direction
chown root:gpio /sys/class/gpio/<GPIO#>/value
chmod 660 /sys/class/gpio/<GPIO#>/value
Performing a Conversion
The ADC0831 uses the conversion timing shown in Figure 6.
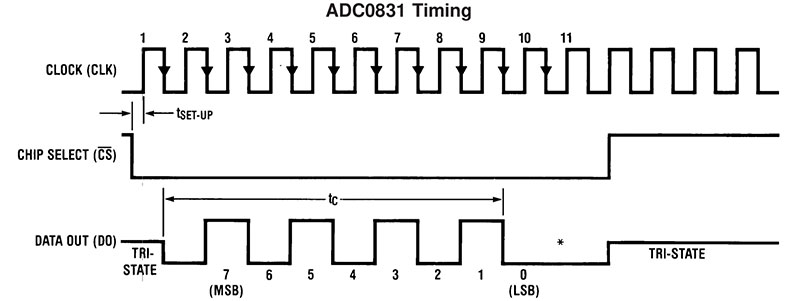
FIGURE 6. ADC8031 timing diagram (National Semiconductor datasheet).
Initially, the CLK is held low and the CS high. To initiate a conversion, CS is brought low and — after a short interval — the CLK is ticked high-low. From here, each time the CLK is ticked high-low, a bit will appear at the DO pin, sequentially corresponding to MSB → LSB.
Bytes from the amp measuring component and the volt measuring component can be continuously displayed using the readAmpsRepeatByte and readVoltsRepeatByte scripts, respectively. Note in the scripts that the byte value is accumulated with a simple loop:
# prior lines
for i in 7 6 5 4 3 2 1 0
do
echo “1” > /sys/class/gpio/gpio20/value
echo “0” > /sys/class/gpio/gpio20/value
bit=$( cat /sys/class/gpio/gpio21/value )
x=$(echo “$x + $bit*(2^$i)” | bc -l)
done
# subsequent lines
Calibration
The absolute voltage output of the sensors is not important. To obtain sensor readings, the output — as presented by the Pi using the readAmpsRepeatByte and readVoltsRepeatByte scripts — must be calibrated against known voltage and current sources. This requires independent measurements that are accomplished with a conventional multimeter and a variety of household appliances connected to the device in various combinations.
With these independent measurements, regression equations relating bytes to voltage and bytes to amps are obtained.
Initial Adjustments
The first step is to set the upper ranges of the signal board sub-circuits. Starting with voltage, tweak the Reference Adjust potentiometer until the Pi repeatedly echoes a sequence of bytes, reliably repeating a value between 150 and 200.
For amperage, a load needs to be applied that draws current near the maximum the device is expected to use in the future (I chose a flat iron together with a blow dryer). There are two choices for tweaking the value to around 200: adjust the voltage on the ADC reference; and/or adjust the gain of the second-stage op-amp.
My strategy was to set the gain resistor to ~75 ohms, then drop the voltage on the ADC REF pin until my byte reading was around 230.
Voltage Calibration
In most cases, the mains voltage is constant. I make the assumption that the sensor response is adequately linear within ± 10% of the typical mains voltage.
This assumption can be tested by monitoring the voltage and sensor response while, say, turning on a flat iron.
This leads to a simple one-point calibration. My multimeter shows my main voltage to be 120V. The average response at my Pi is 169. For my device:
Voltage = (byte value)(120/169)
Current Calibration
When the current calibration detailed in Figure 7 is performed, the response curve will vary considerably depending on gain, reference voltage, and component choices. Achieving useful calibrations requires trial-and-error span adjustments.
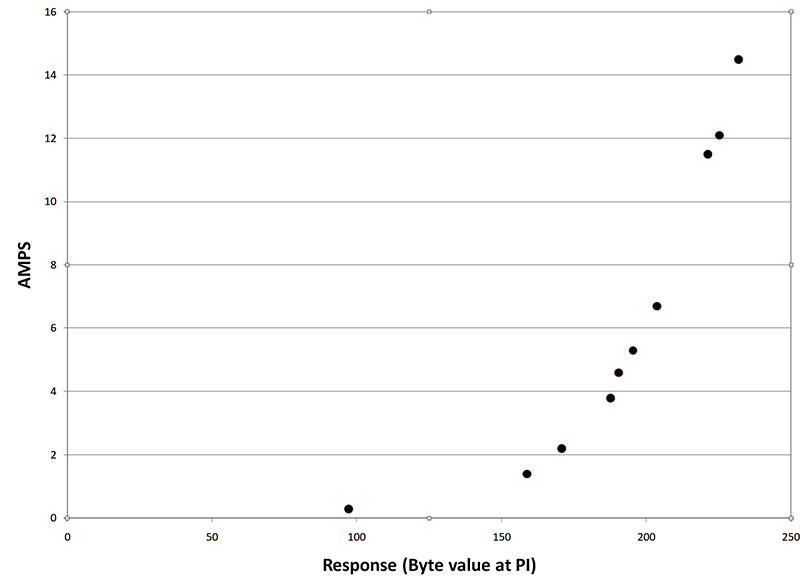
FIGURE 7. Characteristic curve; byte response vs. amperes.
To be useful, the amperage sub-circuit must be calibrated over the range of possible values, usually ~0.5A to ~15A. See the Amp Calibration.xlsx file in the downloads for an example of how to fit the data.
In my calibration, the response is roughly linear above a byte value of 190, and fits an exponential regression below 190:
Above 189: Amps = 0.238 * byte – 41.3
Less than 190: Amps = 0.009 * exp(0.032*byte)
Data Acquisition Script
For our application, we want to continuously read the amperage and voltage, and make the results available to our web application in real time. Our script will store the continuously generated values in two files: ~/bashScripts/aValue and ~/bashScripts/vValue.
A single script, startDAQ, performs this function for both current and voltage. Edit the script to reflect the specific amp and volt calibrations. Near the beginning of the script is where the applicable coefficients are placed:
# exponential coefficients (from calibration)
# Amps = c0*exp(c1*x) for Byte values > 189
c0=0.009
c1=0.032
# linear coefficients Amps = ax + b for Byte values <190
a = 0.238
b = -41.3
# Voltage proportion P = 120/Response@120 (from calibration)
# volts = x * P
P =0.708
Later in the script, the coefficients are used to convert bytes (x) to amps and bytes to volts:
# …
# (Re)place the amp result in a file Note: Piecewise function in my case
if (($x>189))
then
amp=$(echo “$a*$x + $b” | bc -l)
else
amp=$(echo “$c0*e($c1*$x)” | bc -l)
fi
printf “%0.2f” $amp > /home/pi/bashScripts/aValue
# …
# (Re)place the volt result in a file
volt=$(echo “$P*$x” | bc -l)
printf “%0.0f” $volt > /home/pi/bashScripts/vValue
Note that the aValue and vValue files are overwritten continuously as the outer while loop is reiterated. Here are the two lines of interest:
printf “%0.2f” $amp > /home/pi/bashScripts/aValue
printf “%0.0f” $volt > /home/pi/bashScripts/vValue
(Idea: A data logger could be created by appending to these files rather than overwriting them.)
The Web User Interface
First, install and configure nginx and php on the Pi (see Resources). Verify that php is functioning and that nginx uses index.php as the default document. Next, replace index.php with the project’s index.php. The php code will provide — in addition to volts and amps — the apparent power usage.
While ~/bashScripts/startDAQ is running, test the application by navigating to the Pi’s IP address. If all is well, the meter’s readings will be displayed. Mine are shown in Figure 8 (with the blow dryer on low).
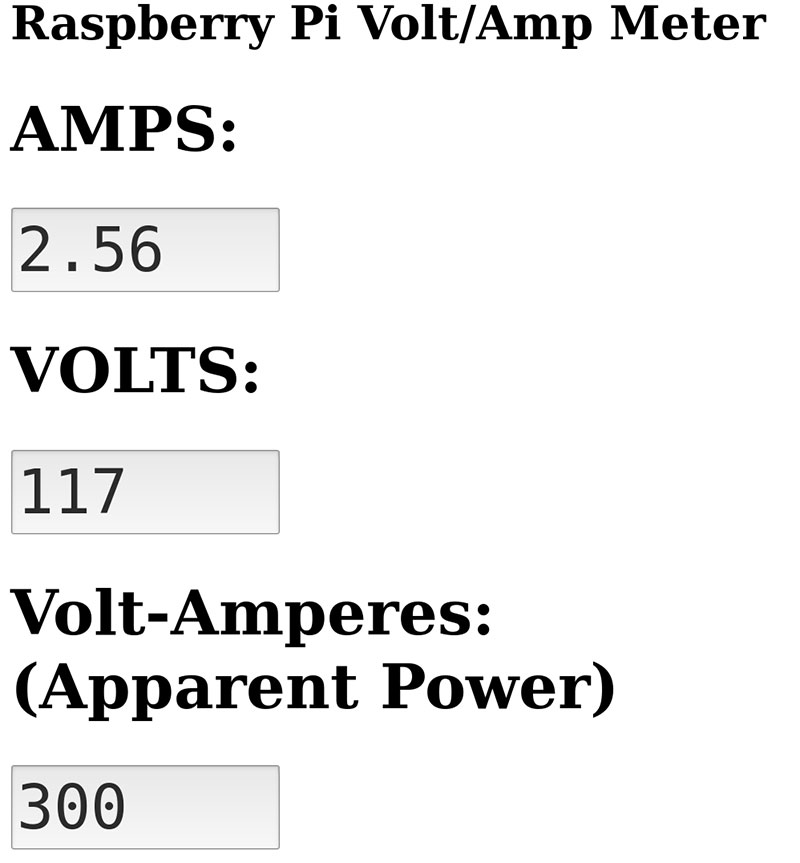
FIGURE 8. A simple webpage.
This can easily be improved; for example, with a color bar indicating low, medium, or high load. If a data logging variant of startDAQ were used, the webpage could show graphs!
Wireless Access Point
Because we can’t predict whether a user will have a local network available in the location they choose to use the device, we want the device to provide its own access point (AP).
The user simply logs into the wireless network created by the Pi (perhaps from a smartphone) and navigates to the home page.
If the Pi’s onboard wireless chip doesn’t support AP mode (see Resources), then a USB wireless adapter that does is required. I’ve always chosen adapters with the AR9271 chipset for AP applications.
The create_ap script (see Resources) is a good way to implement an access point. First, we need to install some prerequisites. From a terminal, run:
sudo apt install iproute2 iw haveged dnsmasq iptables hostapd raspberrypi-kernel-headers
Then, obtain and install create_ap:
mkdir Downloads/create_ap
cd Downloads/create_ap
git clone [url=https://github.com/oblique/create_ap]https://github.com/oblique/create_ap[/url]
cd create_ap
sudo make install
Running create_ap without arguments will provide a detailed usage manual.
This project’s makeAp script will create the necessary AP. The script makes a WPA2 access point with ESSID = meter on channel 11 with password = changeme. It assigns addresses to connected devices using DHCP. The AP subnet is, by default, 192.168.12.0/24, and the Pi’s webpage is at 192.168.12.1.
There’s a bonus: If eth0 is connected to a network with Internet access, the device will act as a wireless gateway too!
Starting at Boot
For a functional device, only three scripts need to be started at boot: configPins, makeAp, and startDAQ.
I use /etc/rc.local to auto-start the scripts. Simply make the final lines of the /etc/rc.local file read:
#…all prior lines
bash /home/pi/bashScripts/configPins &
bash /home/pi/bashScripts/makeAp &
bash /home/pi/bashScripts/startDAQ &
exit 0
Improvements
My project was built primarily using spare devices I had in my shop. Most notably, I used a 2014 vintage Pi Model B+ V1 updated to Raspbian GNU/Linux 9, Kernel 4.19.42. This legacy Pi is providing an access point, serving a php website, and acquiring data. It’s responsive, the heatsinks are only slightly warm, and the readings have been stable.
As always, there are many ways to improve this unit. Higher quality, better optimized circuit components (and a newer Pi) would be my next step. Now that the resistances of the potentiometers have been tweaked for optimal performance, replacing them with fixed resistors would make the device more resilient.
The low voltage circuit (including the Pi) draws about 320 mA, and the circuit would perform well without the fancy rail-mount power supply (but it looks great). The transformer used for the voltage sensor is also oversized.
The chassis could be made considerably more compact by moving the signal board to a DIN rail-mount enclosure. The Pi could then be mounted on the side opposite the high voltage section. A cubic chassis would result from careful planning.
The current sensor is a critical component and models vary considerably. Mine was salvaged from an industrial control and is better suited to a current range of 5 to 50 amps. To overcome the shortcomings of this sensor at low loads, I looped the line conductor through the hole multiple times. This hack works, but a sensor designed for my current range would improve the shape of my calibration curve.
About the Case
Having covered the “volts,” let’s look at the “nuts.” Clear cases will always make your friends and family proud, and they are a tasteful addition to any décor (Figure 9).
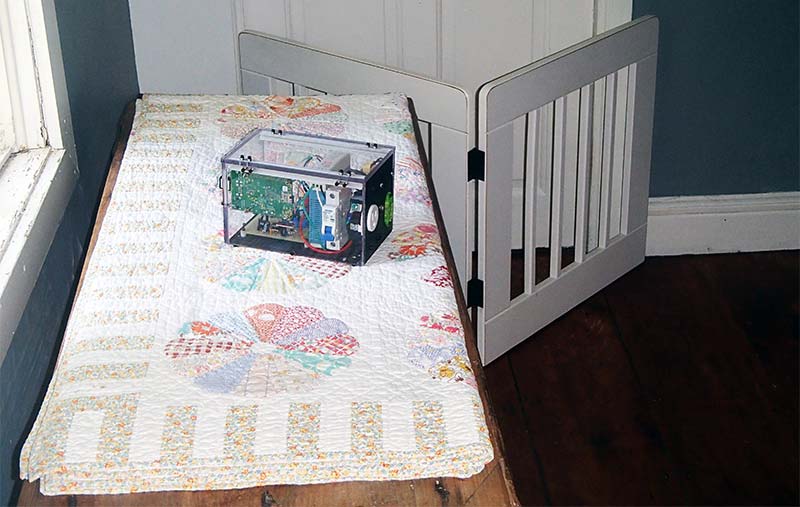
FIGURE 9. A tasteful decorative touch.
Everything was made on a legacy 3D printer ... also known as a milling machine (Figure 10). This machine will make your 3D parts in stainless steel if you prefer.

FIGURE 10. Old-school 3D printer (a.k.a., vertical milling machine).
I made a low-profile fixture that facilitated drilling accurately spaced, reproducible holes for joining the sides. Mills were used for making square openings for the Pi connectors and the circuit breaker. For the clear sides, I used 1/4 inch PETG sheet. PETG is much less fragile than PMMA (acrylic).
Conclusion
Well, that’s a wrap. I hope you’ll consider trying out my implementation of a self-contained volt/amp meter. NV
Parts List
- A sturdy housing that protects users from high voltages, allows space for neat wiring (particularly AC), and provides for a sound chassis ground.
- IEC 320-c13 power cordset and IEC 320-C14 panel mount socket.
- Single outlet receptacle — back-wired, screw-clamp type (not push-in!).
- Crimp terminal for the receptacle’s ground screw connection.
- Silicone insulated, ultra-flexible 14 AWG wire (black and red recommended).
- #14 THHN wire for AC grounding (green).
- #6 - #14 AWG, ADR-ALCUL type, single conductor, one-hole mount lug (for chassis ground clamp).
- Anti-oxidant compound (NOALOX).
- Wire nuts and shrink tubing.
- 15 amp circuit breaker that can be securely mounted within the chassis and can be switched off without opening the chassis.
- 5V low-ripple power supply (preferably > 5W).
- 120 to 2.5 VAC stepdown transformer with center tap.
- Through-the-hole current sensor suitable for measuring current between 1 and 20 amps.
- (2) LM358 op-amps.
- (2) ADC0831 analog-to-digital converters.
- (2) 3V3 zener diodes.
- USB Micro B male breakout board (for Pi power supply).
- Raspberry Pi (not tested with Pi 4).
- Solderable breadboard, hookup and jumper wire, printed circuit board terminal blocks, dual male header pins, miscellaneous capacitors, resistors, potentiometers, diodes, standoffs, etc.
- AP capable wireless NIC.
Note: I used DIN rail-mount components for the power supply and the circuit breaker, so I needed 5” of DIN rail. The base and front of the chassis were made with aluminum sheet stock. I used 1/4” clear PETG sheet to make the sides, top and rear; all of which were joined with 10 mm T-slotted framing and fittings.
Resources
Screw and Clamp Outlets
https://www.handymanhowto.com/electrical-outlets-side-wire-versus-back-wire
Precision Rectifier Circuit for CT Signal Conditioning, CRMagnetics
www.crmagnetics.com
Install nginx and php on Pi
https://www.raspberrypi.org/documentation/remote-access/web-server/nginx.mda
AP Compatible Wi-Fi Adapters
https://elinux.org/RPi_USB_Wi-Fi_Adapters
https://www.thinkpenguin.com/gnu-linux/penguin-wireless-n-usb-adapter-gnu-linux-tpe-n150usb
Create_ap Script
https://github.com/oblique/create_ap
Downloads
Code
Amp Calibration file
Scripts as Word docs