In this article, we'll show you how to connect your micro to MakerPlot in order to plot a single channel of analog data. Plus, we'll show you how you can scale the raw analog-to-digital converter (ADC) data into corresponding voltage levels. This means you don't have to do any math inside your micro's code; MakerPlot handles everything for you. Let's get going.
Preparing Our Uno and PC
For this and subsequent articles, we’re going to use an Arduino Uno as the reference microcontroller. To make things more interesting, we’re going to add a 10K potentiometer wiper pin to the A0 analog input pin and connect the other two pins to +5 volts and ground on the Uno. This will demonstrate how a varying voltage level from the pot gets translated into an A2D (analog to digital) value for our analog scaling example. Figure 1 illustrates the 10K pot hookup.
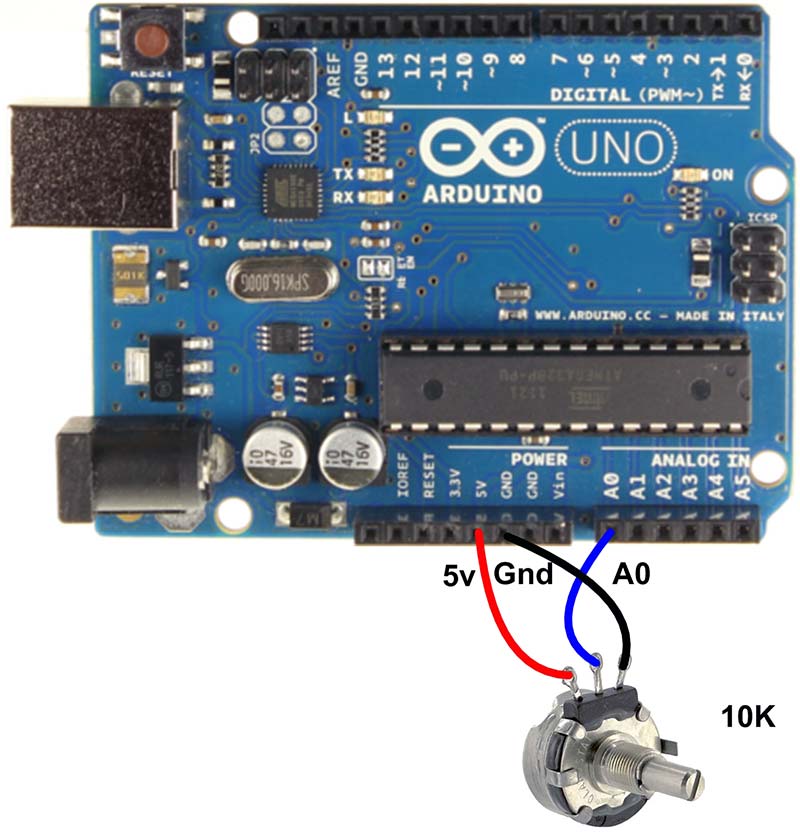
Figure 1. Arduino UNO setup.
We’re using the Uno because it comes complete with an FTDI serial-to-USB chip, along with a standard USB-B connector that makes it easy to create a serial connection to a PC using a standard A-B USB cable. Of course, you can use any micro you have that can output serial A2D data like the PICAXE, Raspberry Pi, or even one of the kits you may have built from a Nuts & Volts article.
Since we’re using a USB connection, you’ll also need to install a suitable USB driver on the PC side. For the FTDI chip, this is easily done by going to their website at www.ftdichip.com/Drivers/VCP.htm and selecting the proper driver. Make sure that the USB driver is installed before going any further or else things will probably not work unless your PC already has the driver installed.
Creating a Sketch
Next comes creating a simple Arduino sketch to configure and send the potentiometer’s A2D data from the Uno to the PC. Figure 2 shows the sketch code listing.
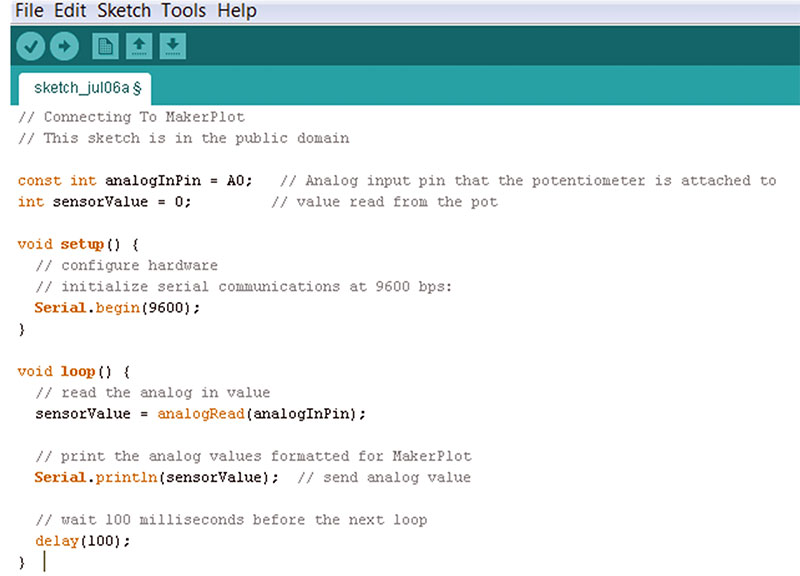
Figure 2. Arduino sketch for connecting to MakerPlot.
It begins by defining a variable called AnalogInPin that represents the A0 pin and configures the comm port with the Arduino’s Serial.Begin(9600) instruction. For the loop, it reads the A2D value at A0 and does a Serial.Println that outputs the ASCII value of the reading via the serial port. Note that the Serial.Println instruction also appends a carriage return after the ASCII A2D value which tells MakerPlot that this is the end of the data string for this data set. Finally, we delay 100 milliseconds and repeat.
Be sure to first verify then compile the sketch, then upload it to your Uno and check it against the Arduino IDE Serial Monitor program (Figure 3) to make sure it all works. Adjust the pot shaft to create different values that should range from 0 to 1023. If that all works properly, then you’re ready to connect to MakerPlot.
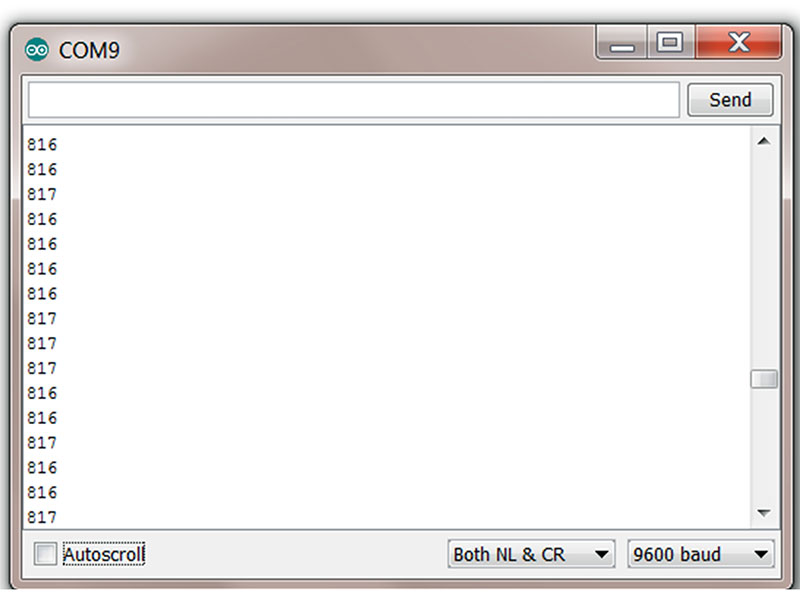
Figure 3. Arduino IDE serial monitor test.
Before you go any further, however, close the Arduino Serial Monitor program. This will free up the comm port for MakerPlot. Also, make sure that the virtual comm port number assigned to the Uno is 15 or lower.
Installing and Connecting to MakerPlot
If you haven’t already done so, go to www.makerplot.com and click on the Free Trial Download menu link to download MakerPlot as a 30 day free trial and install it on your PC. The trial version is exactly like the commercial version except that your comm port connection times out after three minutes. Then, you’ll need to reconnect for another three minute session. Otherwise, the trial version is the same as the commercial version. (If you go through Nuts & Volts at https://store.nutsvolts.com/project-kits/software/sku17212, you'll get a discount. Be sure and follow the instructions.)
Follow the instructions for installing MakerPlot and you’ll be ready to go to the next step.
Figure 4 shows the Desktop icon that appears after the installation is complete.

Figure 4. MakerPlot desktop icon.
Click on the Desktop icon and the Sign On Interface will appear (Figure 5).
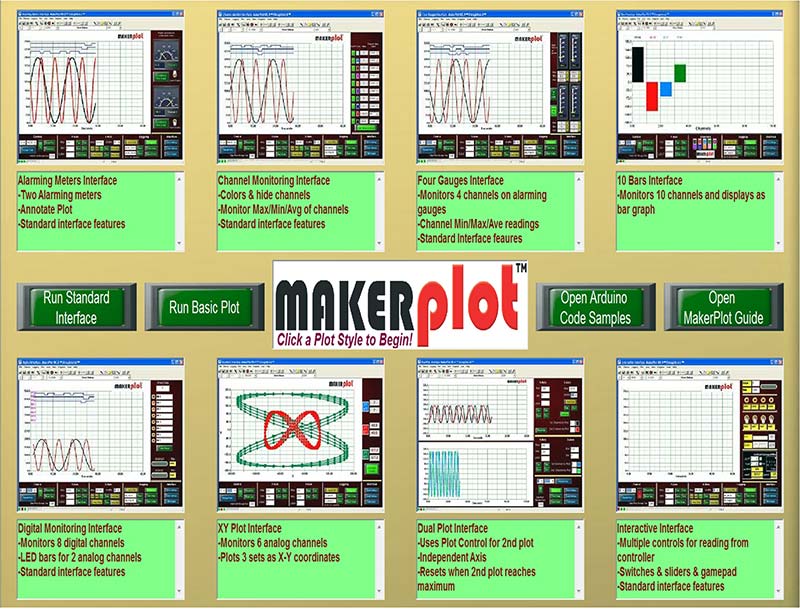
Figure 5. MakerPlot sign on interface.
Click on the Run Standard Interface button (middle left) to bring it up (Figure 6).
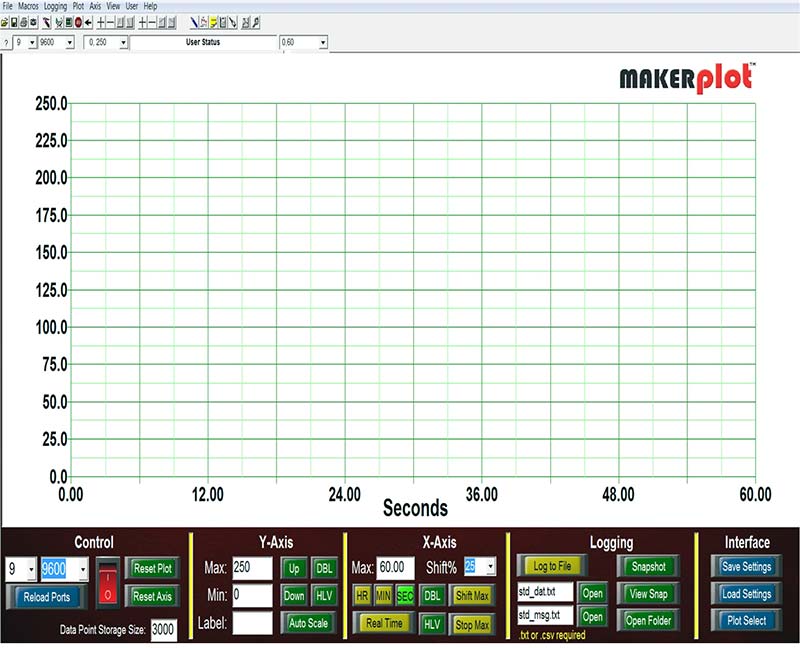
Figure 6. Standard interface.
Verify that the Control menu panel looks something like Figure 7.
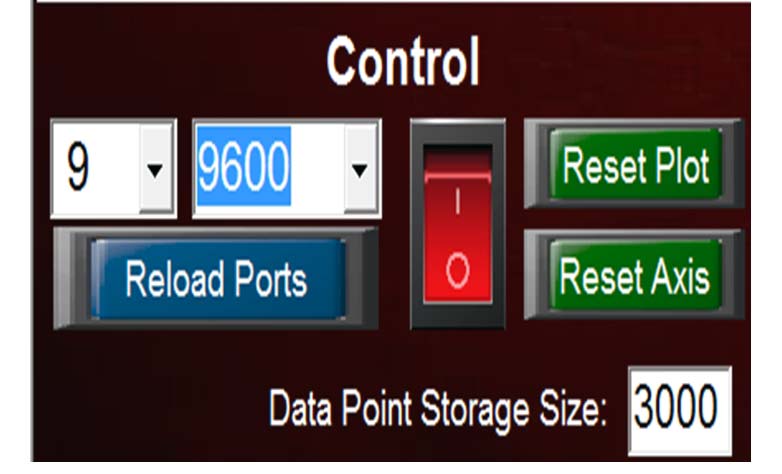
Figure 7. Control menu panel.
Our port number is 9. While yours may be different, it shouldn’t be over 15. If it is, go to the Windows Device Manager → Ports (Com & Lpt) → Arduino Uno R3 (comm port) and change it to a lower number.
Plotting Data
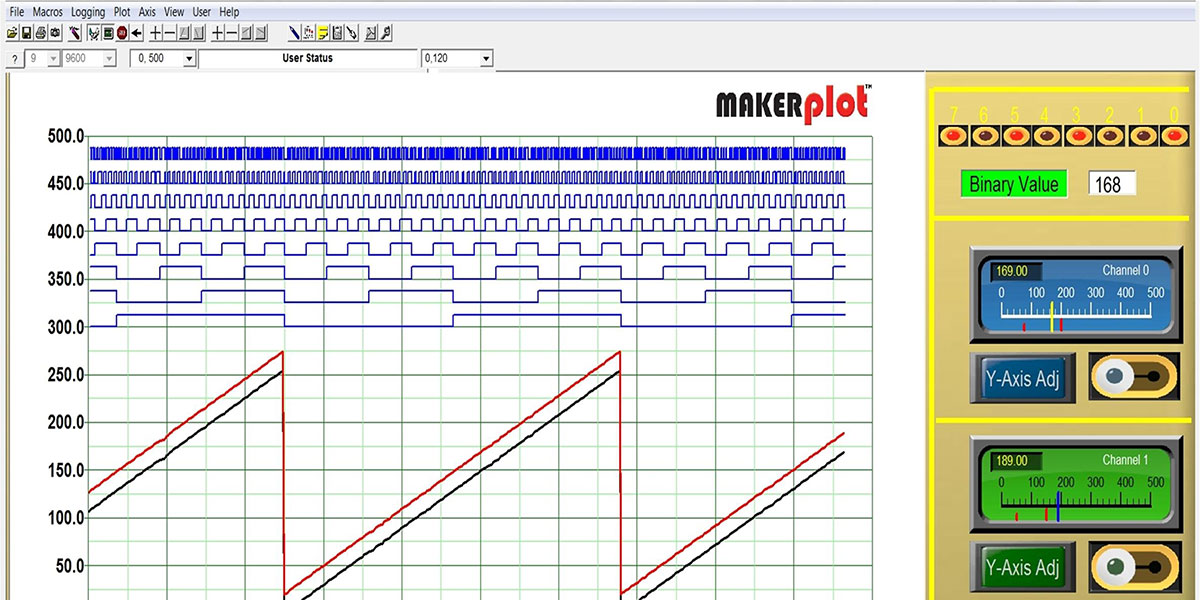
If the above looks good, then click the red rocker switch in the Control menu. It will change from red to green; you should see a black horizontal line being plotted across the Standard Interface screen. Adjust the pot shaft and the plot should begin to move up and down correspondingly (Figure 8).
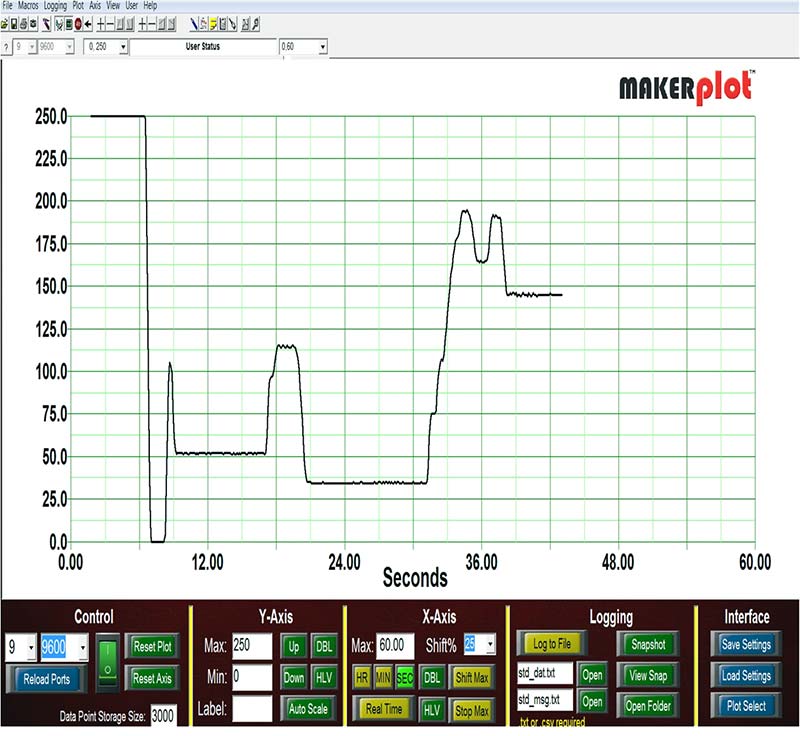
Figure 8. Begin plotting raw data.
You'll also need to adjust MakerPlot’s vertical scale to a different value to see the entire plot. This is done by clicking the DBL button under the Y-Axis menu (Figure 9) a couple of times until it gets to 1000, which is just below the pot’s maximum value of 1023; the Atmel 328P micro in the Uno has a 10-bit ADC, so the raw values range from 0 to 1023.
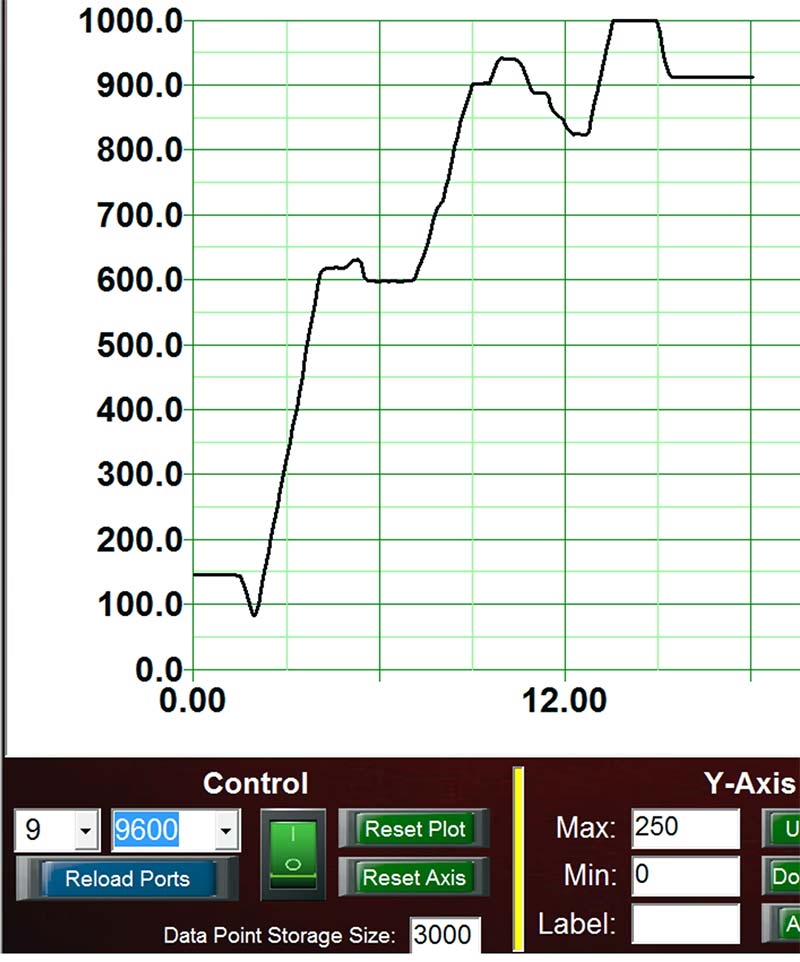
Figure 9. Increase Y axis to 1000.
If you want, you can fine-tune the Y axis setting by keying in 1050 in the MAX box. Just make sure to depress the Enter key after you put in this value. Now, the Y axis goes from 0 to 1050, and you can see all of the pot values going from 0 to 1023 (Figure 10).
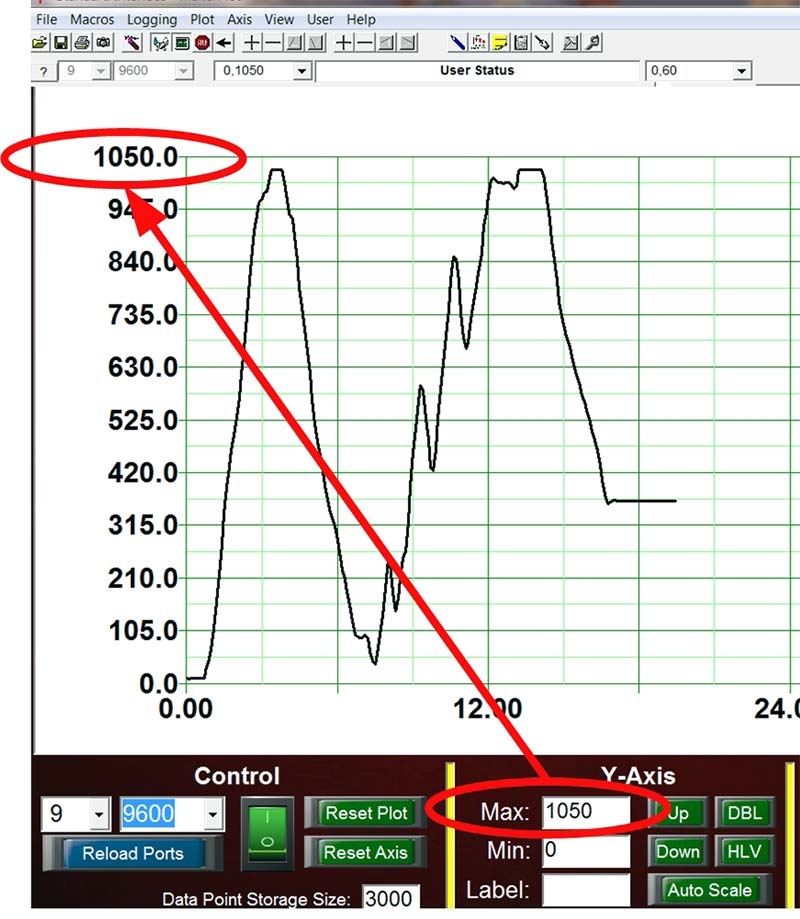
Figure 10. Y axis set to 1050.
Scaling the Analog Data
Up until now, we've been plotting the raw 10-bit A2D value that’s generated by varying the potentiometer shaft. Since our pot is connected between five volts and ground, the actual voltage that’s going into the A2D pin (A0) is what we really want to be plotting.
There are two ways to do this. One way is to code the math in the sketch and output the result via the serial link as a series of ASCII characters, or let MakerPlot do it. For this example, we’ll defer to the latter since it will be easier and will also show you a neat MakerPlot feature.
To scale the raw incoming A2D data, click on the pencil icon to bring up the Configuration menu (Figure 11).

Figure 11. Configuration menu.
Next, click on the Colors + Scales tab. You'll notice that the lower part of the tab has settings for all 10 of the analog channels (0 through 9). Notice that each analog channel has a different assigned color that you can change if you wish; each analog channel is selected (or deselected) with a check mark in the box to the left. However, since we’re plotting only one channel of analog data (channel 0 by default), the color is black. We can leave the other analog channels checked since there is only one analog channel coming into MakerPlot.
What’s important to note are the text boxes to the right of the color squares. These are what we need to change in order to scale the analog data to make it conform to the actual voltage level that the micro sees at the A0 pin. The first text box (the one that has a 1 in it now) is the multiplier adjustment value. Right now, it’s set to 1 meaning that whatever analog value comes into MakerPlot on channel 0, that’s what will be plotted, i.e., the analog value times one (x1). This holds true since our analog value range is 0 to 1023 at the moment — which is what we’re seeing on the plot.
Doing the Math
The value in the first text box needs to be changed to a decimal fraction to represent the true potentiometer voltage value. Here’s the equation to determine this fractional value:
X = 5.00 volts / 1024 steps
= 0.00488 volts / step
This means that each step of the A2D converter is worth 0.00488 volts. So, click on the first text box and key in 0.00488; make sure to push the Enter key (Figure 12).
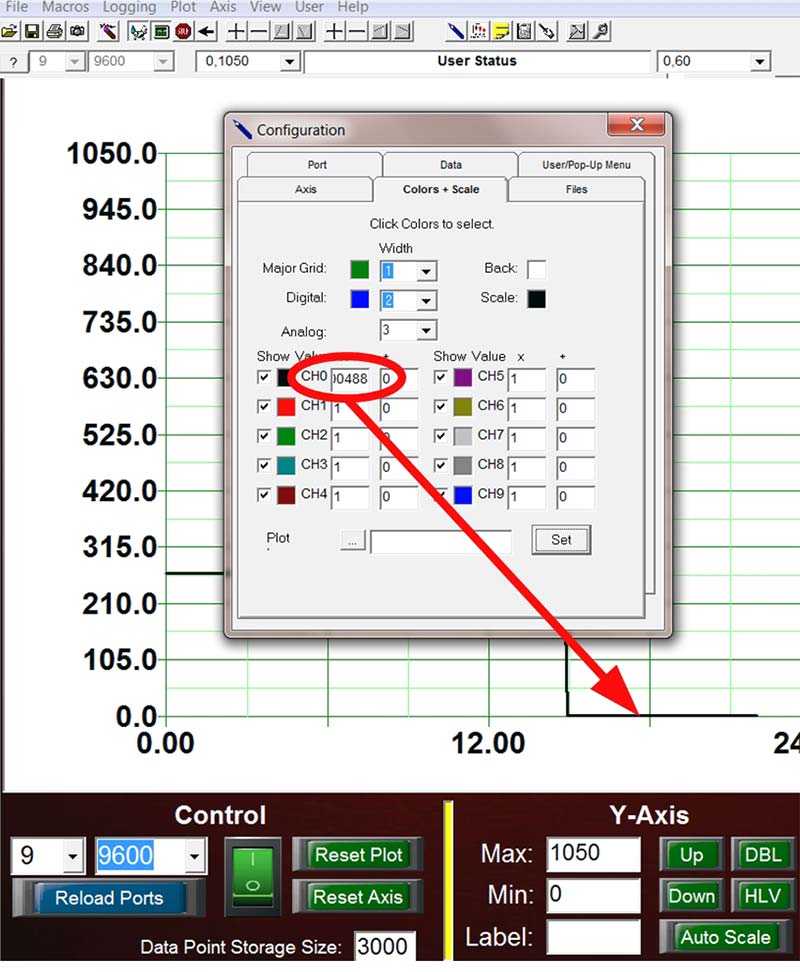
Figure 12. Scale to voltage.
Now look at the plot; it’s nearly at the bottom of the plot area. This is to be expected, since now we need to adjust our large Y axis vertical scale to match the new lower voltage range.
Readjusting and Labeling the Y Axis
The easy way to adjust the Y axis is to click the HLV button in the Y-Axis menu; this just gets the plot in the general range of its new zero to five volt range. A better way is to key in the value “10” in the MAX text box (Figure 13).
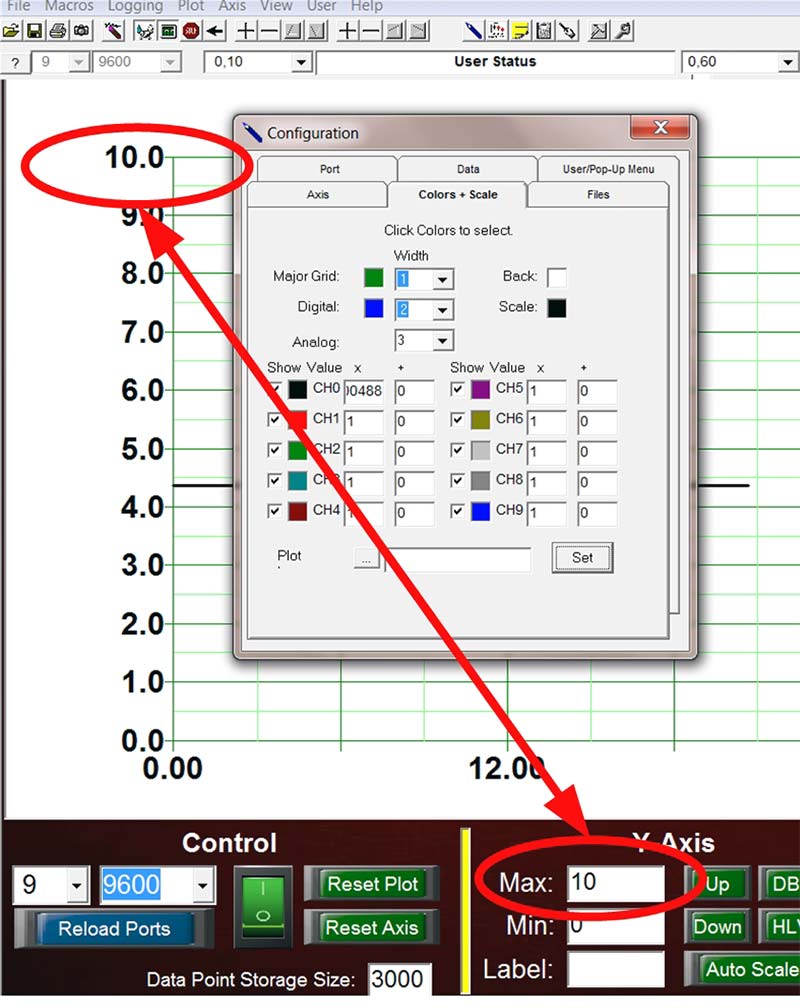
Figure 13. Scale to voltage.
You’ll see that the new value of 10 represents a Y axis value of zero to 10 volts. Plus, you can click the HLV or DBL buttons to automatically adjust the voltage scale up or down by half or double, respectively.
We’re still not done. What remains is to label the Y axis properly — in this case, to “Volts.” To do this, simply key in the word Volts in the Label text box and hit the Enter key (Figure 14).
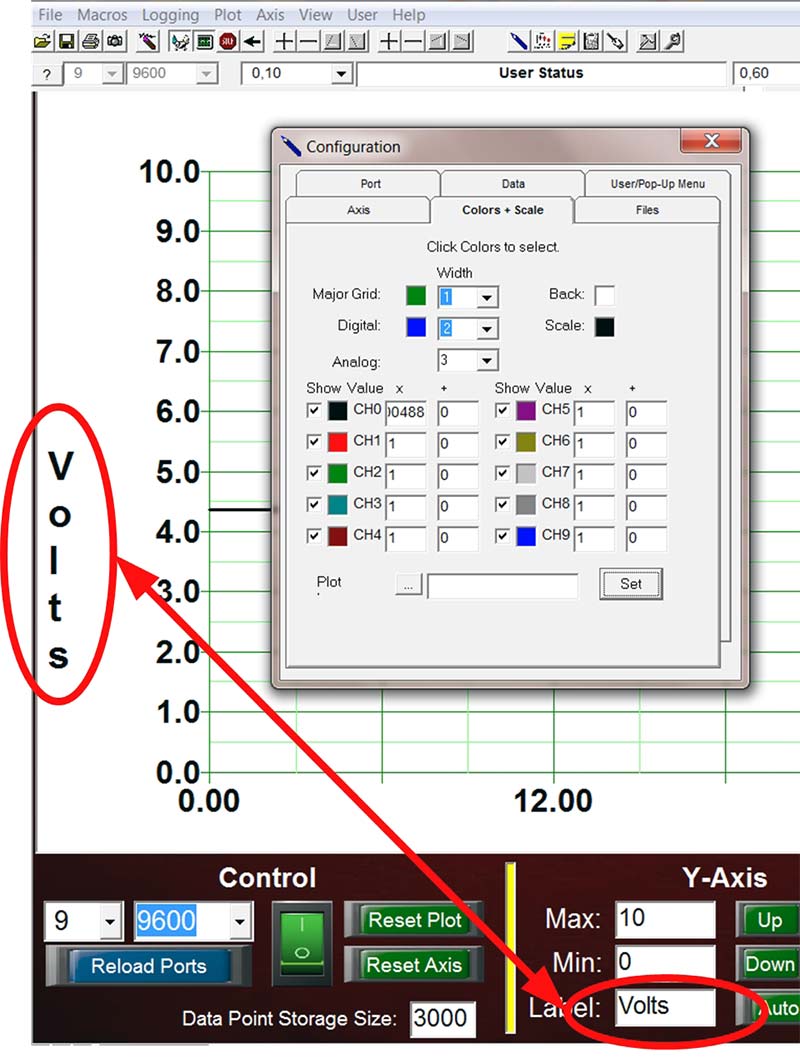
Figure 14. Label Y axis.
Now, the Y scale represents the voltage produced by the potentiometer.
Adding Bias to the Plot
One final thing before we conclude on this topic is how to use the bias setting text box. Right now, it has the value 0 in it.
Since we’ve adjusted our multiplier value, our analog data (correctly) goes from zero volts minimum to +5 volts maximum. However, we can add a bias — either positive or negative — to this range by keying it into the text box just to the right of the previous text box where we keyed in our 0.00488 value.
The bias text box has a + label at the top, but the value you key in can be either a positive or negative value; it can be a whole, fractional, or combination whole-fractional value.
We’ve keyed in a value of 1 (positive) into the bias text box to illustrate what happens to the plot (Figure 15).
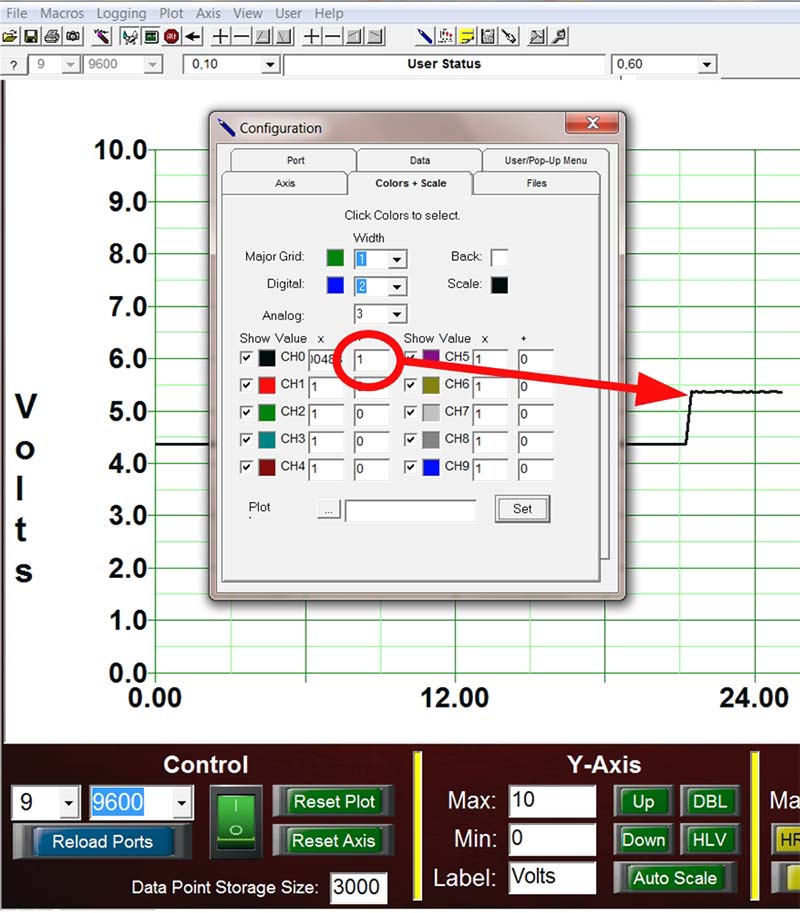
Figure 15. Add positive bias.
Notice the plot jumps up one volt from where it was originally. Now, we’ll key in a negative value of minus one (-1) and notice the plot falls one volt from the actual A2D voltage value (Figure 16).
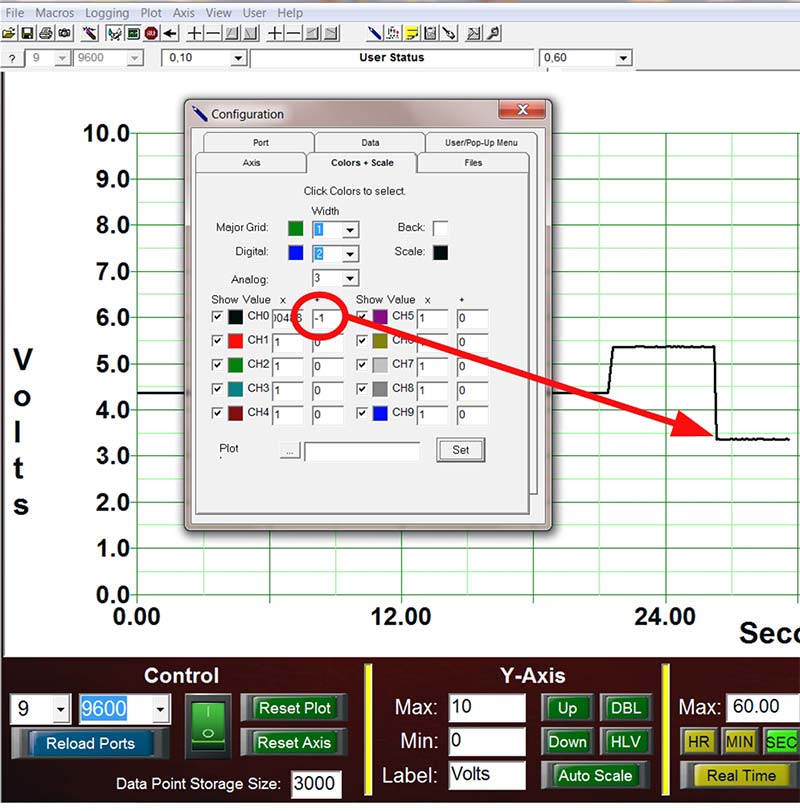
Figure 16. Add negative bias.
Finally, we key in a 0 just to get things back to normal.
Having the ability to set a bias level for your analog data has many advantages, since you may want to represent negative voltage data that can’t conveniently be done with a standard A2D setup. Once again, you can key in both whole numbers and decimal fractions — not just whole numbers.
Conclusion
What you’ve learned in this article is how to connect to MakerPlot and how it can be configured to plot one channel of analog data from your micro. We also showed you how to correctly scale and bias your analog data to represent the voltage going into the micro’s A2D converter. To help you further understand what’s happening, there are several videos on these subjects on the MakerPlot website at www.makerplot.com. After you arrive, just click on More....then Videos.... then the Basic Plotting and Learn video menu links. You’ll be treated to video examples of these subjects and a lot more.
In the next article, we’ll expand on our Uno setup to show you how you can play back the data generated by the potentiometer adjustments and how to data log all of it to an Excel file. We’ll show you how to add digital signals to the mix, as well.
Remember, MakerPlot is available as a free 30 day trial download from www.makerplot.com. If you like what you see and what it does, you can order it from the NV Webstore at a discounted price.
That’s all for now, so just remember: Got Data – MakerPlot It! NV