Now that other states (like Washington D.C.) know they are not exempt from earthquakes, more people are interested in seismic activity. Personally, I have been using seismographs most of my life. I actually have three in my back garage. In this article, I will present an old school way of performing measurements with an updated, yet simple seismograph that can be used anywhere.
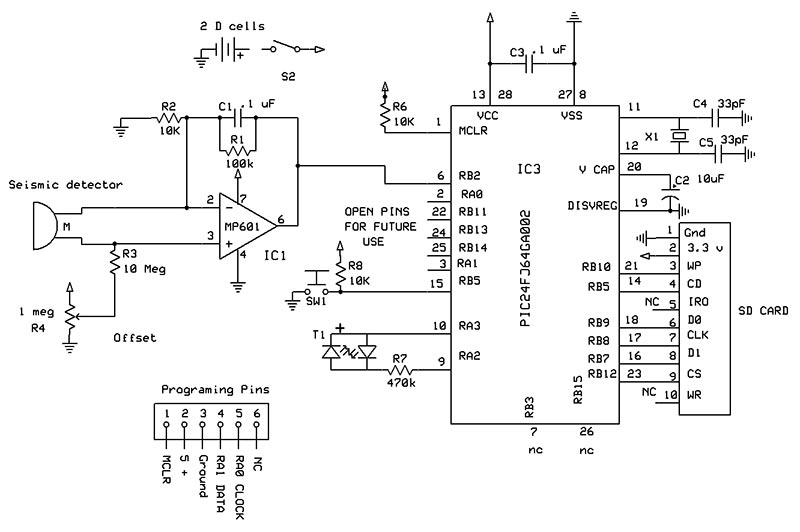
SCHEMATIC.
This is a really great project for science fairs and for those who wish to do their first soldering project; check out the schematic. There are only a couple of surface-mount 805 resistors to install (see Figure 1).
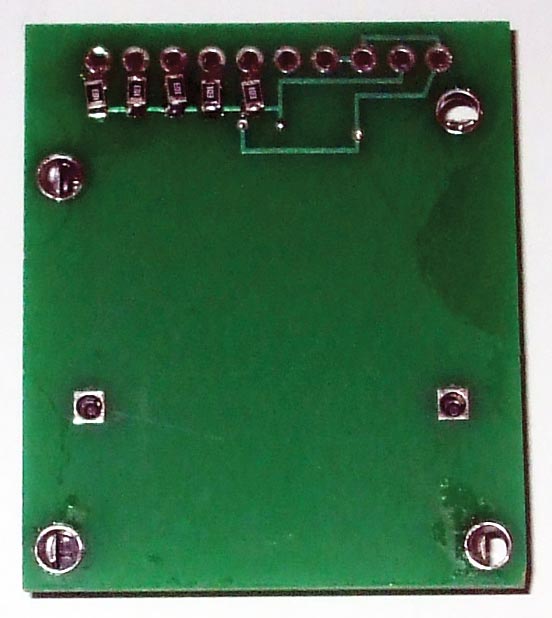
FIGURE 1.
When I started writing this article, I thought I would use the standard Geo Phone that (back in 1999) could be purchased used for $8. Now, they are on eBay for over $60 — too much for hobbyists and too pricey for high school students. Plus, they’re difficult to obtain. I put on my thinking cap and went back to the old pendulum method — one of the methods still being used for seismology. The word pendulum comes from the Latin word pendulus, meaning ‘hanging.’
The period of the pendulum is determined by the length of its swing (not its weight) and is given by the formula of

where T is in seconds, L is in meters, and g is the acceleration of gravity. I decided to use a pendulum with a length of 9.8” (.249 meters) to give a period of one second.
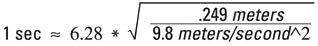
However, the weight of the pendulum does have purpose as it has to keep the bottom of the pendulum steady while the seismic activity moves the top end of it.
The sensor used is a piezoelectric film that generates a small voltage when bent. The brass bar adds the mass, and the piezo sensor acts as a damper. The voltage from the sensor is amplified by an operational amplifier that feeds into a microprocessor (see Figure 2).
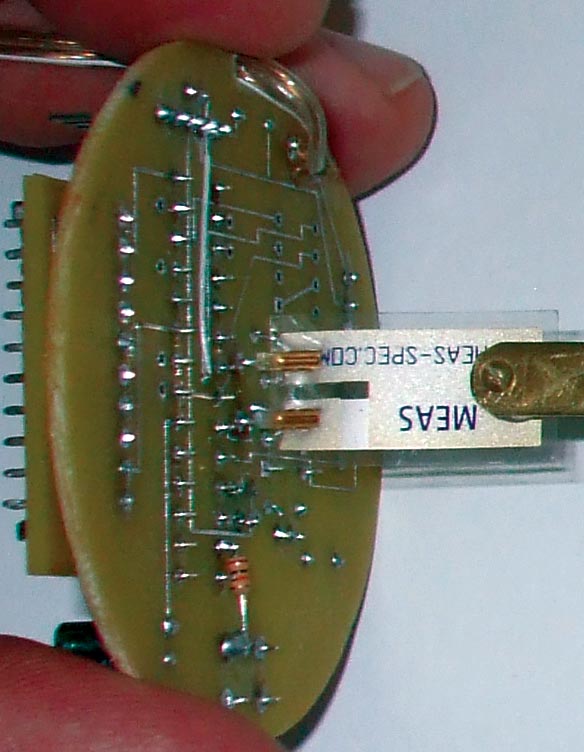
FIGURE 2.
When starting a project, I always list the initial specifications I want to accomplish (which are subject to change, of course). For this project, here’s what I started with:
- Inexpensive
- Portable
- Waterproof
- Battery-operated with a battery life of one year
- Indicator when seismic action has taken place
- Data to be removed and downloaded into a computer
- Cost of building the instrument be below $35
The container for the seismograph is made out of a 13.5” 3” OD PVC tube with either an end cap on the bottom (Figure 3) or a stand using a 3” flange. A piece of Plexiglas on the top is used for viewing the LED to see if seismic action has taken place.
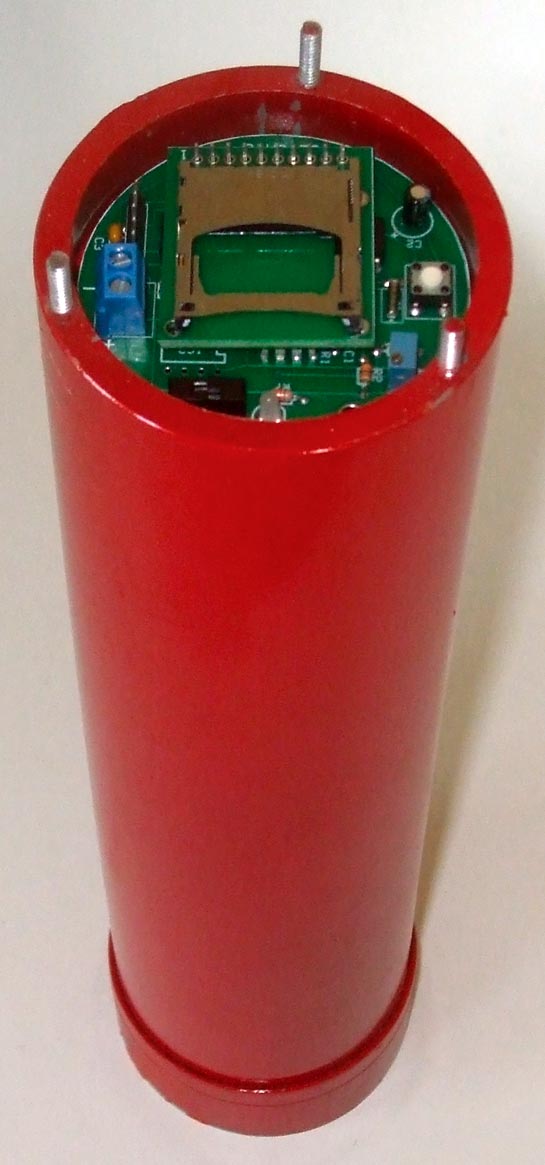
FIGURE 3.
I ended up using two C cells for the power supply. It was determined that the unit draws 1.5 mA when in standby, and the C cells provide six months of service. The series J microprocessors draws less than .1 µA when in standby. However, when the comparator is used, it draws power along with the op-amp which increases its standby power. The Smart Card memory chip takes most of the power. The C cells sit in the bottom of the PVC tube.
The seismic detector is made out of a Measurement Specialties piezo film vibration monitor. As the piezo film is displaced from the mechanical neutral axis, bending creates very high strain with the piezopolmer and therefore, high voltages are generated. A piece of brass bar measuring 9.8 inches is included to add mass using a #1 screw and nut. This bar acts as a pendulum. The sensor provides about one second of damping.
Electronics
The piezo film sensor generates a small amount of voltage when bent or stressed. This voltage is amplified by the use of a FET non-inverting operational amplifier. The amplifier in this configuration gives a very high impedance input. A Microchip MCP 601 was used, since it can be run using a single voltage supply. The voltage is injected in the non-inverting port configured as an adder, summing a voltage provided by the voltage divider potentiometer R4. This voltage is amplified by 11 times with resistors R1 and R2. The amplification of a non-inverting op-amp is:

The vibration waves fluctuate above and below a 1.6 volt offset provided by R4. A 10 megohms resistor prevents offset loading to the transducer. The offset allows ± voltages of the sensor to be viewed on a chart without using ± power supplies. The micro measures the voltage 120 times per second.
The bi-colored LED is turned on/off and changes its color by applying opposing voltages to its leads. The LED can generate three colors: red, green, and yellow. It can also be made to flash.
The microprocessor takes the amplified voltage and is channeled to the micro’s comparator which continues to run when the micro is put to sleep. Thus, the micro draws very little power. When the voltage of the sensor is compared against a 1.6 volt voltage reference and is exceeded, the micro switches from a comparator mode to an analog-to-digital converter mode measuring the voltage digitally.
The micro opens the first text file on the SD card that is named Seismic1.txt. It then will record one minute of data and then flash the LED every four seconds, indicating that a seismic event has taken place. It then waits for another earthquake and the process starts over again. However, the text file is incremented to Seismic2.txt and will continue endlessly. The unit can be downloaded at any time by turning off the power switch. The SD card is then removed and placed into a computer for downloading and viewing.
A Microchip PIC24FJ64GA002 was used for this project since there is plenty of documentation on how to interface with SD cards. (See the October ‘10 issue for the “Implementing a File I/O for the 16-bit Micro Experimenter” article by Thomas Kibalo.)
Constructing the Board
There are two boards for this project. The first one is for the SD card (Figure 4).
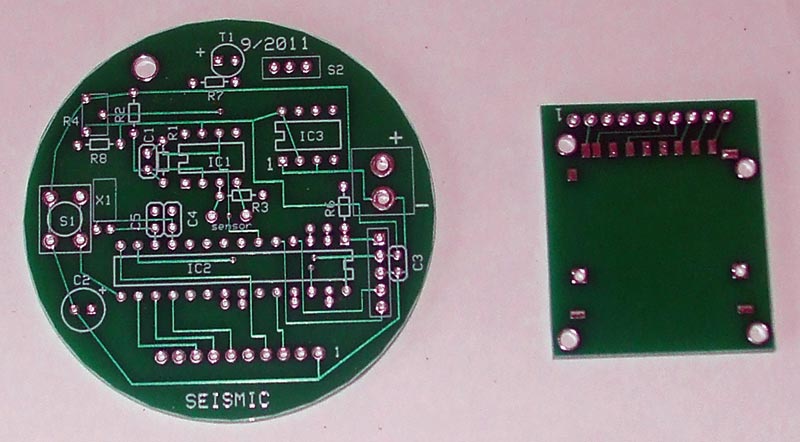
FIGURE 4.
Turn the board over and solder the six 10K 805 surface-mount pull-up resistors. (Refer again to Figure 1.) The best way to do this is to melt a small amount of solder to the top six pads. Using tweezers to hold the 805, touch the tip of the soldering iron to the pad and place the 805 on it, allowing the solder to flow to the resistor. Do this for the rest of the resistors. Now, solder the other side of the resistor to the pads. Make sure you use rosin core solder. I normally use .6 mm diameter. Turn the board over and solder the SD holder to the top side. Solder each of the pins and ears in their respective holes (Figure 5).
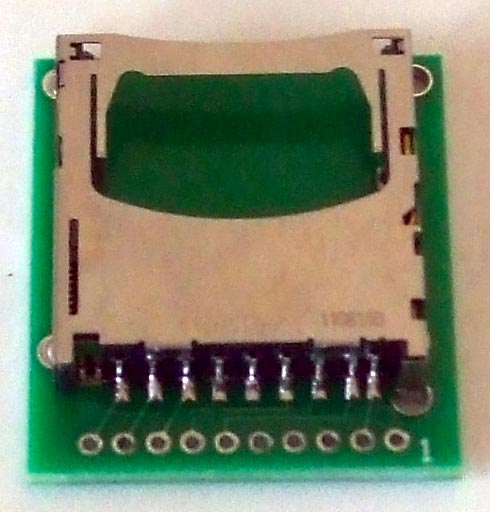
FIGURE 5.
The second board will need to be trimmed to the outside circle. The easiest way is to use a sander. Make sure it will slip into the 3” PVC pipe so you don’t have to sand after the components are placed on the board. All the components are placed on the top of the board with the exception of the sensor.
Solder IC1 and IC2 to the board. Note the square hole is pin 1 of the chips. Place the chip in front of you with its notch pointing left. Pin 1 is the lower left pin. Often, there is a small dimple above it. Watch IC2 as pin 1 is the reverse of IC1. Solder the one meg pot, resistors, capacitors, and the crystal. Note the polarity of the 10 µF cap. Solder the two switches.
Solder the LED with its long lead going to the square pad. Cut two headers: one with 10 pins and the other with five pins. Solder them to the board. There will be extra pads next to the microprocessor that can be used for other projects. Nothing will go in IC3 as this is for a future project. There will also be empty pads for those who may want to add alarms or other items (Figure 6).
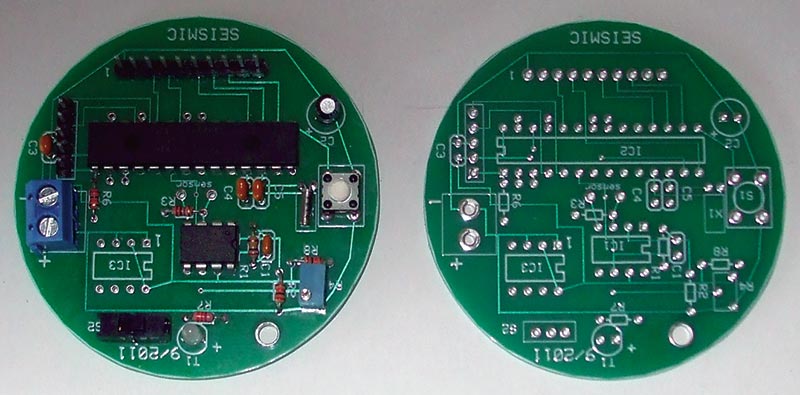
FIGURE 6.
Take the SD circuit board and place it over the 10-pin header. It should rest on the micro. Solder the 10 headers.
Cut the 1/4” x 1/16” brass bar to nine inches. Drill a 1/16” hole 1/8” from one end of the brass bar. Use a #0- 80 3/8” screw and nut, and fasten it to the piezo sensor. Add a drop of fingernail polish to the nut. Solder this assembly to the bottom of the board (Figure 7).
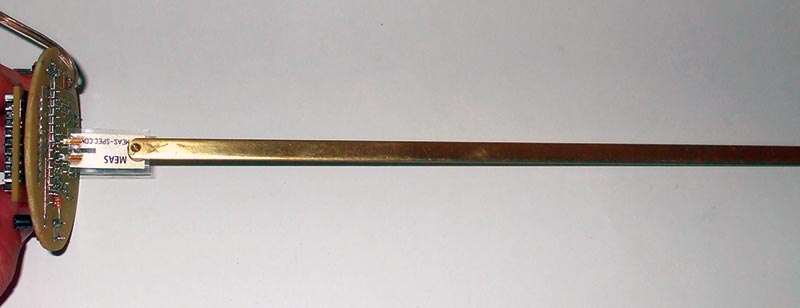
FIGURE 7.
Solder two 13” wires to the battery holder. Make sure you can identify the positive wire. The programming was written in C. The square pad is pin 1 for the programmer. There are only five pins needed (the sixth is redundant).
Container
There are two types of containers that you can use for this project. One is waterproof for placing in the ground; the other is a stand-alone unit which can be mounted on the floor.
The container is made out of a 13.5” piece of 3” PVC pipe plus a 3” flange for stand-alone applications or an end cap for burying. The top of the pipe should be smooth. The PVC pipe will be loose in the flange. With a lathe, I turned 1/2 of a 3” collar to fit the flange. Another way is to use duct tape and build up the pipe to fit the flange.
Go to the Nuts & Volts website and download the files which go with this project. There you will find a template for the Plexiglas lens. Cut out and then glue a 1/4” piece of Plexiglas to it. Sand the Plexiglas to the edge of the circle. Using a 9/64 drill, drill three holes. Remove the template using hot water. Place the lens over the smoothed end of the PVC pipe. Mark the pipe where the holes are.
Using a #36 drill, make the three holes 1/2” deep. Tap each hole with a 6-32 tap. Using three 1” screws, add a drop of super glue to each hole and fasten each screw into the PVC pipe. Use a cut-off tool and remove the heads. If implementing a flange and not a cap, use the bottom template to cover the bottom. Glue this piece to the bottom (Figure 8).
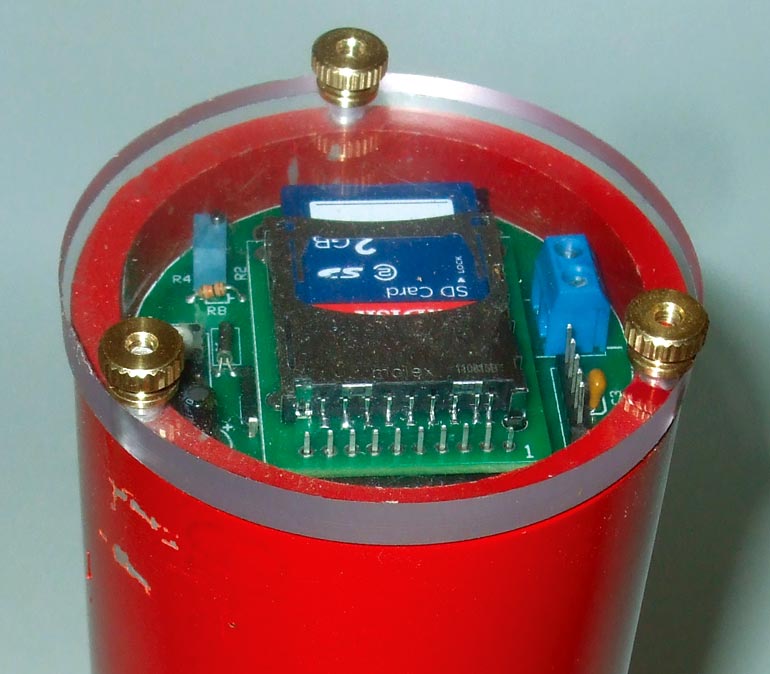
FIGURE 8.
Whether you use the seismograph inside or outside, you will need the lens to protect against air movements. If you are using the unit outside and it needs to be waterproof, buy a 3” flush valve washer. Using the lens, mark the gasket and punch three holes (Figure 9). Place the gasket over the screws. If done properly, the lens should fit over the screws and then can be secured by three knurled nuts.
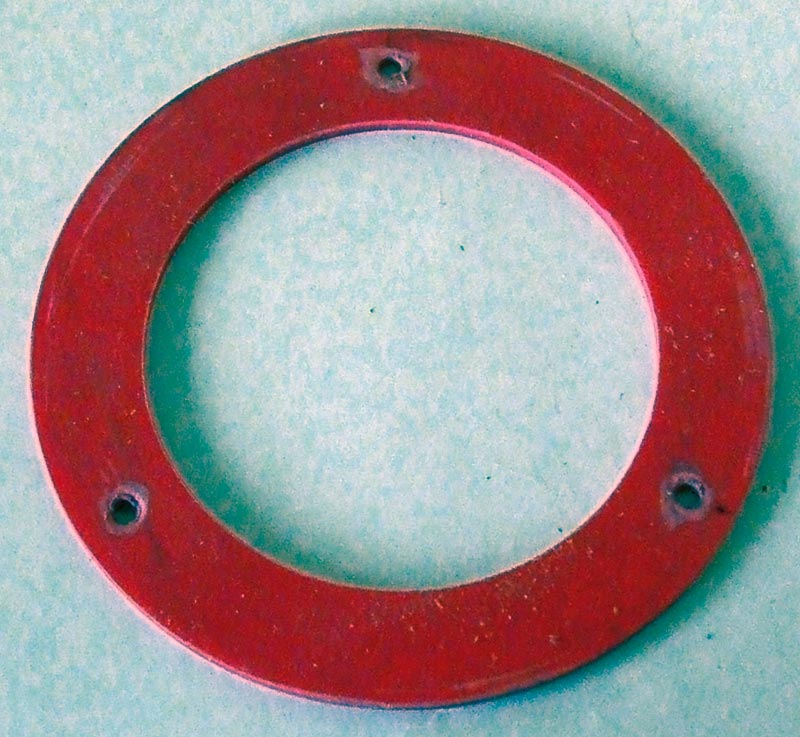
FIGURE 9.
Cut a piece of .06” x .125” Styrene plastic strip to 7.75 inches. Bend the strip and place it 5/8” from the edge of the PVC pipe. Using super glue, attach the strip in place. This will act as a support for the board (Figure 10).
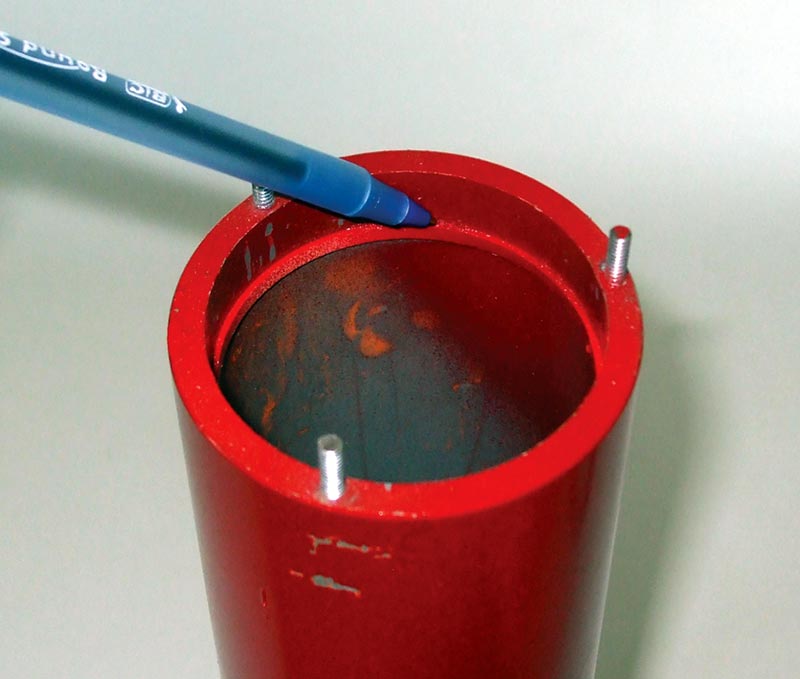
FIGURE 10.
If using an end cap, place the PVC pipe into a bucket or a coffee can to keep it vertical. Load the battery holder with two C batteries and slide it into the bottom of the PVC pipe. Use small pieces of tape to hold the wires to prevent them from hitting the pendulum. Slide the board and its pendulum into the tube, and feed the two wires though the hole next to the pot (Figure 11).
FIGURE 11.
Try not to let them short. Allow the board to sit on its support. Place the two wires in their respective terminals and tighten. You might want to mark the positive terminal with a drop of red fingernail polish. DON’T REVERSE THE LEADS!
Turn on the power switch. The LED should turn red, indicating that power is being supplied. Turn the unit off. Hold the red switch down and turn on the unit. This will place it in the calibration mode. Release the red switch. If the LED is red, turn the pot clockwise until it turns yellow-orange. If the LED is green, turn the pot counter-clockwise until it turns yellow-orange. Set the pot when the LED just turns red. This sets the trip point. Turn off the unit. If the unit is too sensitive, turn the pot counter-clockwise an 1/8 of a turn.
Using the Unit
Using your computer, format an SD card from 256 MB up to 2.0 GB. NOTE: If you have a computer that does not have an SD card port but you do have USB, there are adapters available. A seismic recording only takes up 35.1 kb. That’s a lot of earthquake recordings! Now, we are going to set the time in the microprocessor’s clock. NOTE: If the power is turned off, the micro’s clock will be lost. Download the Excel sheet titled “Time Calculations for Seismic” from the article link. Follow the directions on the spreadsheet. The time is written to the SD card using a BCD format in hexadecimal code. The time.txt file contains six bytes of code for programming the Smart Card. Make sure you allow enough time to place the card into the unit.
Load the card. Turn on the unit. The LED should be red. Watch the clock and when it reaches the proper minute, press switch 1 and release. The LED should flash green indicating that the micro’s clock has been set to the time you programmed on the SD card.
Once you have decided where you are going to place the seismograph, you can activate it by pushing the switch. The LED will turn on steady red for one minute. This will allow you to place the lens on and secure it with the knurled nuts. When the red LED goes out, it indicates that it is armed.
When the unit is jarred or an earthquake happens, the data will be written to the SD card and the LED will turn a yellow–orange indicating that it is making a measurement. Once the unit has made a one minute measurement, the LED will flash red about every four seconds, indicating that an earthquake has occurred.
When you are ready to read the data, remove the lens (this will activate the unit and record the jarring of the removal but it will end up as an invalid txt file). Turn off the power and remove the SD chip.
Viewing the Data
To view the data, go to www.dataq.com and download their free software under the downloads titled “WinDaq Waveform Browser.“ For those of you who are interested in great data loggers and data acquisition, I can’t say enough good things about WinDaq. The browser is also located on the N&V website.
Once the Waveform browser is downloaded, there should be an icon on your computer. Click it. A window should open up. Locate the SD card and make sure you have “Files of type” on “(*.txt)” — look for the “Seismic1.txt” file or other numbered seismic files. Click on this. Perform a save on Seismic1.wdc (default). Use #2 “Spreadsheet print file (ASCII).”
The convert screen should pop up and default on “volts.” Hit the return key. (This is subject to change, depending on what version you have with your browser.)
The Waveform browser should now be visible. If you go to “options” and click on “Cursor time,” the date and time of the earthquake will show at the bottom. Moving the cursor below the red line will show the time. By pressing F4 to place a time marker, you can measure from the time marker the seconds from an event.
There is a plethora of commands you can use in the WinDaq browser, and I defer you to their help menu, since it would take a small book to explain them all. Once you have the screen up, you can calculate the “S” and “P” waves and their times to determine how far away the epicenter was located. Keep in mind that it takes at least three seismographs to locate the epicenter with triangulation. Once you have downloaded your data, delete all the seismic.txt files on the SD card to re-record.
Now, we just have to wait to shake, rattle, and roll! NV
Parts List
| ITEM |
DESCRIPTION |
QTY |
SOURCE |
| C1 |
100 pF 100V ceramic |
1 |
|
| C2 |
10 µF 16V aluminum |
1 |
|
| C3 |
.1 µF 100V ceramic |
1 |
|
| C4-C5 |
33 pF 100V ceramic |
2 |
|
| Header |
.025 square pin .1 |
15 |
|
| IC1 |
MCP601 |
1 |
Microchip |
| IC2 |
PIC24FJ64GA002 |
1 |
Microchip |
| R1 |
100K 1/6 watt |
1 |
|
| R2-R6-R8 |
10K 1/6 watt |
3 |
|
| R3 |
10 meg 1/6 watt |
1 |
|
| R4 |
Trimmer 1M .25 wat |
1 |
|
| R7 |
330 ohms 1/6 watt |
1 |
|
| R9-15 |
|
6 |
|
| S1 |
|
1 |
|
| S2 |
|
1 |
|
| SD Holder |
|
1 |
|
| Sensor |
|
1 |
Measurement Specialties/Schaevitz |
| T1 |
Bi-colored LED |
1 |
|
| X1 |
Crystal 32.768 kHz 6PF |
1 |
|
| HARDWARE |
|
|
|
| Battery holder two C |
|
1 |
|
| Brass bar .25" x 1/16" |
|
1 |
|
| .06 x .125 Styrene strip 7.75" |
|
1 |
|
| 3" OD PVC pipe 13.5" |
|
1 |
|
| PVC end cap or 3" flange |
|
1 |
|
| #0-80 3/8" brass screw and nut |
|
1 |
|
| 6-32 1" screws |
|
3 |
|
| 6-32 brass knurled nuts |
|
3 |
|
| 3.5" x 3.5" 1/4" Plexiglas |
|
2 |
|
| 3" Flush valve washer |
|
1 |
|
| 13" #24 wire |
|
2 |
|
The circuit boards and preprogrammed chips for this project, as well as a complete kit of parts, are available at the Nuts & Volts Junkbox. If you wish to have your own boards made, the Express PCB board files, the Microchip ASM files, along with Hints and Tips, can be downloaded from the link below. Always check to see if there are any updates in Hints and Tips before building.
Downloads
Poor Mans Seismograph Download