An Arduino Uno/MakerPlot Data Acquisition Project
The system described here generates a plot of solar intensity on a PC monitor over the period of a 10 hour day. It can be armed to start the plot at any specified future time. MakerPlot (data acquisition and graphical plotting software for microcontrollers) replaces the Arduino built-in text based serial monitor with a visually interesting display of graphical components consisting of meters, switches, and text/numeric display fields. Data collected is preserved for further study both graphically (automatic plot screen captures) and in text based log files. We'll discuss significant tutorial Arduino/MakerPlot interaction aspects, as well as hints to bypass delays or bugs in future development or enhancement activity.
This simple project actually ignores a lot of MakerPlot’s capability. It's aimed at the reader who is interested in how Arduino code and MakerPlot functionality can interact, and what the result might look like in the context of a simple working project.
Applying a data acquisition system (DAQ) to record sunlight intensity throughout the day makes perfect sense to me. Required hardware is minimal, and working through the related software challenges is a great learning experience.
I first considered using the standard Arduino serial monitor as my user interface, but the MakerPlot package as an alternate approach provides a much more visually interesting display capability. Plus, MakerPlot can provide Real Time Clock (RTC) services to the Arduino microcontroller, which is an important requirement for implementing the sort of scheduling functionally envisioned for this project.
The hardware and software described here comprise a small real time DAQ that currently measures and plots sunlight intensity over a period of time. Instead of sunlight intensity, the system could plot anything that can be converted to a 0-5 VDC signal level for the Arduino Uno’s analog inputs (for example, greenhouse light levels and/or temperature, aquarium temperature, weather station data, or even the RPM of a hamster’s exercise wheel!). Although only one analog variable is tracked in the current application, expansion up to 10 is trivial. Digital on/off data can also be plotted.
The Arduino/MakerPlot/Time library package described here is a perfect platform to collect data from or otherwise monitor the behavior of small laboratory projects.
Application Detail
Besides creating a 10 hour profile plot of sunlight intensity, I wanted the application to provide a means to set up the next day data collection start time the night before, and then have it capture the required solar intensity data for the desired 10 hour period without any further attention from me. After the plot start time is entered, a numeric display field shows remaining minutes in the countdown period until plot start.
The application captures a jpg image of the data plot and Event Log, and saves it to the PC’s hard drive prior to shutting down at the end of the plot period. A collection of recent 10 hour plots can be seen in Figure 1.
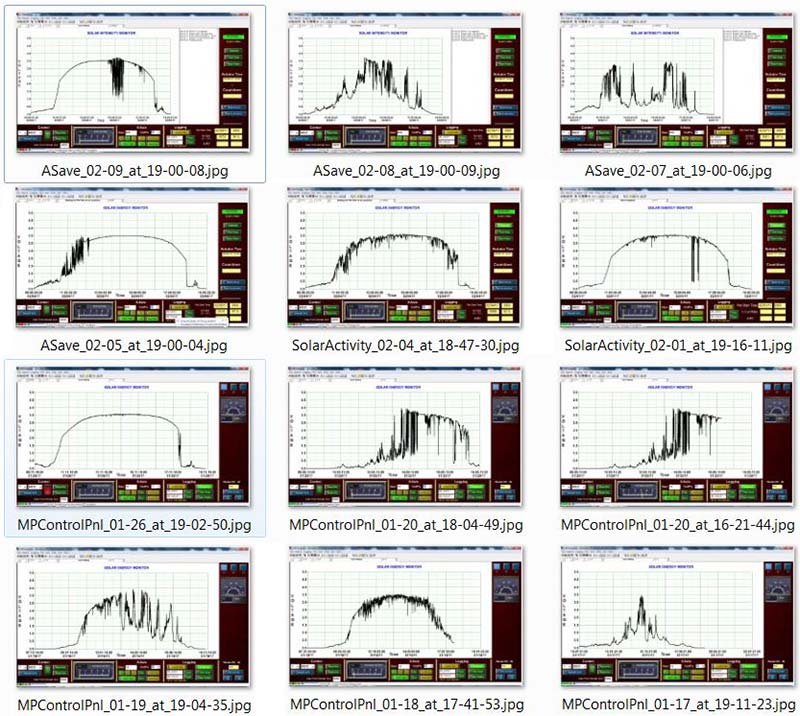
FIGURE 1. A collection of recently captured sunlight intensity plots.
Finally, for reassurance that all is in sync, a display field on the MakerPlot user interface shows what time the Arduino is using so it can be visually checked for agreement with PC time.
Primary Components
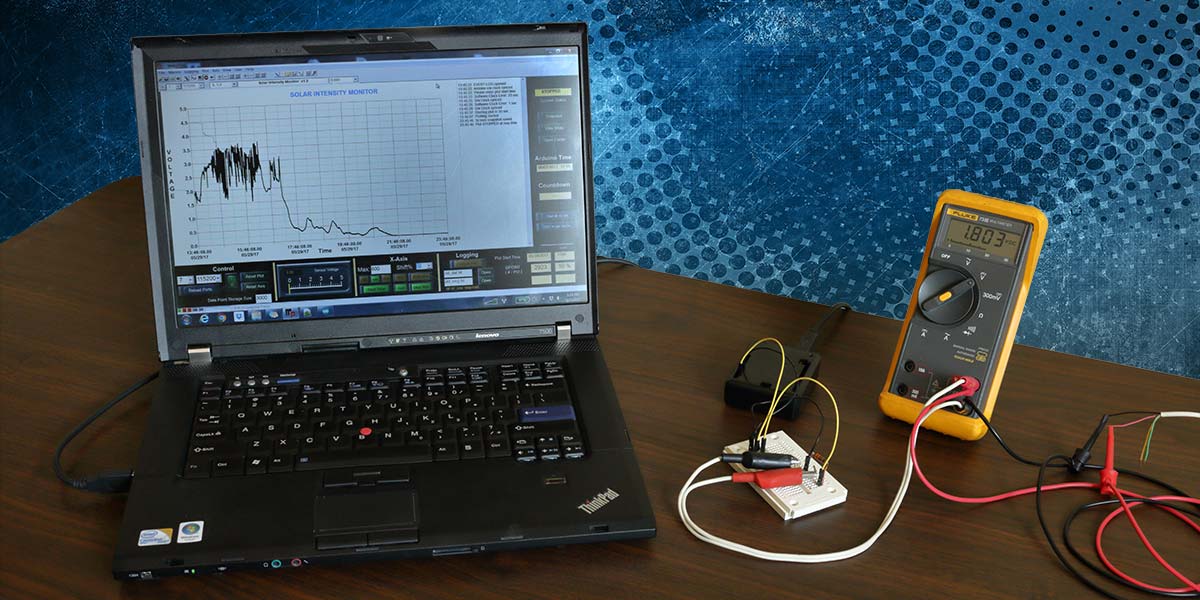
Please refer to Figure 2. The Arduino Uno microcontroller is mounted in the small black dust cover enclosure near the center of the figure. As most readers will already be familiar with the Uno microcontroller (except for unique project specific aspects), further overview information will not be included here.
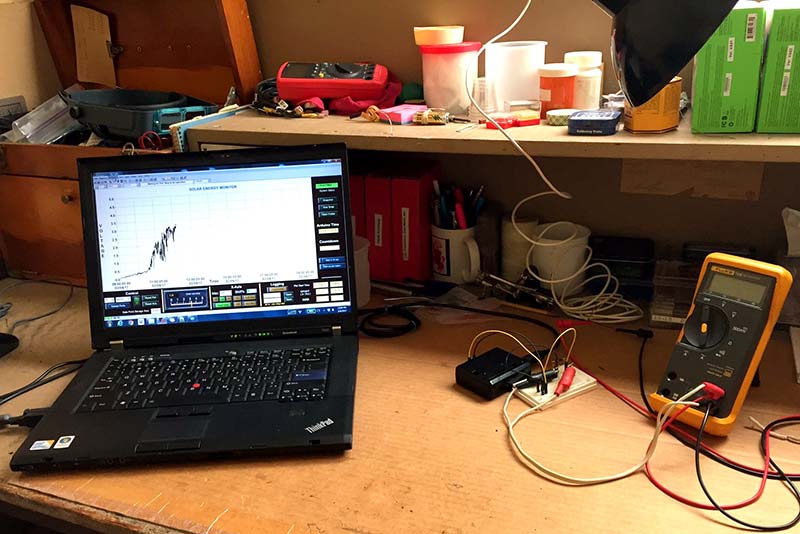
FIGURE 2. A complete data acquisition system: an Arduino in the black plastic enclosure and MakerPlot on the laptop. The wiring goes to the solar cell in the window.
The plugboard (which can be seen in greater detail in Figure 3) serves as a junction box for the various component interconnections required. The white wire with alligator clip connections leads to the solar cell taped to an 8” x 12” piece of cardboard which is propped against a sunny window pane above the workbench. A duplicate of the window mounted solar cell is included in the photo.
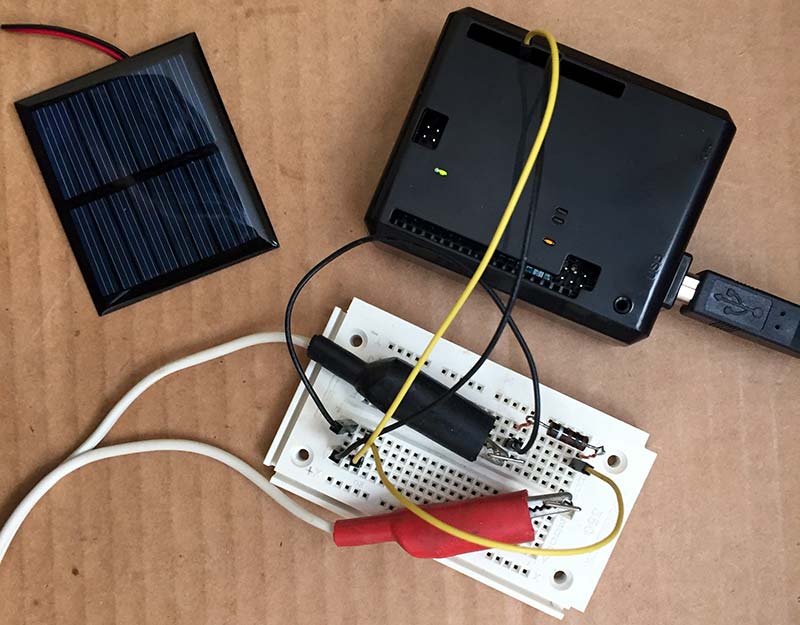
FIGURE 3. Plugboard junction box, Arduino Uno, and duplicate of window mounted solar cell.
The DVM (digital voltmeter) is not required, but you should check to see that your solar cell’s output stays under the Arduino’s analog input max voltage spec of 5 VDC when exposed to maximum levels of sunlIght before connecting it to the Uno. The MakerPlot user interface runs on any Windows based PC and will be discussed further in the next section. Component interconnections are very simple (Figure 4). The 100 ohm load resistor is not absolutely necessary, but its presence will result in an overall lower impedance circuit. We will therefore gain higher noise immunity.
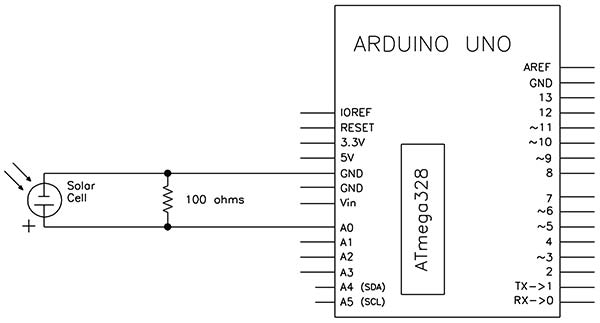
FIGURE 4. Wiring diagram.
MakerPlot
As mentioned, MakerPlot is a collection of control components such as meters, switches, input/output text fields, data plots, and the like which you can place and size as desired on your display screen. MakerPlot replaces the text based serial monitor that is part of the Arduino IDE (integrated development environment) with something much more colorful and visually interesting.
The Arduino and the PC communicate using serial ASCII data over the same USB cable link that is used by the standard Arduino IDE to download a new program into the microcontroller module. No physical cables need to be switched to use MakerPlot; just be aware that you can only do one of two tasks at a time: either display MakerPlot app data or download code to the Arduino controller.
This is the same constraint as when using just the Arduino IDE; sharing the data link between program downloads to the controller and displaying data on the serial monitor. You can do one or the other, but not both.
To allow MakerPlot to use the link, simply click the CONNECT switch at the lower left of the user display (Figure 5) which causes the switch to turn green. That will give MakerPlot control of the link. To give the link back to the Arduino later for another program download, simply click the CONNECT switch again. MakerPlot will give up control of the link and the switch color will turn red.
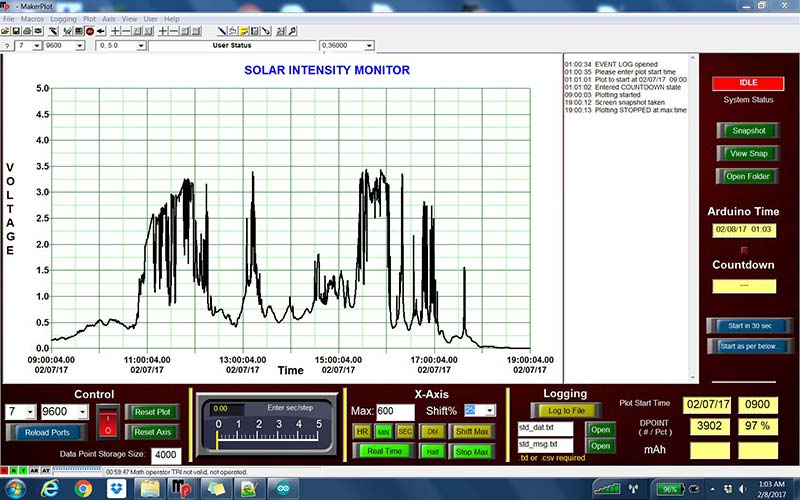
FIGURE 5. User control panel.
If you do forget and leave the link connected to MakerPlot while simultaneously attempting to download a new program to the Arduino, no harm will be done. However, the download will fail and the Arduino IDE will protest. (I have done this by mistake more times than I can count!) Many specific examples of coding for Arduino/MakerPlot data transfer in both directions will be described later in this article.
Any data acquisition system needs to know real world time. The Arduino has no built-in facility for this. You could add an additional RTC module based on (for example) a DS1307 chip to the system, but you don’t need to! MakerPlot can provide the PC’s time and date information to the Arduino program. Additionally, using the Arduino Time library makes it easy.
The Arduino Time library (contributed by Michael Margolis) is a key factor in simplifying adding real time monitoring and control capability to projects such as this one. You can easily add this optional library to your library collection from inside the Arduino IDE (Sketch > Include Libraries > Library Manager ...); refer to Figure 6.
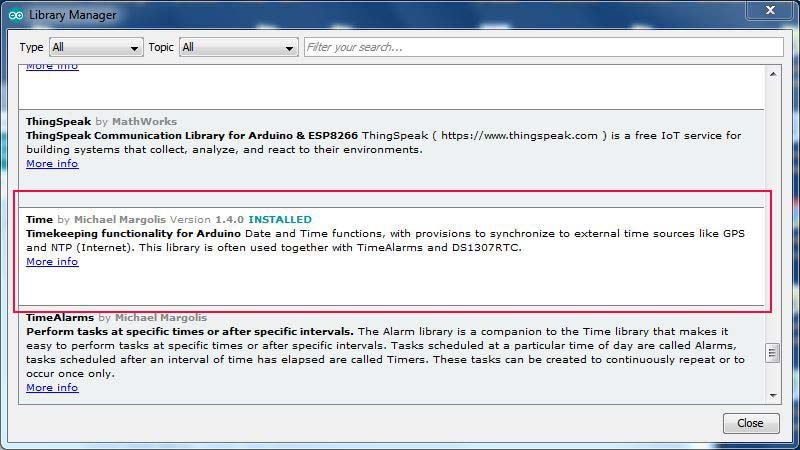
FIGURE 6. Use the Library Manager to install a copy of the Arduino Time library on your PC.
The library is built around a software clock. It has all of the functions you would expect to retrieve; typical date/time variables such as month(), day(), year(), hour(), min(), and sec(), plus many others that you will more fully appreciate when you start developing your own software with it. To make this clock into a first class time reference, you will want to periodically synchronize it to an accurate time source; in our case, the PC’s internal clock via the MakerPlot/PC comm link. (Example code will follow.)
Because your PC’s clock is almost certainly synced with an Internet Time Service (or could be), you now have an excellent real time capable data acquisition and control system at your fingertips!
As a test, I set the software to sync the Arduino clock to the PC/MakerPlot clock once per hour and logged the resulting hourly drift data for an 11 hour period (SYNC_TIME_INTERVAL = 60). This setting was sufficient to keep the hourly interval drift errors to one second or less over the entire period.
First Use
Let’s take one trip through a first use scenario. Then, we will look at software detail.
1. Install the Arduino Time library, and compile and download the .ino file to the microcontroller using the Arduino IDE.
2. Assuming you have already installed MakerPlot on your PC, double-click the MakerPlot sim.spm file as furnished in the downloads at the article link. That should open the user interface for the project on your PC. (The location of the sim.spm file is not important. Just put it in an appropriate place in your Arduino projects folder after expanding the ZIP file.)
3. For this first test, use the X axis controls to set the X axis for a 60 sec total span. (Normally for a 10 hour plot, this would be set for 600 min.) Also, click the “Stop Max” button which will freeze the plot when it reaches the right margin.
4. Click the red CONNECT rocker switch at the lower left to give the Arduino/MakerPlot communications link to MakerPlot, which will then establish a connection to the Arduino Uno and cause your sketch’s setup() code to run. You should see the Arduino time field update after a few seconds, and the system state should show IDLE.
5. The Event Log will open to the right of the plot, and prompt you to enter a plot start time.
6. Press the “Start in 30 sec” button. It should turn bright blue and stay that way for a few seconds until the Arduino code sees the flag, services your request, and then resets the switch back to a dark blue color again
7. In a few seconds, the system state will change to COUNTDOWN and you should soon see the countdown time field begin updating.
8. When the countdown reaches zero, plotting will begin. After a few more seconds, you should see a black line begin to work its way across the plot grid. (You can test this even without a solar cell connected. An unconnected Arduino analog input will float at around 1.5 volts and you can use that as your test input.)
9. When the plot reaches the right margin, plotting will stop.
10. Click the green “Open Folder” button. You should be able to see a screen capture snapshot of your recently made plot there.
11. Click the now green CONNECT switch again to turn it red and disconnect MakerPlot from the microcontroller; thus relinquishing the link back to the Arduino IDE.
12. To repeat, wait about 10 sec, click the now red CONNECT switch turning it green. This will also have the same effect on the microcontroller as pressing the reset switch. The Arduino program will restart and run the setup() code again. If desired, enter a new plot start day and time, then click one of the two blue buttons and walk away. You’re done!
13. To abort at any point, click the green CONNECT switch, turning it red and disconnecting MakerPlot from the Arduino.
Software Detail
Source comments were freely applied throughout the Arduino code listings. If your intent is a more thorough understanding of this implementation or to go on and generate your own tailored version, spending time looking through the source code would be rewarding. A few key aspects thought to merit additional emphasis are highlighted next.
Most of the comments offered here are directed toward the reader intending to modify and enhance our sunlight intensity monitoring project, targeting his or her own new but similar application.
F-Macro: The F-Macro has nothing to do with Arduino/MakerPlot coding technique, but you will see it in the example code that will follow shortly. The need for the F-Macro is related to how the Arduino compiler handles memory assignment for literal data. See the F-Macro sidebar for more information.
The F-Macro
Arduino old timers will be familiar with the F-Macro. Newcomers may benefit from this short explanation.
Arduino microcontrollers have three kinds of memory: Flash memory (program memory) which is relatively plentiful (the Uno has 32K); EEPROM; and SRAM, which is fast but relatively scarce. (The Uno has only 2,048 bytes of SRAM.)
The best use of valuable SRAM memory is for the storage of local variables.
The problem is that the Arduino compiler stores literal strings ("This is a literal strIng") in SRAM, which is a waste of a scarce resource. Literal strings don't even change! When SRAM usage gets up to 80% or so, hard-to-find program bugs can really ruin your day!
The F-Macro causes literal strings to instead be stored in cheap relatively plentiful Flash/program memory. All you have to do to use the F-Macro is to insert #include <avr/pgmspace.h> at the top of your program, and instead of writing something like the following:
Serial.println("Setpoint reached!");
Write this instead:
Serial.println(F("Setpoint reached!"));
Watch the compilation report text on the Arduino IDE after a successful compile, and download to see how you are doing with these critical resources. Program memory and SRAM usage are both reported there.
When I first started developing the solar intensity monitoring software, I was not using the F-Macro, and SRAM usage got up as high as 73%. However, at this point, the project was only about halfway done with the development work!
To relieve this situation, I edited in the F-Macro wherever I could, and SRAM usage dropped to 25%. Now with the development work mostly complete, SRAM usage is only at about 30%.
Machine State: At any point in time when it is running, the solar intensity monitor is in one of four states: IDLE, COUNTDOWN, PLOTTING, or STOPPED. The current state determines what variables are monitored for enabling progression to the next state. (For example, user entry of a plot start time triggers progression to the COUNTDOWN state.)
Command Termination: Arduinos and MakerPlot communicate with short ASCII messages (command strings) which must be formatted as a single text string and terminated with a carriage return. In building a lengthy command string with several substrings and print statements, this means that only the last one should be Serial.println(). Other previous substrings will use Serial.print(). See the example shown under Plot Grid.
Example of an Arduino command sent to MakerPlot: (e.g., Reset Plot, Label Y Axis, Stop Plotting). These commands are prefixed with a ‘!.’ A complete listing of MakerPlot commands can be found in the MakerPlot User Guide (Section 15: Control instruction Summary; see Resources) Examples are:
Serial.println(F(“!SPAN 0, 5.0”));<br />
Serial.println(F(“!PLOT OFF”));   <br />
Serial.println(F(“!YLBL VOLTAGE”));
Example of Arduino sending an update to a MakerPlot Control object: For instance, updating a meter to move its pointer from its current position to “74” on the meter scale, or to display a switch in the ON rather than OFF position. The meter shown in Figure 7 is typical. In this case, the object name voltmeter was manually assigned, but if the developer chooses not to assign one, MakerPlot will assign its own unique identifier.
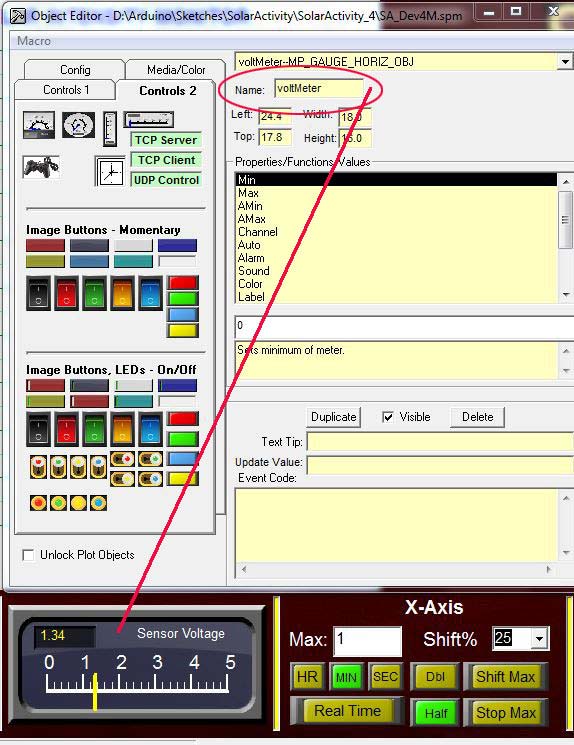
FIGURE 7. This meter is a typical MakerPlot control object. Each has a set of object properties and a unique name.
The four numeric coordinates (Left, Top, Width, and Height) can be manually changed, but it is more likely you will use your mouse to move and resize the object. Select one of these four fields with a mouse-click first; then use the arrow keys to move or resize the object.
Sixteen object properties/functions/values are listed for this meter and are read/write accessible to Arduino code (must scroll to see them all). Three of the 16 are used in this project: Value which is updated once during every loop() scan; and Max and Label which were configured and saved when the display was originally built. The code fragment which is used to update this meter and also the plot is:
//  service the plot grid and meter<br />
float v1 = (5.0 * analogRead(A0))/1024;<br />
Serial.println(v1);<br />
   // Bare numeric values like this go directly to the plot<br />
   // Update the meter<br />
Serial.print(F(“!POBJ voltMeter.value =  “)); Serial.println(v1);
Note the use of print() vs. println() in the last line above. Very important!
Another example of MakerPlot object update coding is the fragment below where the red IDLE status text display (Figure 8) is updated to instead show a blue COUNTDOWN system state indication.
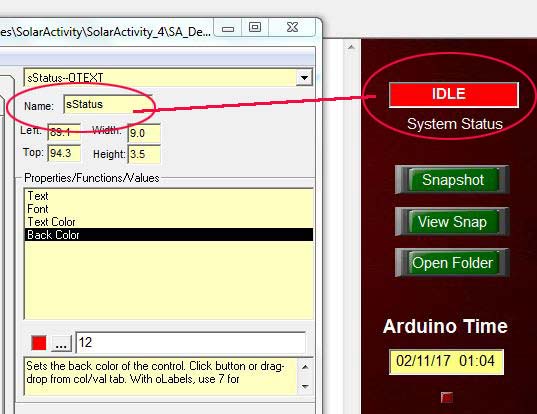
FIGURE 8. A simple text box shows which of the machine's four states (IDLE, COUNTDOWN, PLOTTING, STOPPED) is current.
Only four properties are available in this text object for updating by the Arduino, and we will use three of them:
Serial.println(F(“!POBJ sStatus.Back Color = 9”));    // Blue<br />
Serial.println(F(“!POBJ sStatus.Text Color = 15”));   // White<br />
Serial.println(F(“!POBJ sStatus.Text =  COUNTDOWN”));
This is very similar to the voltmeter example above. A little simpler perhaps since no variable like voltage in the previous example is involved. It is all static data!
Plot Grid: The second statement in the previous voltmeter fragment updates the plot grid. Up to 10 points can be plotted simultaneously. If you wanted to plot four points, for example, the statement would be expanded to something like this:
Serial.print(v1); Serial.print(“,”); // building comma separated string<br />
Serial.print(v2); Serial.print(“,”);  <br />
Serial.print(v3); Serial.print(“,”);  <br />
Serial.println(v4); // println on ONLY the last one!
For illustrative purposes and assigning arbitrary example values for v1 through v4, the carriage-return-terminated ASCII string MakerPlot would accept and plot would look something like:
1.37,2.5,3.00,0.54CR
Receiving data from MakerPlot: We have looked at example code for sending commands (e.g., !PLOT ON) to MakerPlot and also for sending updates to a MakerPlot object (!POBJ sStatus.Text = COUNTDOWN).
What about the Arduino getting data from MakerPlot? How would you get the current date and time from MakerPlot? (I’m sure by now you have guessed that a bunch of Serial.print() and Serial.println() statements are involved!)
MakerPlot always has the current date and time available (as determined by the PC’s clock) in its DATE and RTIME variables. So, you would ask it to send the current values (already formatted as mm/dd/yy and hh:mm:ss strings) back using the MakerPlot !SEND or !READ commands as shown in the following code fragment.
FIGURE 9. Temporary test of Arduino current date and time display in two unused spare user interface text boxes.
Also shown is how you might then use those results to update text field objects on your user display (Figure 9):
Serial.println(“!Send [(DATE),Trim] “);     <br />
String dField = Serial.readString();<br />
Serial.println(“!Send [(RTIME),Trim] “);     <br />
String tField = Serial.readString();<br />
Serial.print(“!POBJ dField.text =  “); Serial.println(dField.c_str());<br />
Serial.print(“!POBJ tField.text =  “); Serial.println(tField.c_str());
Note, however, that you will only infrequently request time related data from the PC via MakerPlot; for example, when you are originally setting or later syncing the Time library clock. Most of the time, if you want current-instant data, you should instead use the library hour(), minute(), second(), etc., functions to get the desired data relying on sufficiently frequent PC/Arduino sync activity to ensure that this locally-maintained software clock time data is accurate.
For example, refreshing the Arduino Time as displayed on the MakerPlot user interface display is as simple as executing the following code fragment on every pass through the loop() code in your Arduino sketch:
// Update MakerPlot display of Arduino time and date<br />
void updateMPlotTime() {<br />
   char aTime[25];<br />
   sprintf(aTime, “d/d/%4d  d:d:d”,<br />
         month(), day(), year(), hour(), minute(), second());<br />
   Serial.print(F(“!pobj aTime.text = “)); Serial.println(aTime);  <br />
}
Syncing the library software clock: The following function is called initially by setup() to initialize the software clock and later by loop() every SYNC_TIME_INTERVAL minutes to re-synchronize it:
// Synchronize the Arduino Time Library software<br />
// clock with the PC clock via the MakerPlot<br />
// comm link. First get current date & time data<br />
// from the PC via MakerPlot.<br />
   flushBuffer();     <br />
   Serial.println(“!Send [(DATE),Trim] “);<br />
   String dateStr = Serial.readString();<br />
   int yr   = dateStr.substring(6,8).toInt();<br />
   int mo   = dateStr.substring(0,2).toInt();<br />
   int day  = dateStr.substring(3,5).toInt();  <br />
   flushBuffer();<br />
   Serial.println(“!Send [(RTIME),Trim] “);<br />
   String timeStr = Serial.readString();<br />
   int hr   = timeStr.substring(0,2).toInt();<br />
   int min  = timeStr.substring(3,5).toInt();<br />
   int sec  = timeStr.substring(6,8).toInt();
// Set the Arduino s/w clock == PC clock<br />
   setTime(hr, min, sec, day, mo, yr);
As you can see, we first ask MakerPlot to send the PC’s current date string (mm/dd/yy), parse it for month, day, and year, converting from ASCII to integer at the same time. Then, we do the same for the time (hh:mm:ss) string. Finally, we call the Time library setTime() function to actually set (or update) the software clock.
Persistent Offered Start Time: I wanted to make it as easy as possible to arm the system for countdown to the next plot start time. You can enter any future date and time you like. However, tomorrow’s date with the start-time equal to the previous start-time entered is offered as the default subject to your edits.
Make your desired changes to the date and time first, then click the blue Start as per below... button.
The Arduino startup() function increments today’s date by one day, and posts it to the plot start time date entry field at the lower right. It also retrieves the previously used start time from the Uno’s EEPROM and restores it to the start time field.
The need for flushBuffer(): Misinterpretation of data and commands in the serial communications queue between the Arduino and MakerPlot can happen. You must ensure that the queue is empty before the Arduino initiates a transaction.
That is the reason for the frequent use of flushBuffer() that you see in these examples and in the downloaded source code. See page 108 in the MakerPlot User’s Guide for more information.
Building Your Own MakerPlot User Interface Display
It is possible to start from scratch and build your own user display utilizing MakerPlot control objects, but I don’t recommend starting there.
Consider that an .spm file is to MakerPlot like an .xls file is to Excel (or like a .doc file is to Word). It is the data file that MakerPlot uses to build the control surface display you see on your screen. The .spm file is an ASCII text file and can be examined with Notepad.
All of the MakerPlot example user interface screens can be found at C:\Program Files\MakerPlot\Macro \interfaces as .spm files. To use one of them as a starting point for your personalized display, go there and copy (for example) the mp_alarming_meters.spm file to your normal Arduino work area. You should rename it also, but make sure you keep the .spm file extension. I suggest you put it in a MakerPlot folder under your Arduino folder.
Double-click your copy of the file and it will open in MakerPlot. To free up a small work area, reduce the size of the plot grid. Open the Object editor (second button from the right on the toolbar) and set the Plot Percent to 50% in the X direction and 80% in the Y direction (Figures 10 and 11).
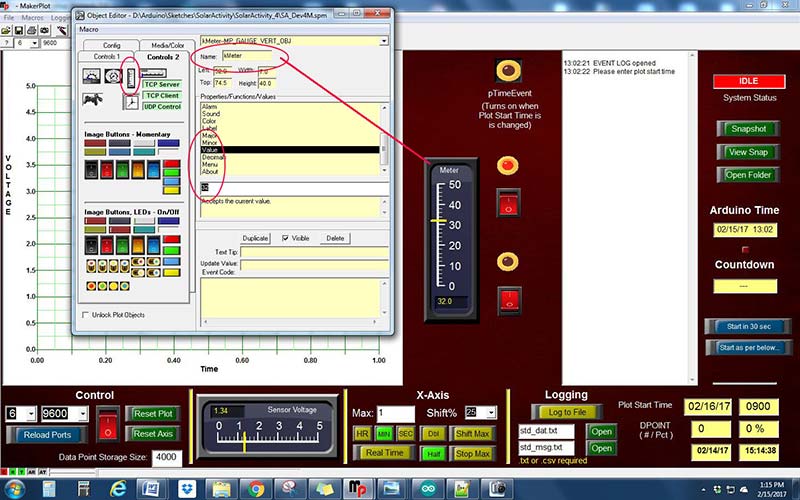
FIGURE 10. Uncover a hidden experimental area behind the plot grid.
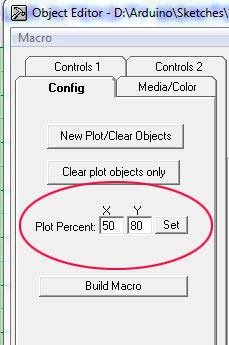
FIGURE 11. Shrink the plot grid to make room for more control objects.
Time to experiment!
1. Drag a control (e.g, a meter) from the Controls 1 or Controls 2 tab of the Object Editor to the recently freed area of the display.
2. Once in place, shift-right-click to select it. Click the left field in the Object Editor; then use the arrow keys and shift-arrow keys to experiment moving the object.
3. In a similar manner, select the Height field and use the arrow keys again this time to resize the object.
4. Give your control a more memorable name than the one assigned by MakerPlot. Don’t forget to hit ENTER to terminate your entry.
5. Take a test drive:
A. In the Object Editor — assuming your test object is a meter — select the value property and try entering a few different values to see it animate.
B. Assuming that worked, select menu>View>LOG(Debug/Immediate), or click the fourth button from the right end of the toolbar and enter the following command at the bottom (assuming the object name was kMeter):
!POBJ kMeter.value = 25.
C. We’re on a roll! Let’s try to write a simple sketch to ramp the meter up and down. Put the following code in the setup() section of a new sketch and leave loop() empty.
Don’t forget to click the red/green CONNECT button on the MakerPlot display to get things started:
while (true) {<br />
    for(int i=0; i < 50; i+=5){<br />
       Serial.print(“!POBJ kMeter.value = “);<br />
       Serial.println(i);<br />
       delay(1000);         <br />
    }<br />
    Serial.print(“!POBJ kMeter.value = 0”);<br />
}
6. Save your work! If you make any additions or changes to your user interface (.spm file) that you want to keep, YOU MUST EXPRESSLY SAVE your work before closing MakerPlot.
You will NOT be prompted to do so when you click the red x at the upper right to close MakerPlot. (You might find that a little shocking, but you will probably decide as I did after getting used to MakerPlot, that this makes sense in normal .spm file use.)
To save the changes in this special screen development situation, follow these steps:
A. Open the Macro Builder by clicking the last toolbar button on the right (wrench symbol).
B. Some of your changes at this point exist only in memory. You must also click the wrench symbol at the top of this Macro Builder window to rebuild the macro prior to saving it.
C. Now, click the DOWN ARROW button and complete SAVE AS to your hard drive (Figure 12).

FIGURE 12. Save a copy of your recent user interface display changes with the Macro Builder control panel.
D. In the future, double-click this new .spm file to start MakerPlot. You will find all of your previously made changes in place when it opens.
7. At some point, you will want to delete some of the original control objects from the starter example screen to make room for new ones of your own choice. I have found that most of the groups of controls across the bottom of the mp_alarming_meters.spm interface display are quite useful.
I try to leave them in place across the bottom, and use the right side for my specific control objects. Shrink the plot grid to make more space if necessary using the Object Editor Plot Percent configuration fields mentioned earlier.
Log(Debug/Immediate) Window: Unfortunately, you still have to write special debug code yourself when needed, but MakerPlot’s separate Log/Debug window is very helpful to watch debug variables as the program runs, helping you track down inevitable bugs.
You already saw one way previously to use this window in the immediate mode (Step #5b above) to simulate commands from the Arduino code and see if MakerPlot reacts as you expect. In that scenario, whatever you type is immediately acted on by MakerPlot.
The second use is more like as a log file. You can add Arduino code to display status messages or variable values of your own choosing in the debug window. Example statements are:
Serial.println(“!DBUG About to enter the<br />
statusRefresh function “);<br />
Serial.print(“!DBUG Old DPOINT counter<br />
value: “);   Serial.println(oldDpoint);<br />
Serial.println(“!DBUG (RTIME) Plotting stopped”); // Timestamped message
More ambitious debug listings are also possible. Perhaps something that displays an ASCII string in hex format.
As you might have guessed from the eight checkboxes along the bottom of the debug window, you can eavesdrop on a subset or essentially all Arduino/MakerPlot communication messages. This is an immense help in debugging the type of errors that might arise from development efforts in this and similar projects. Typical output would be similar to that shown in Figure 13.
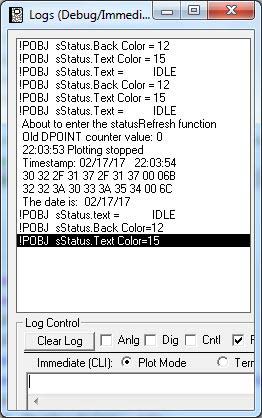
FIGURE 13. The Log (Debug/Immediate) window is helpful in development activity. Use it to display debug variables or to test proposed Arduino command formats to MakerPlot.
It is also possible to limit the display of debug messages to only those containing a target text string entered into the filter text box at the bottom of the window (not visible in the figure).
Closing Thoughts
This simple project actually ignores a lot of MakerPlot’s capability. It is aimed at the reader who is interested in how Arduino code and MakerPlot functionality can interact, and what the result might look like in the context of a simple working project.
If you are serious about applying these techniques to future microcontroller projects, the next step is to spend some time with the rather hefty MakerPlot User’s Guide!
Good luck and happy plotting! NV
RESOURCES
More information on the Arduino microcontroller can be found at:
www.arduino.cc
www.sparkfun.com/products/11021.
Dust cover/plastic protective enclosure for the Arduino Uno:
www.sparkfun.com/products/12839.
MakerPlot is described by the manufacturer as a “Data Acquisition and Graphical Plotting Software Package for Microcontrollers.” A free 306 page user guide and a free 30 day trial installation is available, as well as a discount for Nuts & Volts readers who decide to purchase MakerPlot at https://store.nutsvolts.com/books/sku17212.
Nuts & Volts published a 10-part series of articles on MakerPlot between October 2013 and July 2014 (“MakerPlot — The DIY Software Kit,” by John Gavlik and Martin Hebel). If you have a Preferred Subscriber Network subscription to Nuts & Volts, you already have digital access to these archived issues. Or, you can purchase individual back issues at the Nuts & Volts web store at www.nutsvolts.com.
More information on Arduino SRAM and use of the F-Macro can be found at:
http://playground.arduino.cc/Learning/Memory.
The solar cell used in this project was part of a small solar USB charger kit available from KipKay Kits. However, there is no need to purchase the entire kit just for the tiny solar cell included in it. Any small solar cell should work; perhaps with the addition of a small two-resistor voltage divider if the cell’s rated output is greater than the 5V max of an Arduino analog input. The 4.2 volt cell (PN 228030) available from Jameco Electronics should work fine.
www.jameco.com
Downloads
What’s in the zip?
Source code